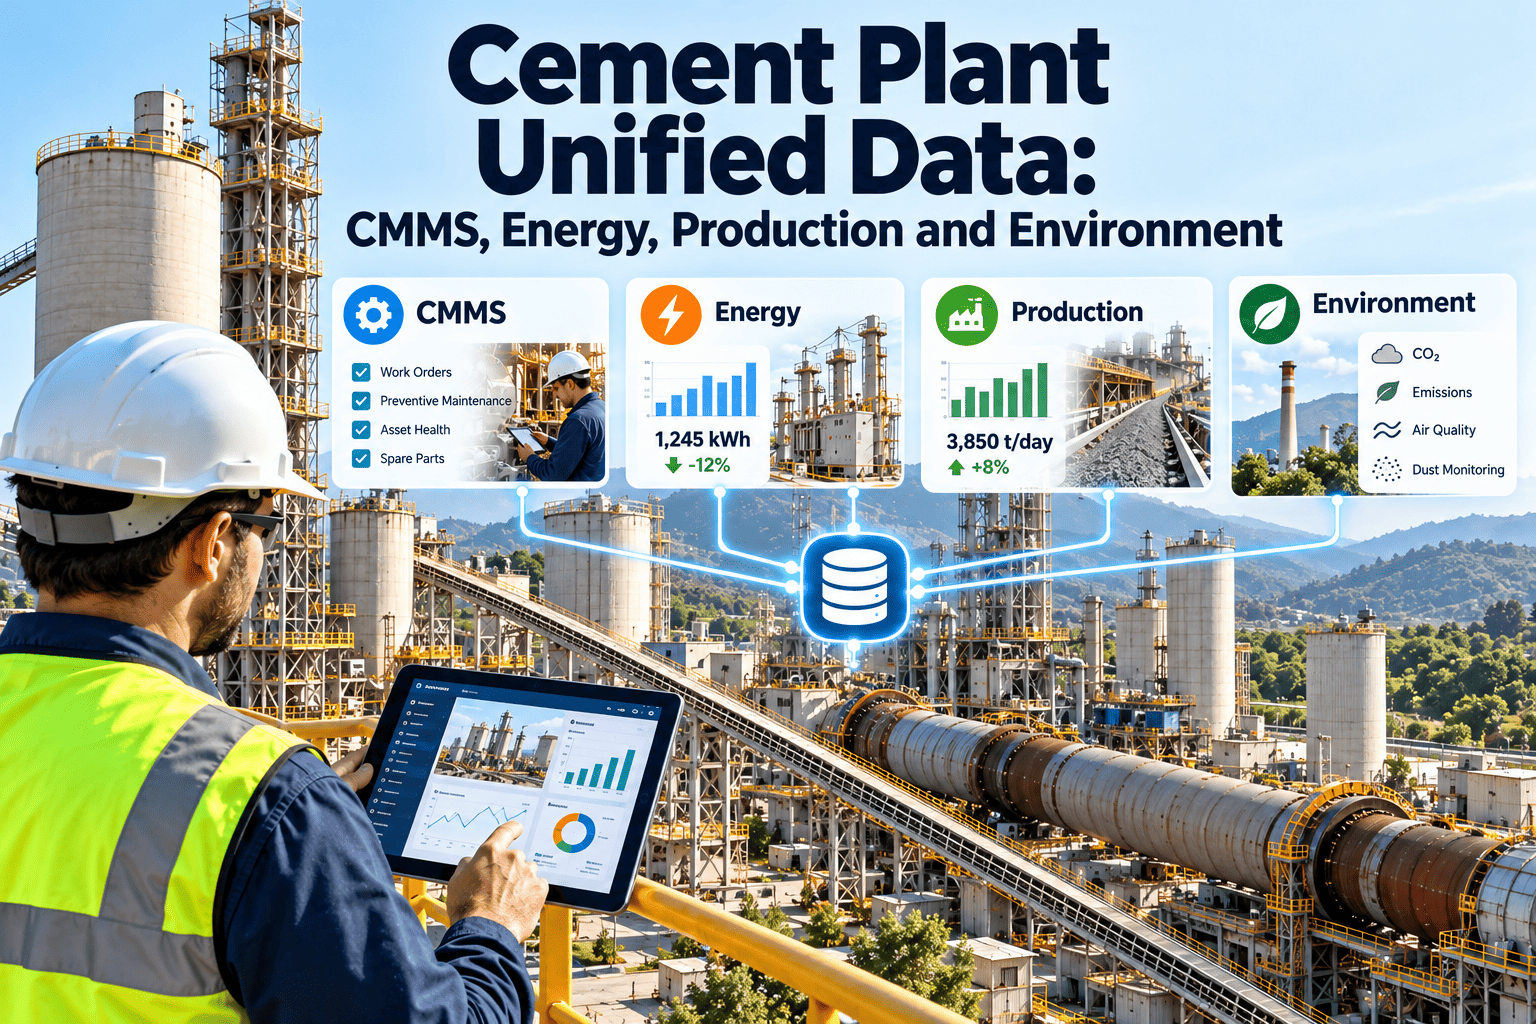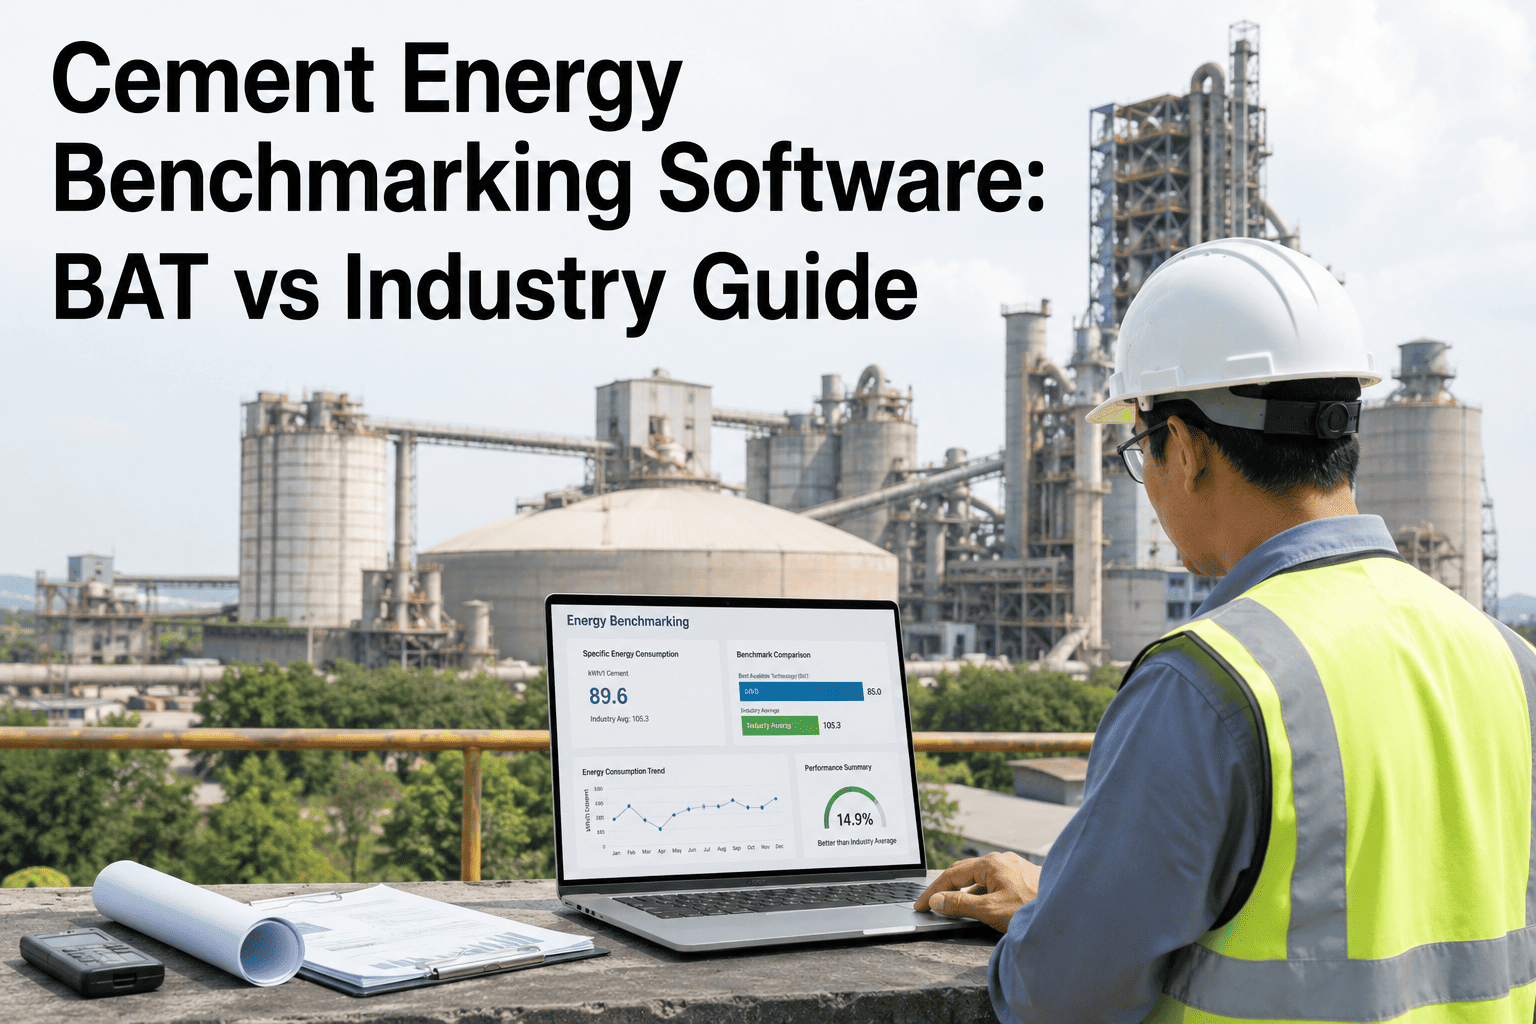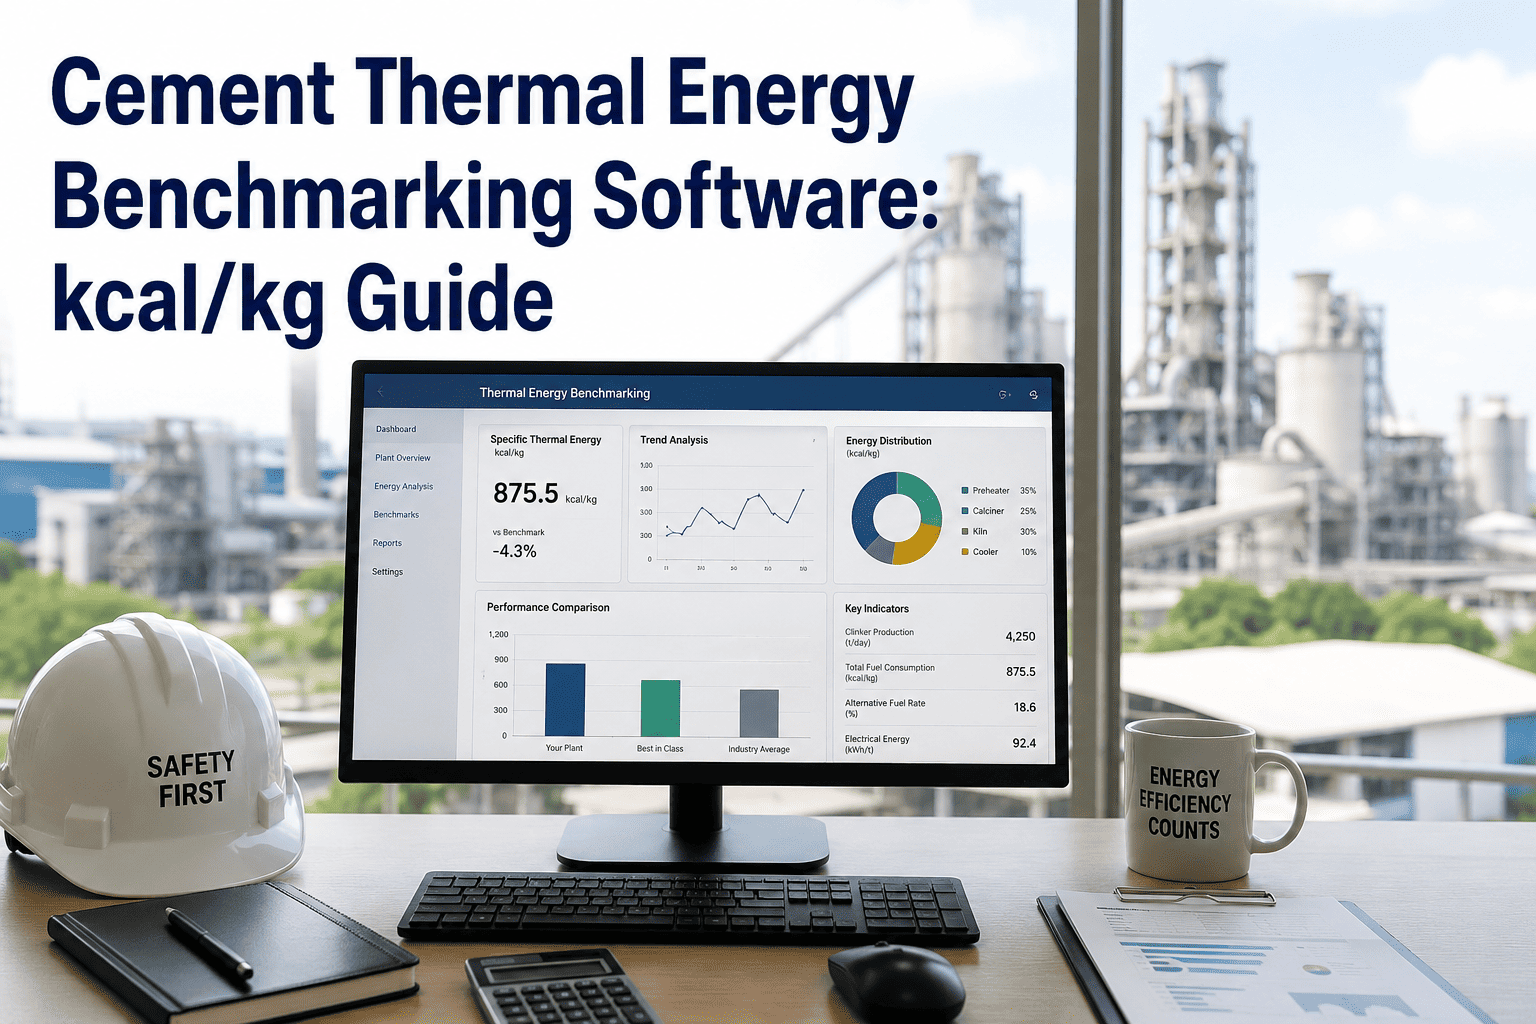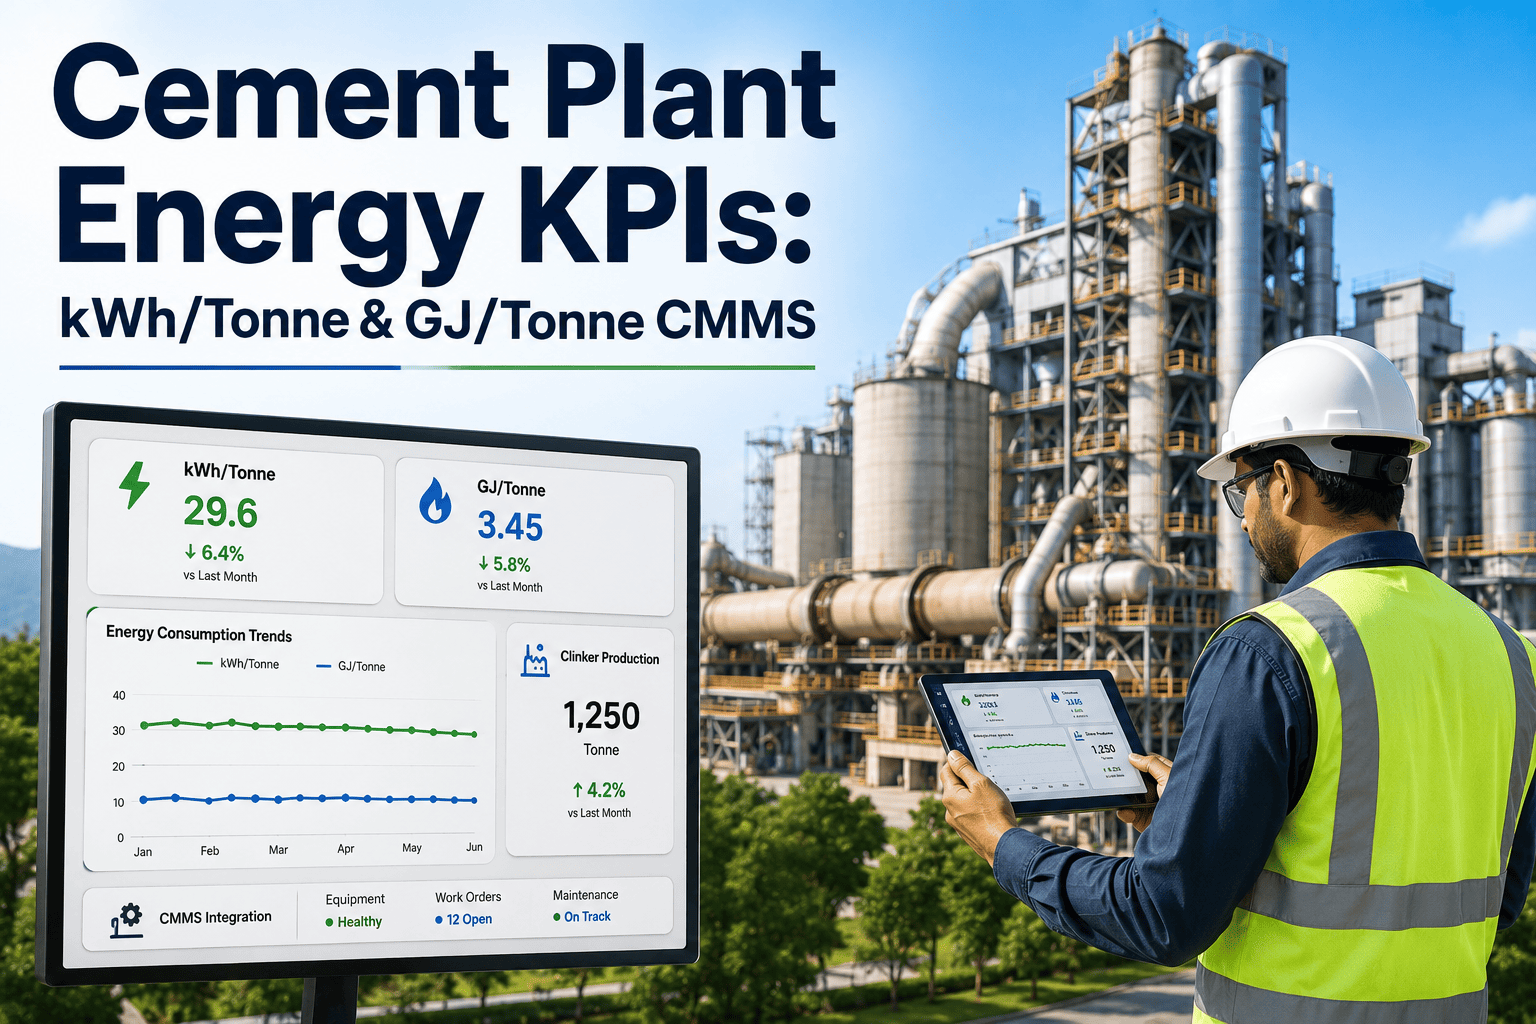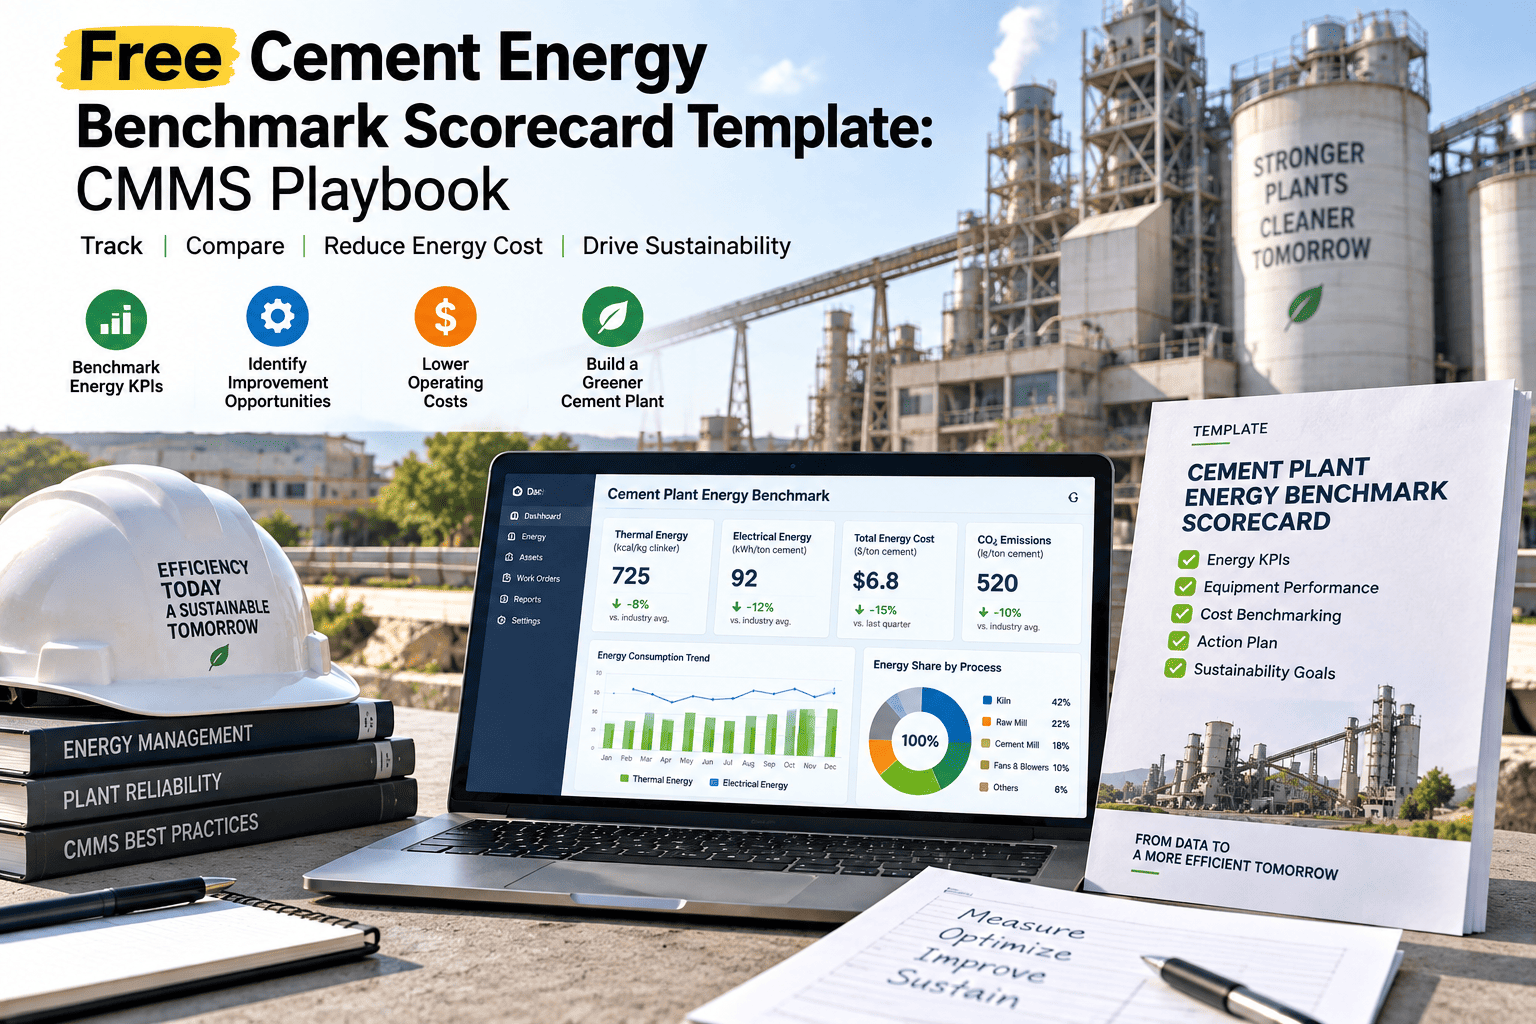
Ask five plant managers how their thermal energy consumption compares to industry best practice and you'll usually get five different numbers, pulled from five different reporting cycles, calculated five slightly different ways. A benchmark scorecard only works if the metrics are defined consistently and the data behind them is trustworthy — and in most plants, that data still lives in shift logs, spreadsheets, and someone's memory of what the last audit said. This playbook lays out a 20-metric scorecard covering thermal, electrical, and reliability performance, plus how a CMMS keeps it populated automatically instead of rebuilt by hand every quarter.
Where does your plant actually stand against industry benchmarks?
A 20-metric scorecard spanning thermal energy, electrical consumption, and reliability performance, built to be populated automatically from your CMMS instead of rebuilt by hand every reporting cycle.
Most scorecards break down at the data collection step, not the analysis step
Plants rarely struggle to interpret a benchmark once they have accurate numbers. The failure point is almost always upstream — inconsistent metric definitions, manual data entry, and reporting cycles that lag actual operations by weeks.
Twenty metrics, grouped by category
The full template groups metrics into four categories so a plant manager, an energy engineer, and a reliability lead can each own their section without duplicating data entry.
| Category | Metric | Typical Benchmark Range |
|---|---|---|
| Thermal Energy | Specific thermal energy consumption | 690-750 kcal/kg clinker (BAT) |
| Thermal substitution rate (TSR) | 18% global average, 46%+ EU average | |
| Preheater exit gas temperature | Plant and configuration specific | |
| Clinker cooler heat recovery efficiency | 68-75% typical | |
| Kiln shell heat loss | Trended against refractory condition | |
| Electrical Energy | Specific electrical energy consumption | 90-110 kWh/t cement |
| Raw mill specific power consumption | 14-18 kWh/t raw meal | |
| Cement mill specific power consumption | 28-38 kWh/t cement | |
| Compressed air specific power | Trended against idling loss data | |
| Power factor | Above 0.95 target | |
| Reliability | Overall equipment effectiveness (OEE) | 85%+ world-class target |
| Kiln availability | 90-95% typical target | |
| Mean time between failures (MTBF) | Trended per critical asset | |
| Mean time to repair (MTTR) | Trended per critical asset | |
| Planned maintenance percentage | 80%+ of total maintenance hours | |
| Compliance & Quality | Clinker factor | Trended against blended cement targets |
| Free lime variability | Trended within control limits | |
| Opacity / particulate compliance rate | 100% of permit conditions | |
| Safety incident rate (TRIR) | Trended against site targets | |
| Preventive maintenance compliance rate | 90%+ scheduled PM completion |
Stop rebuilding your benchmark scorecard from scratch every quarter
Connect your asset records and work order history to one dashboard that updates itself between reporting cycles.
How a CMMS keeps the scorecard populated without a spreadsheet rebuild
Define each metric once
Every metric gets a fixed calculation and data source, so the same number is produced the same way every reporting cycle, by anyone who runs it.
Pull from asset and work order records
Reliability metrics like MTBF, MTTR, and PM compliance are calculated directly from work order history instead of a manually tracked log.
Connect energy meters where available
Thermal and electrical metrics update from connected meters and process data instead of month-end manual entry.
Dashboard refreshes automatically
The scorecard updates continuously, so a quarterly review starts from current numbers instead of a week spent reconstructing last quarter's data.
A four-week rollout for your first scorecard
- Week 1: Confirm the calculation and data source for each of the 20 metrics with the relevant department owner
- Week 2: Register critical assets in the CMMS if not already tracked, so reliability metrics have a data source
- Week 3: Connect available energy meters and pull three months of historical data to establish a baseline
- Week 4: Publish the first scorecard, review it with plant leadership, and set the review cadence going forward
Cement energy benchmark scorecards, answered
What is a good specific thermal energy consumption for a cement plant?
Best-available-technology plants typically run 690-750 kcal/kg clinker, while older or less efficient kilns can run considerably higher. The right target depends heavily on kiln configuration and raw material characteristics.
How often should a benchmark scorecard be updated?
Monthly at minimum for a management review, though metrics that draw from connected meters and work order data can realistically update continuously rather than on a fixed cycle.
Can reliability metrics like MTBF and MTTR be calculated automatically?
Yes, when work orders are logged with accurate timestamps and failure codes, a CMMS can calculate both directly from the maintenance history. Start Free Trial to see it applied to your own asset data.
Is the free scorecard template specific to one plant type?
The template is built for integrated cement plants but the same category structure — thermal, electrical, reliability, compliance — applies to grinding-only and blending facilities with a reduced metric set.
What's the biggest mistake plants make when starting a benchmark program?
Comparing against an industry average without first confirming their own metric is calculated the same way, which often makes the comparison meaningless before the analysis even starts.
Build a scorecard that updates itself, not one you rebuild every quarter
Connect your asset and work order data to a live benchmark dashboard and see exactly where your plant stands. Free 14-day trial, no credit card required.
Free 14-day trial · No credit card