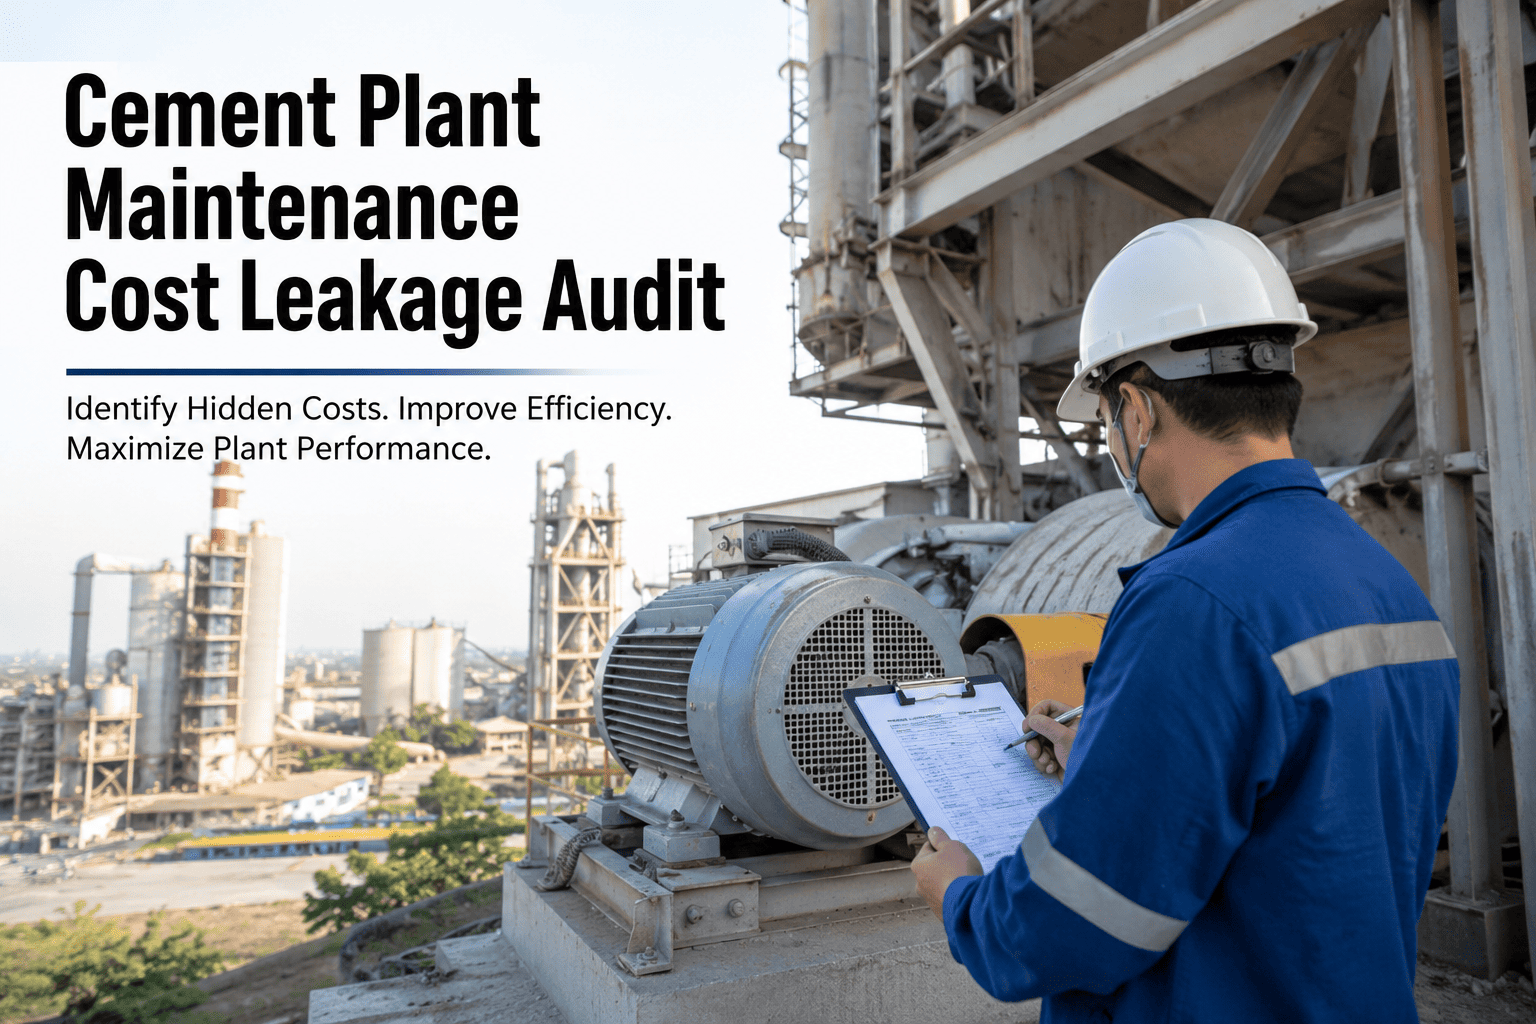
Every cement plant loses money it never sees on a single line item. It hides in emergency repairs billed at premium rates, technicians standing idle waiting for parts, duplicate spares bought because nobody checked the storeroom, and work orders that sit open for weeks while the asset keeps degrading. None of these show up as "maintenance cost" in a budget review — they show up as a vague sense that the maintenance spend never matches plant output. A structured leakage audit using OxMaint work order and inventory data turns that vague sense into a line-by-line number you can act on, and a quick walkthrough call shows how the audit runs against your own asset history.
The Cement Plant Maintenance Cost Leakage Audit
Most plants overspend on maintenance by 15 to 25 percent without a single budget line confirming it. This audit framework finds exactly where the money goes.
Four Leakage Zones Hiding in Every Maintenance Budget
Cost leakage rarely comes from one obvious source. It accumulates across four recurring patterns that every plant has but few plants measure individually. Isolating each one is the first step in recovering the spend.
Reactive repairs carry rushed labor, expedited freight, and overtime rates that a planned job never incurs. Plants that track PM compliance against breakdown frequency typically find emergency work costs three times more per job than scheduled equivalents.
Technicians waiting on parts, approvals, or access permits are paid hours with no output. Without time-stamped work order tracking, idle time blends invisibly into total labor cost and never gets flagged for correction.
When storeroom visibility is poor, purchasing teams reorder parts that already sit on a shelf elsewhere in the plant. This duplication quietly inflates inventory carrying cost and ties up working capital that should fund other priorities.
Open work orders that sit for weeks let minor defects progress toward major failures. The delay cost rarely appears as a number, but the eventual repair bill is consistently higher than if the job had closed on schedule.
An Audit Is Only Useful If the Data Behind It Is Real
OxMaint timestamps every work order, parts request, and technician action, which means a leakage audit pulls from actual plant history instead of estimates.
How a 30-Day Leakage Audit Runs Inside OxMaint
The audit does not require new hardware or a new process — it runs against work order, inventory, and labor data your team already generates inside OxMaint each week.
Typical Leakage Cost by Plant Size
| Plant Capacity | Annual Maintenance Spend | Typical Leakage Range | Recoverable Value |
|---|---|---|---|
| 1,000-2,000 TPD | $1.8M-$3.2M | 15-20% | $270K-$640K |
| 2,000-4,000 TPD | $3.5M-$6.8M | 18-23% | $630K-$1.5M |
| 4,000-6,000 TPD | $7M-$11M | 20-25% | $1.4M-$2.7M |
| 6,000+ TPD | $12M+ | 22-26% | $2.6M+ |
Maintenance Spend With and Without Leakage Visibility
Why Leakage Audits Fail Even When Plants Try
Most plants that attempt a cost leakage review get partial results because the audit stops short of the habits that actually drive the leakage. These are the most common gaps that quietly undermine the effort.
Finance teams often see the total maintenance overspend but never trace it back to which crew, asset, or shift generated it, so the same pattern repeats every quarter.
A single audit produces a snapshot, not a trend. Without a recurring review cadence, corrected leakage drifts back within two or three quarters as habits relax.
Leakage findings that sit in a report with no named owner rarely get fixed. Each leakage category needs a specific role accountable for closing it.
Turning Audit Findings Into Budget Recovery
Identifying leakage is only half the exercise. The recovery only materializes once findings convert into specific, owned corrective actions tracked against the next budget cycle.
Frequently Asked Questions
How long does a leakage audit take to complete?+
What is the fastest leakage source to fix once identified?+
Does leakage tracking require new sensors or hardware?+
How is idle technician time actually measured?+
Should the audit be a one-time exercise or ongoing?+
Find Out What Your Plant Is Actually Losing
Run the leakage audit against your own work order and inventory history inside OxMaint and see the recoverable number in real figures, not estimates.