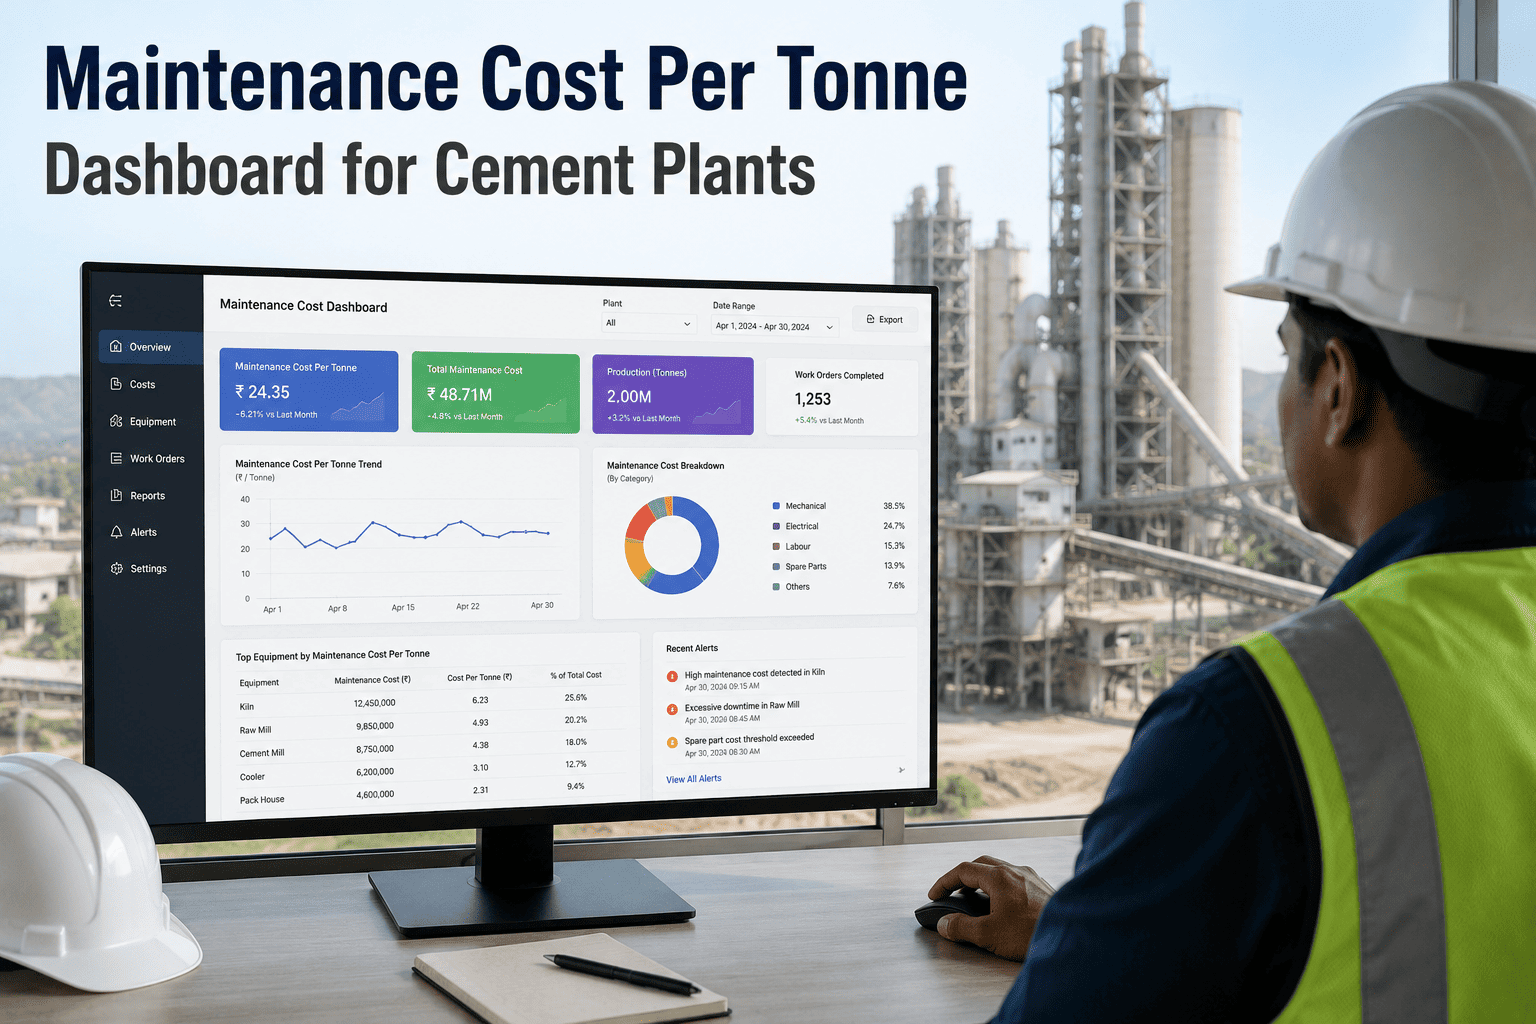
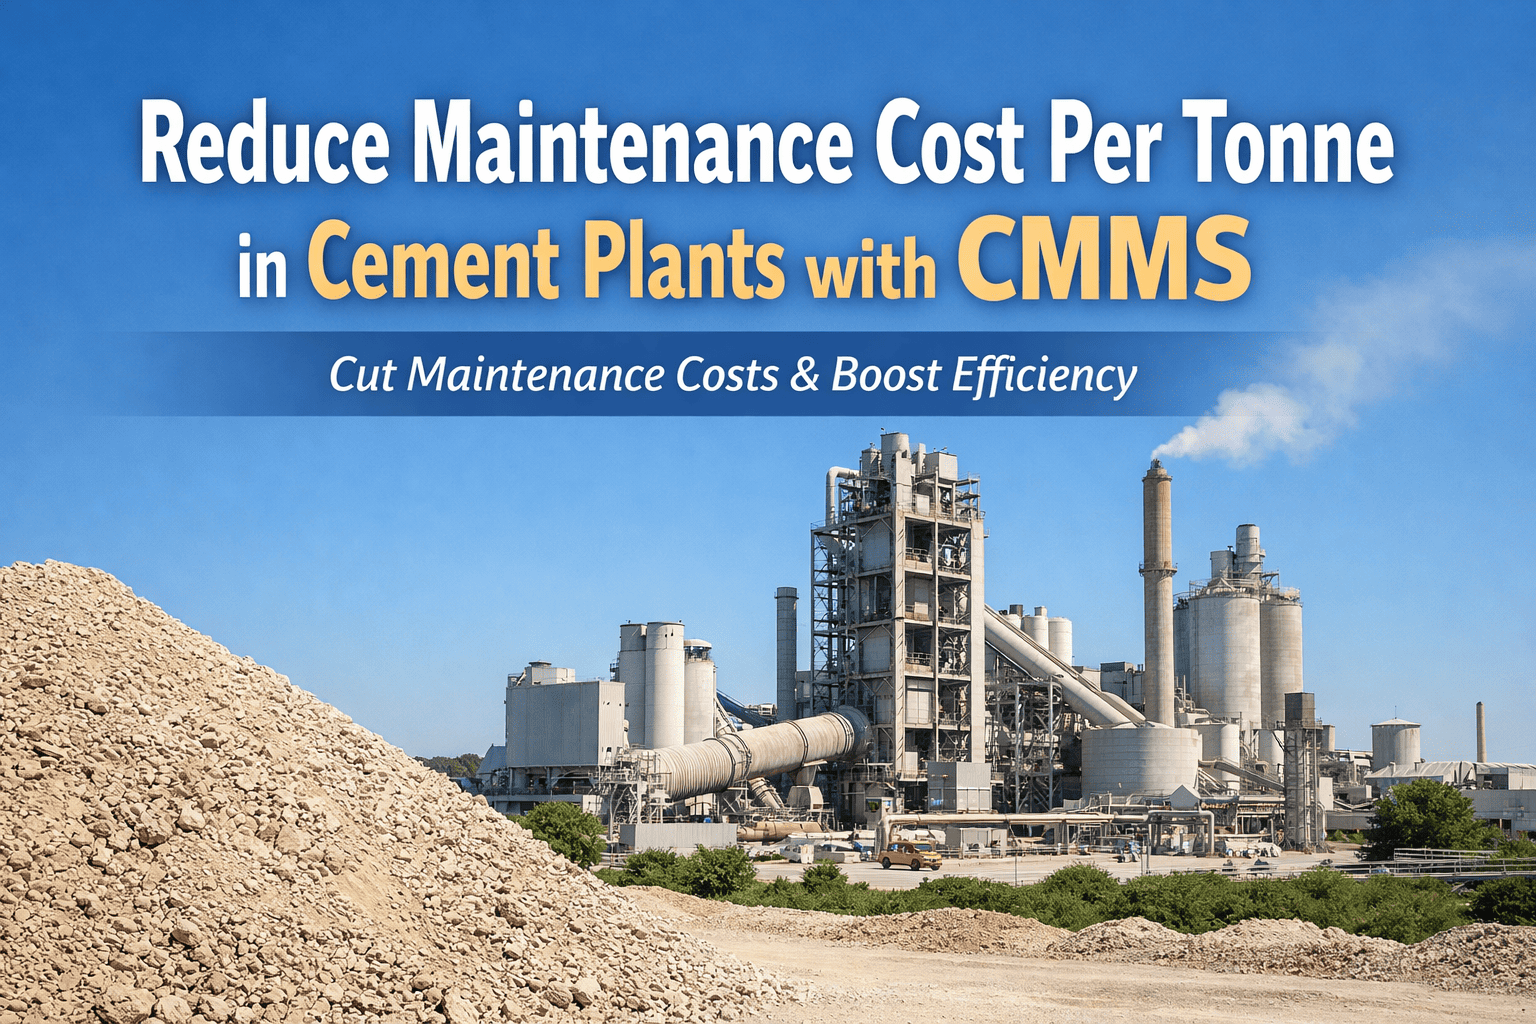
Maintenance cost per tonne is the single number that tells a cement plant manager whether their maintenance programme is an investment or a leak. When a 5,000 TPD plant spends $3.8 million on maintenance and produces 1.5 million tonnes annually, the cost per tonne is $2.53. The global benchmark for well-run plants sits between $1.80 and $2.40 per tonne, which means that same plant is leaving $195,000 to $1,095,000 on the table every year. Most plants cannot see this gap because their maintenance data lives in ERP cost centres, spreadsheet summaries, and planner notebooks that nobody cross-references against production output. OxMaint connects maintenance spending directly to tonnage output in a single dashboard that updates after every shift.
MAINTENANCE COST OPTIMIZATION · CEMENT PLANTS
Every Tonne You Produce Carries a Maintenance Price Tag. Do You Know What It Is?
A real-time dashboard that ties work order costs, spare parts consumption, contractor spend, and downtime losses to actual tonnage output so you see your true maintenance efficiency after every shift.
INDUSTRY BENCHMARKS
Where your cost per tonne should sit versus where most plants actually land
The cement industry has compiled maintenance cost data across hundreds of plants globally. The distribution below shows four performance zones. Plants in the top quartile consistently maintain below $2.00 per tonne by combining predictive maintenance, strict work order discipline, and real-time cost visibility. The bottom quartile exceeds $3.50 per tonne, often without realizing it, because their cost data is fragmented across systems that never talk to production output.
World-class performers
$1.40 - $1.80/t
Top quartile
$1.80 - $2.40/t
Industry median
$2.40 - $3.00/t
Bottom quartile
$3.00 - $4.50/t
Source: Aggregated from World Cement Association reliability surveys, PCA maintenance benchmarking studies, and independent cement plant audits (2019-2024). Ranges vary by plant age, fuel type, and clinker factor.
COST ANATOMY BY ASSET
Where your maintenance dollars actually go across the six biggest cost drivers
A cost per tonne number without asset-level breakdown is useless for decision-making. The visualization below shows the typical cost distribution across the six asset families that consume the largest share of maintenance budgets in a 5,000 TPD integrated cement plant. The percentages represent the share of total maintenance spend, not the cost per tonne contribution of each asset.
Crushers and Conveyors
8%
Packaging and Dispatch
7%
DASHBOARD DATA SOURCES
Six data streams that feed a trustworthy cost per tonne calculation
A dashboard is only as accurate as the data flowing into it. The OxMaint cost per tonne dashboard pulls from six integrated sources, each automated to eliminate manual data entry and the errors that come with it. When any one of these streams is missing or delayed, the cost per tonne number drifts and decisions get made on stale information.
01
Work Order Cost Capture
Every work order auto-accumulates labour hours at crew rates, parts issued from inventory, and contractor charges. No manual cost coding. The work order is the cost container.
02
Inventory Consumption Log
Parts are costed at actual issue price at the moment they are allocated to a work order, not at purchase price. This captures price variance and prevents outdated cost assumptions.
03
Production Tonnage Feed
Daily or shift-level clinker and cement tonnage is pulled from the production system or manual entry point. The denominator updates at the same cadence as the numerator for real-time accuracy.
04
Downtime and Lost Production
Unplanned maintenance stoppages are tagged to specific assets with duration and estimated lost tonnage. Contribution margin per tonne converts lost volume to a dollar figure.
05
Contractor Invoice Matching
External service invoices are matched to the work orders they support. Unmatched contractor spend is flagged as unallocated and investigated before it inflates the cost per tonne.
06
Overhead Allocation Engine
Maintenance supervision, workshop facilities, and tooling costs are allocated proportionally based on work order labour hours. This prevents overhead from being buried in plant-level accounts.
DASHBOARD METRICS
Seven KPIs the dashboard surfaces beyond the single cost per tonne number
Cost per tonne is the headline number, but without supporting metrics it cannot drive action. The dashboard displays seven interconnected KPIs that let the maintenance manager diagnose why the cost per tonne is where it is and which lever to pull to move it.
$2.47/t
Maintenance Cost Per Tonne
Total maintenance spend divided by total tonnes produced in the selected period. The master KPI.
$0.89/t
Spare Parts Per Tonne
Inventory issued against work orders divided by tonnage. The largest variable cost lever in most plants.
12.4%
Unplanned to Planned Ratio
Percentage of total maintenance cost spent on unplanned work. Target below 15% for cost-optimized plants.
$340K
Downtime Production Loss
Lost tonnes from unplanned stoppages multiplied by contribution margin. The hidden cost most plants underestimate.
87%
Work Order Completion Rate
Percentage of planned work orders completed within the scheduled window. Low completion drives reactive spending.
1.32
Maintenance Cost Ratio
Total maintenance cost as a percentage of total production cost. Industry benchmark is 10-18% for integrated plants.
-8.3%
Cost Per Tonne Trend
Period-over-period change in cost per tonne. Negative indicates improvement. Tracked monthly and rolling 12-month.
DECISION FRAMEWORK
What to do when the dashboard tells you the cost per tonne is too high
Seeing a high cost per tonne number is useless without a decision tree that routes you to the correct action. The framework below maps dashboard readings to specific interventions, ranked by the speed and magnitude of cost reduction each intervention typically delivers in cement plants.
Spare parts per tonne above $1.20
Inventory Optimization Sprint
Audit the top 20 parts by annual spend. Verify reorder points against actual consumption data. Eliminate emergency purchase premiums by improving PM compliance on high-consumption components. Typical saving: 15-25% of parts cost within 90 days.
Unplanned ratio above 20%
PM Programme Overhaul
Review the top 10 failure modes driving unplanned costs. Redefine PM frequencies using actual failure data from the CMMS. Add condition-based triggers where possible. Convert 30-40% of reactive work to planned work within two planning cycles.
Downtime loss above $250K/quarter
Criticality-Based Reliability Focus
Rank all assets by consequence of failure. Redirect maintenance hours and parts budget toward the top 15 critical assets. Implement predictive monitoring on the three assets driving the most downtime loss. Target 40% reduction in downtime cost within 6 months.
Contractor spend above 25% of total
Insourcing Assessment
Identify recurring contractor tasks that could be performed by trained in-house teams. Calculate the true cost comparison including travel, mobilization, and supervision overhead. Typical insourcing opportunity: 10-15% of contractor spend in the first year.
SEE YOUR TRUE MAINTENANCE COST PER TONNE
Stop guessing. Start measuring every maintenance dollar against every tonne produced.
OxMaint pulls work order costs, inventory consumption, contractor charges, and downtime losses into a single dashboard divided by your actual production tonnage. No manual spreadsheets. No delayed monthly reports. The number updates after every shift so you can act on it while the levers are still reachable.
MEASUREMENT PITFALLS
Five ways cement plants calculate cost per tonne wrong and what it costs them
ERROR 01
Excluding downtime production loss from the calculation
Most plants only count direct spending and ignore the tonnes not produced during breakdowns. On a 5,000 TPD kiln, a 14-hour unplanned stop costs $280,000 in lost contribution at $40/tonne margin. Ignoring this makes the cost per tonne look 10-18% lower than reality.
ERROR 02
Using purchase price instead of issue price for parts
Parts purchased at $450 three years ago and issued today at a replacement cost of $620 create a $170 cost gap per unit. When hundreds of such parts are issued annually, the underreporting easily exceeds $100,000 and the cost per tonne drifts downward artificially.
ERROR 03
Allocating contractor spend at plant level instead of work order level
A $180,000 annual kiln reline contract allocated equally across all assets spreads the cost thinly and hides the true maintenance intensity of the kiln. Cost per tonne by asset becomes meaningless when the biggest cost driver is averaged away.
ERROR 04
Calculating monthly but not tracking the rolling 12-month trend
Monthly cost per tonne spikes during shutdown months and drops during steady-state months, creating a sawtooth pattern that misleads decision-making. The rolling 12-month view smooths seasonality and reveals whether the underlying trend is improving or deteriorating.
ERROR 05
Not separating maintenance cost from capital project spend
A $2 million mill upgrade charged to the maintenance cost centre inflates the cost per tonne by $1.33 for that period and triggers a false alarm. Capital improvements must be excluded from the maintenance cost per tonne calculation entirely.
COST OPTIMIZATION QUESTIONS
What cement plant managers ask before building their first cost per tonne dashboard
How do you calculate maintenance cost per tonne for a cement plant?
Add four cost streams: direct maintenance labour, spare parts and materials issued to work orders, contractor and specialist service charges, and downtime production loss calculated as lost tonnes multiplied by contribution margin. Divide the total by the actual tonnes of cement or clinker produced in the same period.
Start a free trial to build this calculation inside your CMMS with automated data feeds.
What is a good maintenance cost per tonne benchmark for cement plants?
World-class performers achieve $1.40 to $1.80 per tonne, top quartile plants sit between $1.80 and $2.40, the industry median is $2.40 to $3.00, and bottom quartile plants exceed $3.00 per tonne. Your target depends on plant age, fuel type, clinker factor, and local labour costs, but any plant above $3.00 has clear improvement opportunities.
Book a demo to see how OxMaint benchmarks your plant against these ranges.
How often should the cost per tonne dashboard be updated?
The dashboard should update at shift level for operational decision-making and calculate a rolling 12-month view for strategic trend analysis. Monthly snapshots alone are insufficient because they mask shutdown-driven spikes and make it impossible to see whether a cost reduction initiative is working within the first 60 to 90 days of implementation.
Why do most cement plants get their cost per tonne calculation wrong?
The most common errors are excluding downtime production loss, using purchase price instead of issue price for spare parts, allocating contractor spend at plant level instead of work order level, mixing capital project costs with maintenance costs, and relying on monthly calculations without a rolling trend. Each error can understate the true cost per tonne by 10 to 25 percent.
Sign up now to automate accurate cost capture from day one.
How does cost per tonne by asset help prioritize maintenance spending?
When you break the total cost per tonne down by asset family, you immediately see which equipment is consuming the largest share of your maintenance budget relative to its production contribution. The kiln system typically drives 35-45% of total maintenance cost, which justifies the largest share of reliability investment, predictive monitoring, and planning attention.
Book a demo to see asset-level cost breakdowns on a cement plant hierarchy.
MAINTENANCE COST VISIBILITY FOR CEMENT
Your cost per tonne is the most important number you are not tracking accurately.
OxMaint builds the cost per tonne dashboard from the ground up using work order costs, inventory issues, contractor charges, and downtime losses that are already captured in your daily maintenance workflow. No separate spreadsheet. No manual monthly compilation. Just a clear, accurate number after every shift that tells you exactly where you stand.