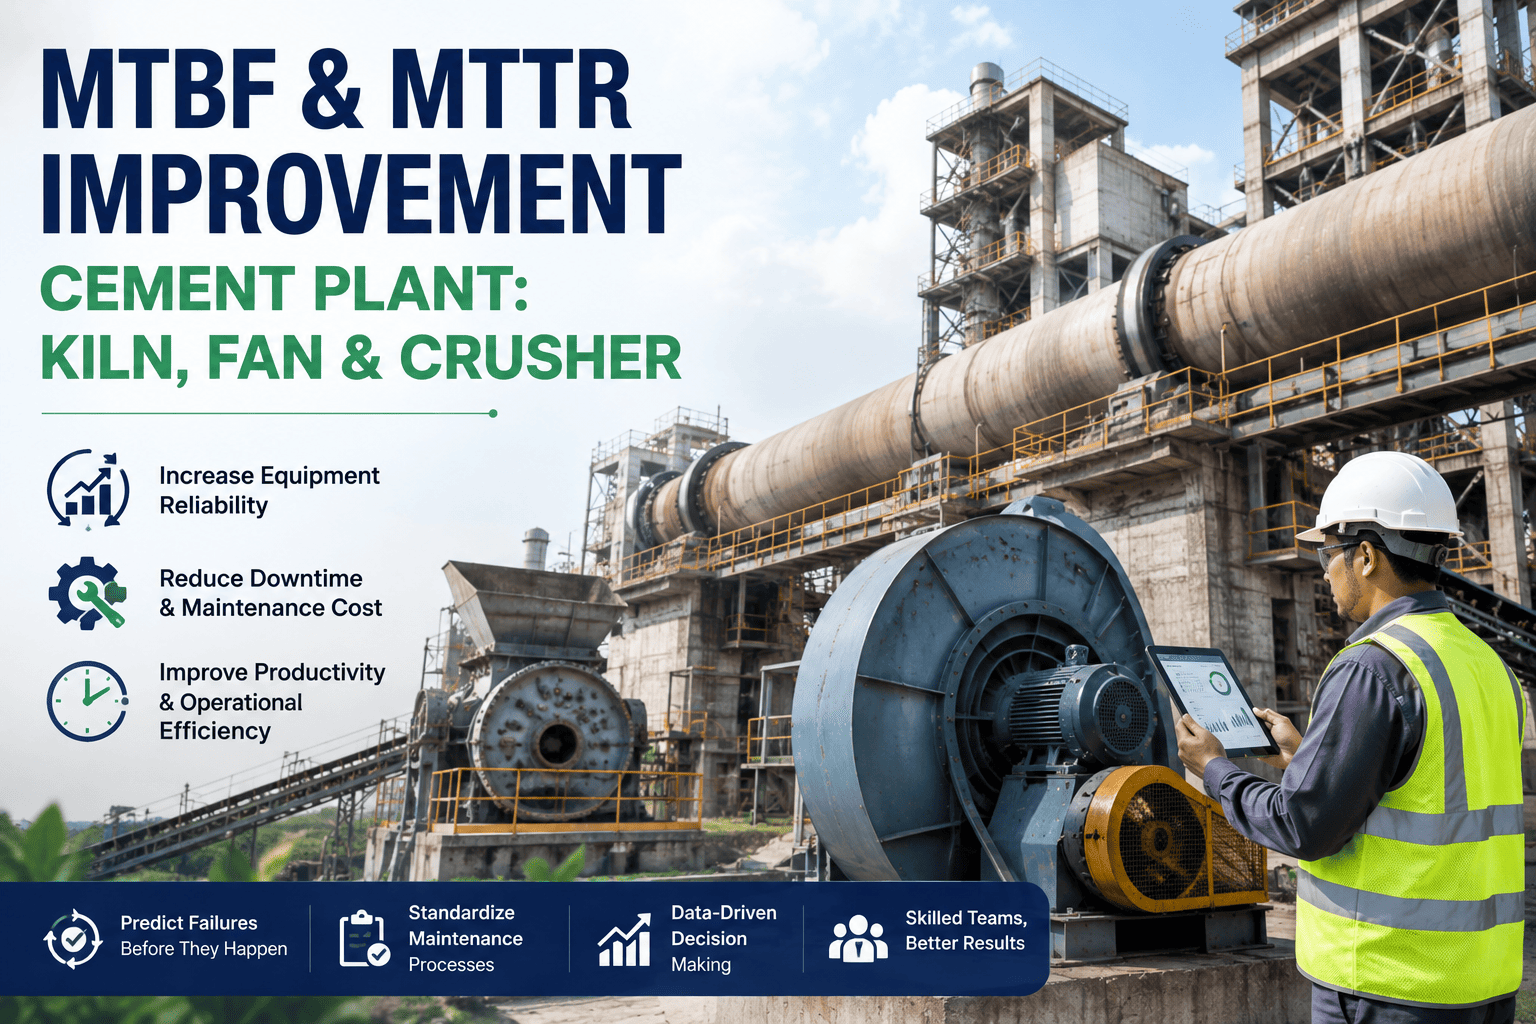
Overall Equipment Effectiveness is the single most honest number in a cement plant because it refuses to let availability hide behind throughput or quality hide behind uptime. A typical dry-process kiln runs at 65–75% OEE against a world-class benchmark of 85%, and each lost point on a 5,000 TPD line equals roughly 50 tonnes of missed clinker per day. Closing that gap is not about working harder; it is about structuring availability, performance and quality losses into a CMMS-driven weekly rhythm that flags root causes before they become unplanned outages. This guide walks through the OEE improvement roadmap for cement plants — kiln availability drivers, grinding performance losses, and the CMMS reporting cadence that lifts both measurably. Ready to put the program to work? Start Free Trial and configure your first OEE dashboard in under an hour.
Is your kiln leaking 12 points of OEE every single week?
Most cement plants measure availability and stop there — but a kiln at 88% availability, 78% performance and 97% quality is still losing one full production day every nine days. OEE forces those losses into the open, and a CMMS-driven weekly report turns them into a fixable backlog.
a typical cement plant
and the 85% world-class line
The three numbers that decide whether your plant makes budget
OEE multiplies three independent loss categories. Each one is owned by a different team, measured by a different sensor, and fixed by a different work order type — which is why a CMMS that ties them together is the difference between improvement theatre and real clinker tonnes.
Kiln / mill unplanned downtime, planned shutdowns, changeovers, and missing-feed events. Typical cement range: 78–88%.
Slow grinding, kiln derates, bottlenecks, minor stops under 5 min. Typical cement range: 75–88%.
Off-spec clinker, cement fails, regrind, customer returns. Typical cement range: 95–99%.
Where the 12 points actually leak out of your week
Across cement industry benchmarking, six loss categories account for over 90% of unplanned kiln and mill downtime. Naming them inside the CMMS — with the right failure code on every work order — is the prerequisite to trending them week over week.
Brick & castable wear
Unscheduled kiln stops for brick fallout average 18–36 hours per event and recur every 6–10 months when coating stability is poor. Thermal scanning tied to CMMS condition triggers cuts unplanned refractory outages by 30–40%.
Tyre, roller & girth gear
Kiln tyre creep, roller skew and girth-gear pitting produce the longest single mechanical events in cement. Oil sample + vibration trending in the CMMS lets you move repairs into planned windows instead of crash stops.
Coating ring & build-up
Preheater cyclone blockages and kiln inlet rings cause repeated short stops of 2–6 hours. Logging each event against the same asset tree turns a recurring nuisance into a trending failure pattern the CMMS can escalate.
Drive & motor trips
Mill main-drive and fan VFD trips are the most frequent — if rarely the longest — availability events. The CMMS should auto-create a work order from every PLC trip code so the root cause is captured while the operator still remembers it.
Cooler, fan & conveyor
Clinker cooler grates, ID fans and pan conveyors fail more often than the kiln itself but cascade into kiln stops when downstream capacity disappears. Reliability-centred maintenance on auxiliaries typically recovers 2–3 availability points.
Feed & fuel variation
Raw mix chemistry swings and alternative-fuel moisture variability force operators to derate the kiln, blurring the line between availability and performance. Tagging each stop with the material batch isolates the supplier or stockpile cause.
The hidden tax: a mill running at 78% performance still looks "running"
Performance loss is the most under-reported OEE factor in cement because a mill or kiln that is "on" but derated still shows green on a SCADA overview. Capturing minor stops and slow-rate events in the CMMS — automatically from the DCS historian — is what exposes the 8–15 points most plants are quietly forfeiting.
Stops under 5 minutes — feeder jams, screen blinding, air-slide blockages — rarely get a work order. Auto-logging them from the DCS typically adds 3–4 performance points in the first quarter.
A mill running at 320 TPH against a 380 TPH ideal still "looks fine". Ideal rate must be the demonstrated best sustainable rate, not the OEM nameplate, or performance will always look healthier than it is.
When the silo is full or the packing line is down, the mill is deliberately slowed. This is a scheduling loss, not a machine loss — and it belongs in a separate OEE1 vs OEE2 split so the team doesn't blame the grinder.
From "we think we're at 78%" to a weekly OEE report the GM trusts
An OEE program fails when it lives in a spreadsheet that nobody opens. The timeline below is the cadence we use to move a cement plant from manual data collection to a CMMS-published weekly OEE dashboard in roughly 90 days — with the first measurable availability lift usually visible by week six.
Asset hierarchy & ideal-rate baseline
Map every kiln, mill, fan and conveyor into the CMMS asset tree. Define the ideal (best-sustainable) rate for each major asset from the last 12 months of DCS data — not the OEM brochure. This single step usually exposes a 5–8 point overstatement in current performance reporting.
Failure-code & loss-reason library
Standardise a 2-level failure code (mechanism / cause) across pyro, grinding and packing. Tie every unplanned stop and minor-stop reason code in the DCS to a CMMS work-order template, so downtime reasons stop being free-text and start being trendable.
DCS integration & auto-capture
Connect the CMMS to the DCS historian so run/stop transitions, rate-derate events and trip codes auto-generate work orders with the correct asset, timestamp and failure code. Manual entry drops by ~80% and data quality rises sharply — this is usually the week the weekly OEE number first moves.
Weekly OEE review & loss-attack backlog
Stand up a 30-minute weekly review where the top 5 loss events from the prior week each become a CMMS-improvement work order with an owner and due date. Plants that hold this meeting religiously see 2–3 availability points in the first quarter.
OEE target setting & operator scorecards
Set a credible 90-day OEE target per line (typically +3 to +5 points), publish shift-level scorecards, and lock the weekly report into the plant manager's KPI pack. This is where OEE stops being a project and becomes the way the plant is run.
A 180-asset plant: 12 months of CMMS-driven OEE
A 2.8 MTPA integrated cement plant with two kilns, three cement mills and a coal mill was reporting 71% OEE manually — and suspected the real number was lower. After a 12-week CMMS rollout and a year of weekly loss-attack reviews, the picture looked very different.
| Metric | Before (manual) | After (CMMS-driven) | Delta |
|---|---|---|---|
| Kiln availability | 79% | 87% | +8 pts |
| Mill performance rate | 76% | 88% | +12 pts |
| Quality (good tonnes) | 96.2% | 98.4% | +2.2 pts |
| Plant OEE | 57.8% | 75.6% | +17.8 pts |
| Unplanned downtime / month | 186 hrs | 74 hrs | −60% |
| Work orders closed / month | ~210 | ~540 | +157% |
| Added clinker / year | — | ~147,000 t | +$4.0M |
"The breakthrough wasn't a new sensor — it was finally naming the same six losses on every work order, every week, until the weekly OEE number became something the GM actually trusted."
— Reliability Lead, 2.8 MTPA integrated cement plantThe one report that makes OEE impossible to ignore
A weekly OEE report only changes behaviour if it lands in the right inbox, names the top losses in plain language, and turns each one into a work order with an owner. Here is the minimum viable structure we recommend inside the CMMS.
Headline OEE per line
Kiln 1, kiln 2, raw mill, cement mill 1–3, coal mill — each with availability, performance, quality and the resulting OEE, plus a 4-week sparkline trend. No averages across lines; blended numbers hide the worst performer.
Top 5 loss events
Ranked by OEE-impact minutes, not by frequency. A single 14-hour kiln stop usually outweighs thirty 20-minute mill trips, and the report should make that ranking obvious so the team attacks the right loss first.
Loss category trend
Refractory, mechanical, process, electrical, auxiliary, materials — rolled up by category and trended week over week so the reliability lead can see whether the mechanical pile is growing or shrinking.
Open improvement WOs
Every top-5 loss from the prior week must have an open CMMS work order with an owner and due date shown on the report. If a loss has no work order, it is flagged red — that single rule is what drives follow-through.
OEE target vs actual
Each line shows the 90-day OEE target and the gap to actual. A line at 76% against a 78% target is a very different conversation from a line at 76% against an 85% target — context turns the number into a decision.
Auto-distribution
The CMMS publishes the report to the plant manager, reliability lead, process team and shift leads every Monday at 07:00 — no human has to remember to send it. Consistency of delivery is what builds trust in the number.
Stop estimating OEE. Start publishing it.
Configure your kiln, mill and auxiliary asset tree, connect your DCS, and publish a weekly OEE report your plant manager will actually open — all in the first 30 days.
Five questions every cement reliability lead asks first
What is a realistic OEE target for a cement plant?
A world-class cement line targets 85% OEE, but most integrated plants sit between 60% and 75%. A credible 12-month target after a CMMS-driven program is a 5–8 point lift — for example, moving from 68% to 75% — with most of the gain coming from availability (unplanned downtime reduction) before performance and quality move.
Should OEE be measured on the kiln, the mill, or the whole plant?
All three, but never blended into one number. Measure OEE per constraint asset — each kiln, each major mill — and report them side by side. A plant-wide average hides a struggling line behind a strong one, which is why our weekly template reports OEE per line and never rolls it up into a single figure on the front page.
How does a CMMS actually improve OEE in cement?
A CMMS improves OEE by capturing every stop with the right asset and failure code, trending the loss categories, and turning the top weekly losses into tracked work orders with owners. The measurement itself doesn't lift OEE — the disciplined weekly follow-through on named losses does. You can see this in action when you Book a Demo and we walk through a live cement OEE dashboard.
What is the difference between OEE1 and OEE2 in a cement plant?
OEE1 measures the asset against its own ideal rate and total calendar time — the pure machine number. OEE2 nets out scheduling losses like full silos, missing orders or fuel supply gaps. Cement plants need both: OEE1 tells you how the equipment is run, OEE2 tells you how well the plant is scheduled. Reporting only OEE2 flatters the equipment; reporting only OEE1 blames the machine for scheduling problems.
How long does it take to see measurable OEE improvement?
Plants that complete the 12-week setup and hold a weekly loss-attack review typically see the first 1–2 availability points by week six, and a 3–5 point OEE lift within the first quarter. The faster gains come from finally naming the recurring short stops that were always happening but never logged — the slower, bigger gains come from refractory and mechanical reliability projects that take 6–18 months to mature.
Lift kiln and mill OEE by measurable points this quarter
Join the cement plants that stopped estimating OEE and started publishing it — with a CMMS that names every loss, owns every fix, and ships the report every Monday at 07:00.
Free 14-day trial · No credit card