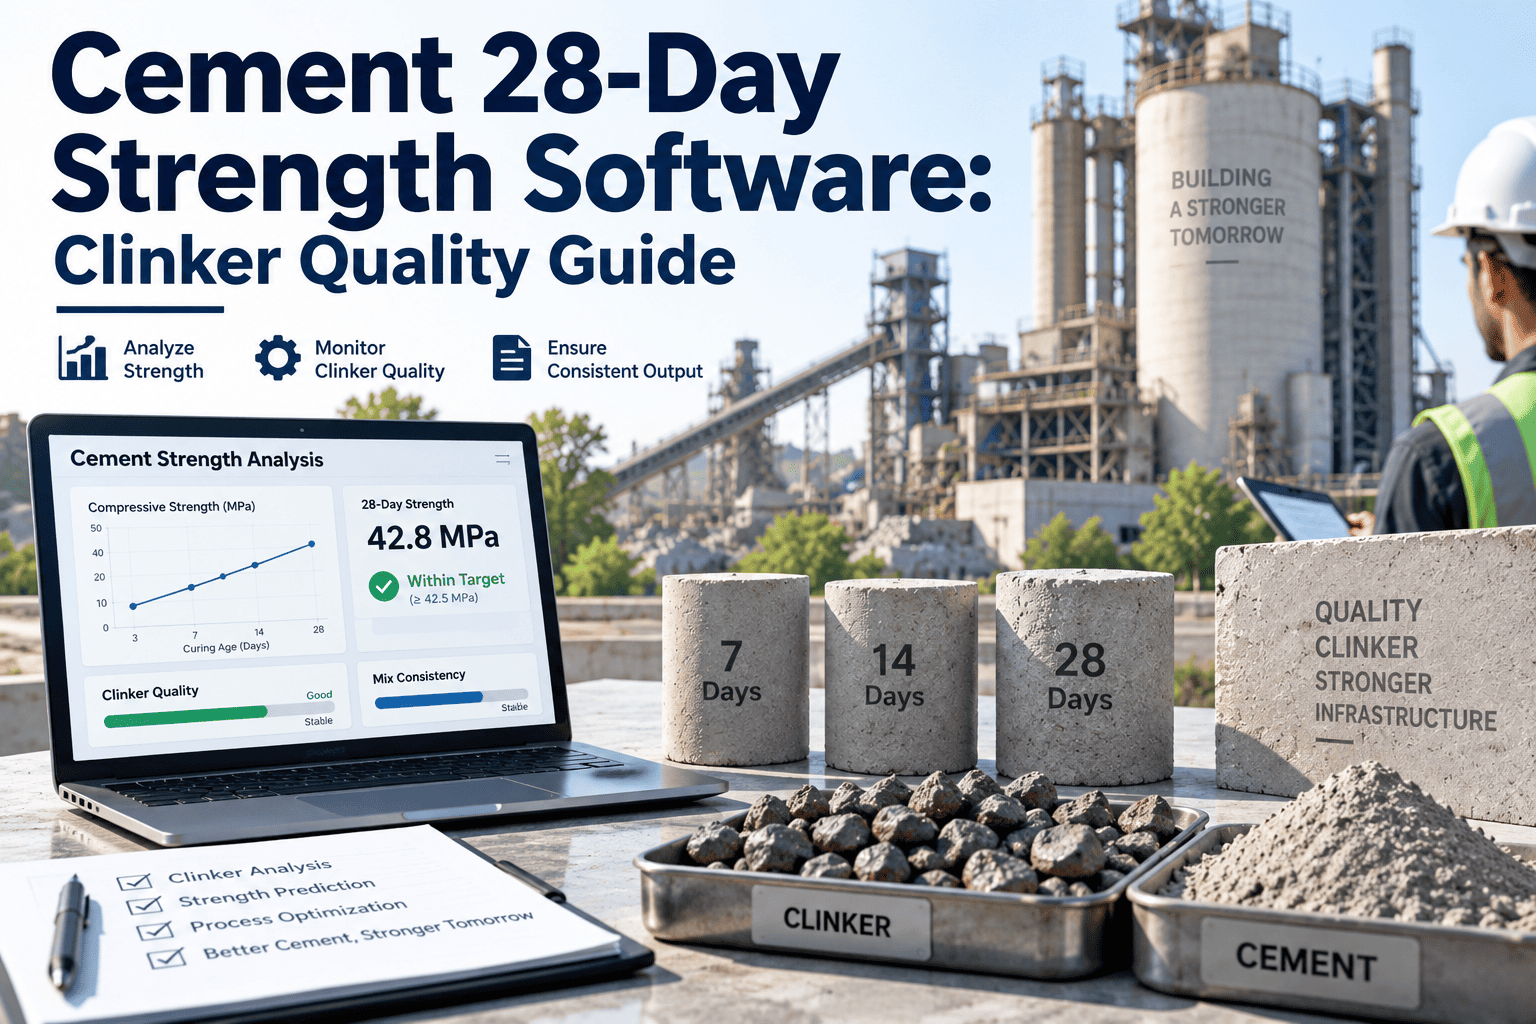
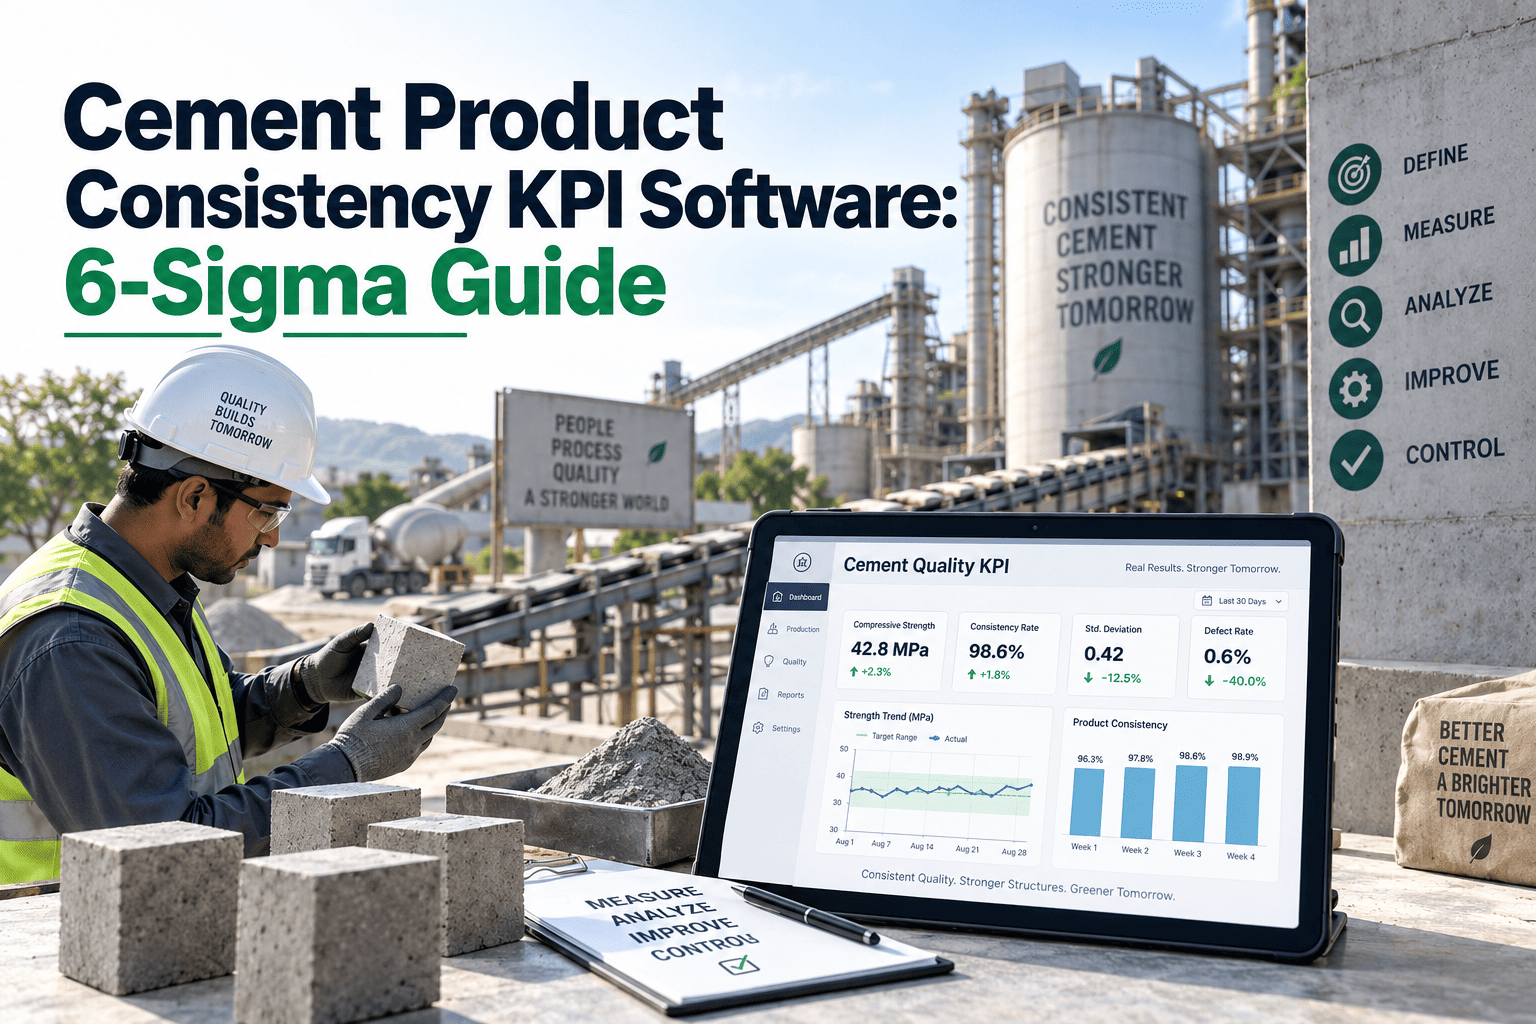
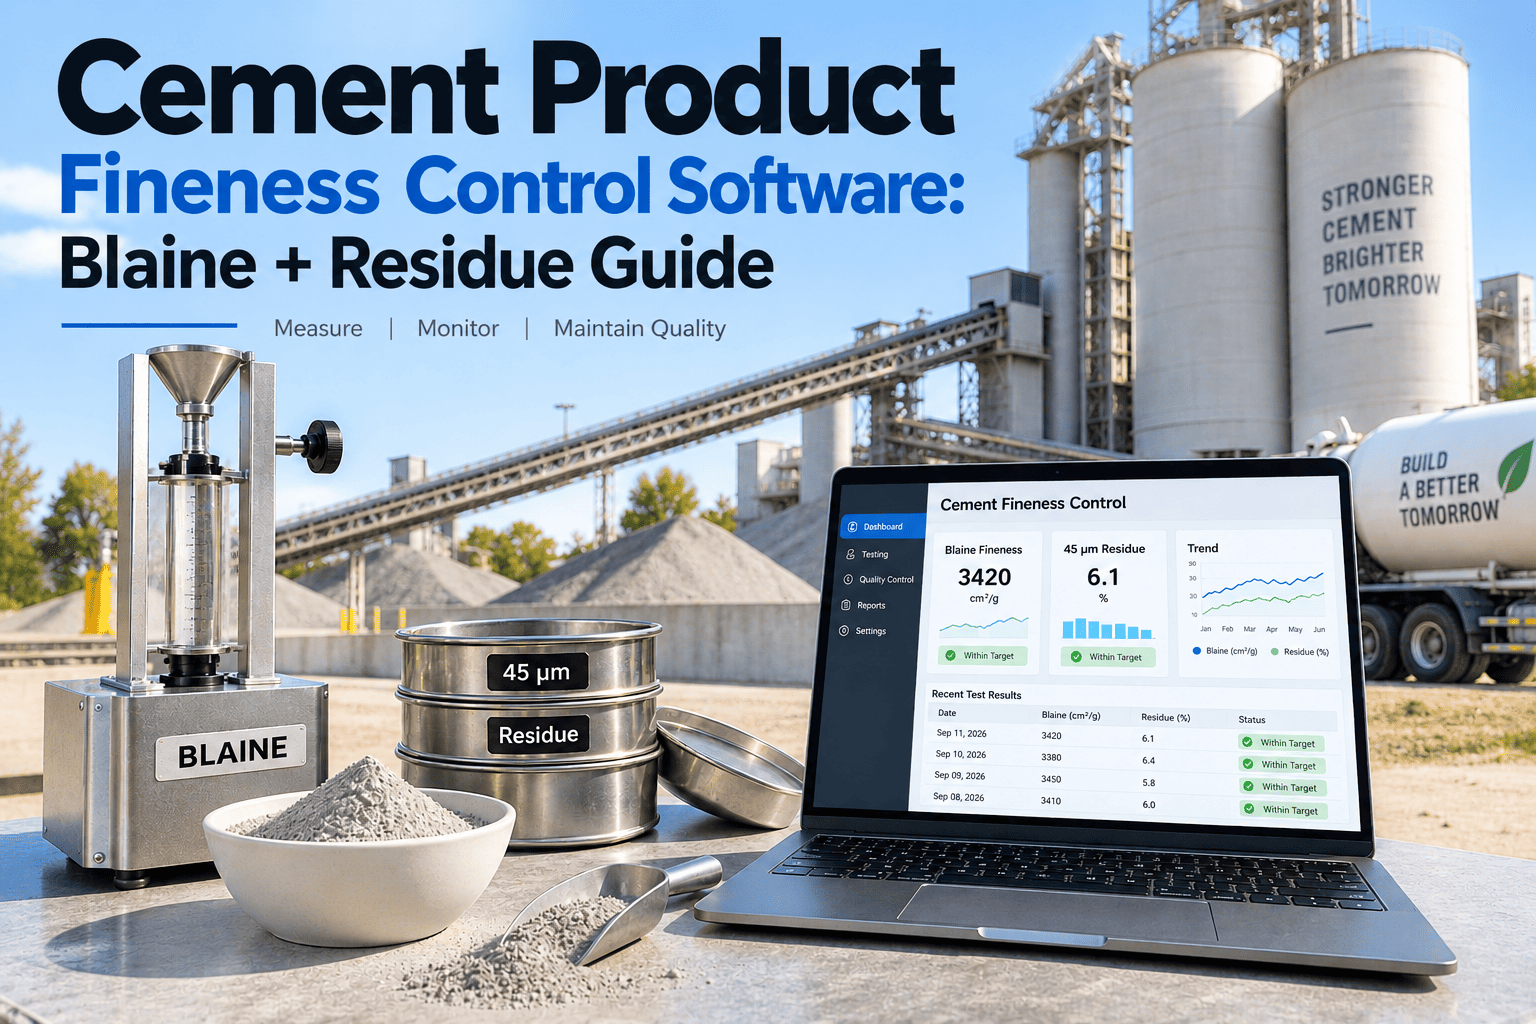
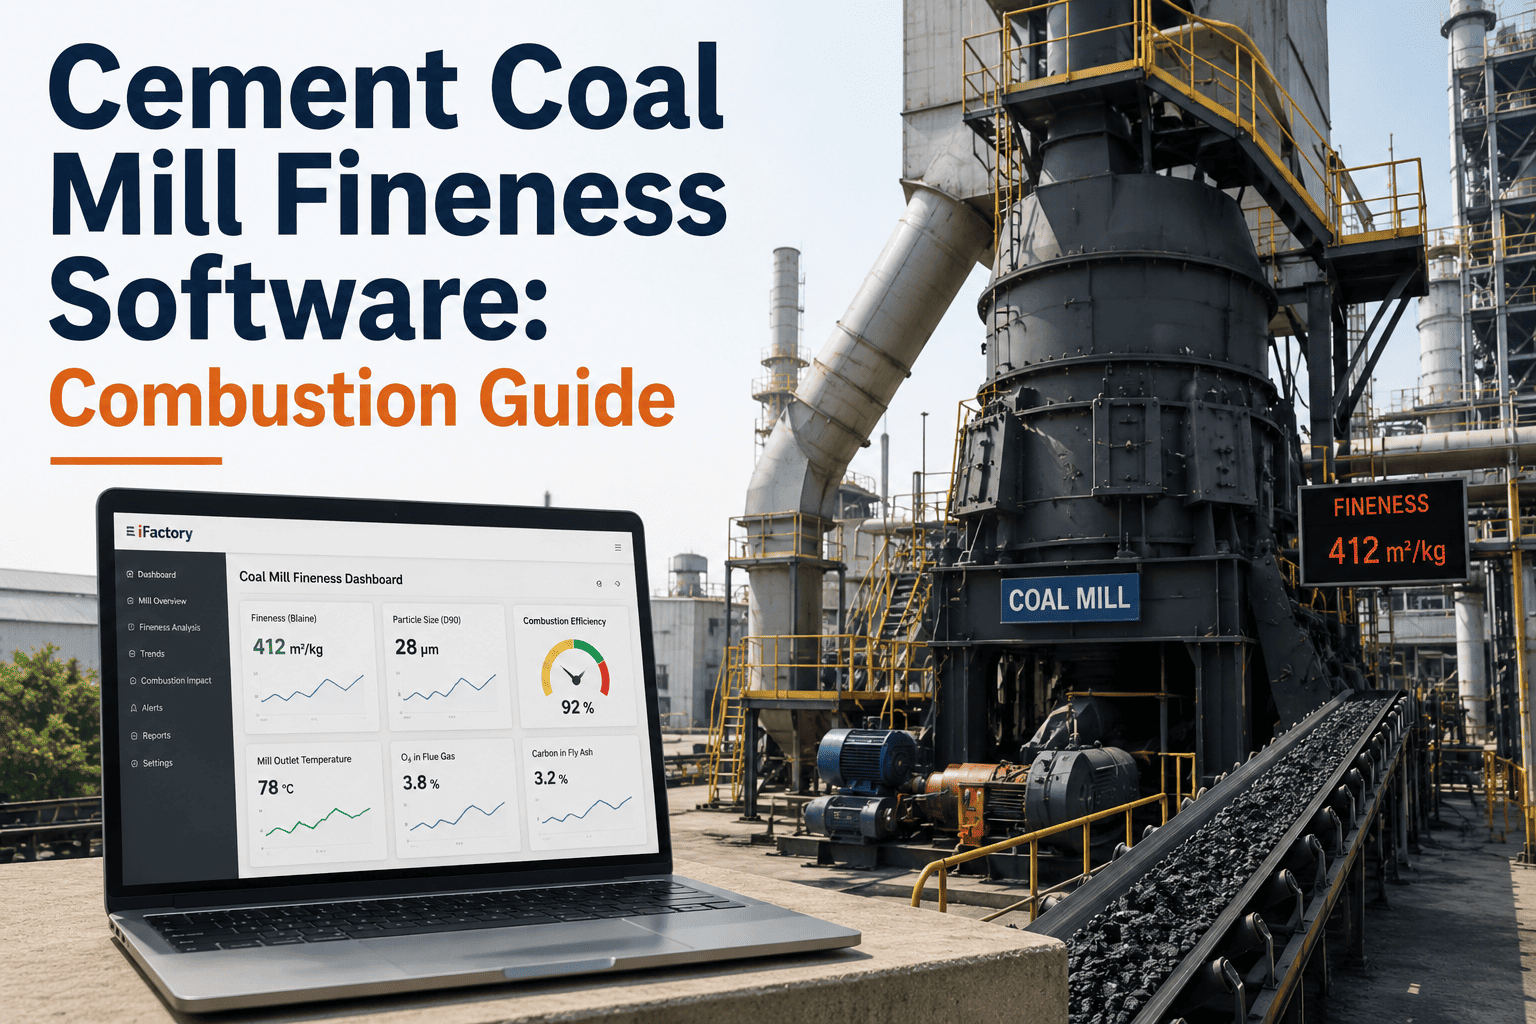
Cement plants that ship on spec batch after batch don't get there by accident — they get there by tracking three quality signals that most operations still treat as separate lab results instead of one connected system. Blaine fineness variance, 28-day strength drift, and setting time consistency are the numbers that quietly decide whether a customer reorders or quietly switches suppliers after one bad load. Ready-mix and precast buyers now ask for consistency data before they ask for price, because cement that swings between batches forces them to over-design every mix just to stay safe. Plants that can show tight, documented variance windows turn quality control from a compliance checkbox into a sales argument that closes deals. This guide breaks down what each signal measures, what equipment condition drives it out of range, and how connecting lab results to maintenance history closes the gap between a bad reading and a fixed root cause. Start a free trial to see how OxMaint tracks all three signals against your equipment records in a single dashboard.
Cement Quality Consistency Software · Fineness · Strength · Setting Time
Cement Quality Consistency Software: A Fineness, Strength, and Setting Time Guide for Plants That Sell on Consistency
Batch-to-batch Blaine variance, 28-day strength drift, and setting time consistency are the three signals your customers are quietly scoring you on. See what drives each one out of range, what a tight consistency window is worth at the loading dock, and how a connected CMMS turns a lab flag into a closed work order before the next batch ships.
15%
Typical reduction in Blaine fineness standard deviation once real-time monitoring is tied to equipment condition
$340K
Documented cost of one customer-credit and enhanced-surveillance event triggered by undetected quality drift
40-80 min
Lead time between a particle size drift signal and a measurable strength or fineness excursion
60-80%
Off-spec production avoided when drift is caught at the first signal instead of the next spreadsheet review
The Three Signals
The Three Quality Signals That Define Cement Consistency
Every cement quality conversation with a customer eventually comes down to three numbers. Each one is measured differently, drifts for a different reason, and is masked by a different piece of worn or miscalibrated equipment — which is exactly why treating them as three disconnected lab tests instead of one system is where most consistency programs break down. A plant that only watches the number in isolation, without asking what equipment condition is behind it, ends up chasing the same drift every few weeks instead of fixing the root cause once.
Signal 01
Blaine Fineness Variance
Blaine air-permeability testing measures specific surface area in cm²/g — the single most influential parameter in grinding, since it drives strength development, water demand, and setting behavior all at once. Most plants control it reactively: an operator adjusts separator speed 45–90 minutes after a lab result, then waits a full cycle to see if the correction held. Grinding to a conservative target well above spec minimum avoids rejects, but it quietly burns extra electrical energy every single shift.
Hidden driver: worn mill liners shift particle size distribution even when the Blaine reading still looks stable
Signal 02
28-Day Strength Drift
Compressive strength at 28 days is the number your customer's spec sheet cares about most, but the result arrives long after the batch has already shipped. Free lime is the earliest warning — above 1.5% signals under-burning, while a reading consistently below 0.5% signals over-burning and wasted kiln fuel. Early-age strength correlations at one and three days help predict where a batch will land at 28 days, giving quality teams a head start instead of a surprise.
Target margin: 3–5 MPa above grade minimum — below 2 MPa risks customer failures, above 8 MPa wastes fuel and grinding energy
Signal 03
Setting Time Consistency
Setting time governs how fast a batch can be handled downstream — ready-mix trucks, precast forms, jobsite pour schedules. A drifting gypsum feeder causes sulfate excursions that shift setting time even when Blaine and strength both hold within range. Raw mix moisture swings compound the problem, since wetter feed changes hydration timing independently of the gypsum dosing itself.
Customer impact: inconsistent setting time forces admixture dosing changes batch by batch, the exact friction that drives buyers to another supplier
Signal Reference
What Each Signal Is Tested With, What Drifts It, and What Equipment Owns It
Quality results and maintenance records are usually kept in separate systems, which is exactly why the equipment causing a drift often goes unfixed for weeks. The table below maps each signal to the process test that produces it, the most common root cause of drift, and the equipment record that should be checked first — the same reference a quality manager and a maintenance planner should both be looking at during a drift investigation.
The Cost of Drift
What Inconsistent Cement Actually Costs You at the Loading Dock
Batch-to-batch variance rarely shows up as a single dramatic failure. It shows up as a slow accumulation of small costs that eventually surface as a lost account or a failed audit — long after the underlying equipment issue could have been caught cheaply. By the time a customer files a formal complaint, the pattern usually stretches back weeks, hidden inside lab data nobody cross-referenced against maintenance records.
The Over-Design Tax
Customers who see inconsistent batches respond by padding their own mix designs with extra cement or a lower water-cement ratio to protect against your variance — and they price that buffer into the next contract negotiation against you.
Credits and Rejected Loads
One documented quality drift event has cost plants six figures in customer credits, plus a multi-month enhanced surveillance order from the certifying body — the kind of scrutiny that follows a plant into every future audit.
Certification and Audit Risk
Certification bodies and franchise quality programs look for a documented pattern of drift, not a single bad batch. A plant that cannot show equipment-linked corrective action for prior excursions faces longer audits and tighter surveillance cycles.
Lost Repeat Orders
Ready-mix and precast buyers standardize their supplier list around whoever's batch data is the most boring and predictable. Consistency, not just meeting spec on average, is what keeps a plant on that short list.
Cement Quality Consistency · OxMaint
Turn Your Batch Data Into a Sales Argument Instead of a Compliance File
OxMaint links every Blaine, strength, and setting time result to the equipment that produced it, so a drift signal turns into a work order before it turns into a rejected batch. See what your consistency window looks like once lab data and maintenance history sit in one place.
How It Works
How OxMaint Connects Lab Results to the Equipment Behind Them
Consistency isn't a lab problem — it's a maintenance problem wearing a lab coat. Here is how OxMaint closes the loop between a quality reading and the equipment record that explains it, so the same drift doesn't reappear next quarter under a different batch number.
01
Every Result Logged Against Its Equipment
Blaine, strength, and setting time readings are logged against the mill, kiln, and feeder that produced the batch — not filed separately in a lab notebook disconnected from maintenance records.
02
Control Limits Flag the First Out-of-Band Reading
Statistical control limits catch the earliest signal that a batch is drifting — days before a manual spreadsheet review would notice the same pattern, and long before the batch reaches a customer.
03
The Flag Creates a Work Order, Not Just an Alert
A Blaine excursion routes to a separator calibration check, a strength drift routes to a burner or refractory inspection, and a setting time swing routes to gypsum feeder calibration — automatically, tied to the likely cause.
04
A Consistency Scorecard Exports in Minutes
Per grade, per plant, per quarter — a documented consistency record is ready for customer quality conversations and certification audits without a week of manual report assembly.
Getting Started
Building a Consistency Baseline Before You Talk to Customers
Most plants can't answer "how consistent is your cement" with a number, because the data needed to answer it lives in three different places — a lab spreadsheet, a maintenance log, and whatever an operator remembers from the last shift. A baseline pulls those together into one picture before any customer conversation happens, and it usually takes less than a week once the batch history is centralized in one system.
Pull 90 Days of Batch History
Line up Blaine, strength, and setting time results by batch and by grade to see where the actual variance sits today, not where the spec sheet assumes it sits.
Match Excursions to Equipment Events
Cross-reference every out-of-band reading against liner change dates, gypsum feeder calibrations, and burner inspections to find the equipment pattern behind the variance.
Set Internal Bands, Not Just Spec Limits
A grade minimum tells you the floor. An internal target band — like the 3–5 MPa strength margin — tells your team when to intervene before a customer ever sees a marginal batch.
Assign Ownership Per Signal
Blaine variance usually traces back to the grinding team, strength drift to kiln operations, and setting time to raw mix and gypsum dosing — name an owner for each so a flagged drift has somewhere to go.
Consistency Scorecard
What a Tracked Consistency Window Looks Like
Blaine Fineness Held Within Target Band
92%
28-Day Strength Margin in the 3–5 MPa Zone
87%
Setting Time Held Within Spec Band
90%
Plants tracking all three signals against equipment history report
Consistently tighter batch-to-batch variance across every grade
Not a one-time correction — a maintained band that holds through liner wear cycles, gypsum feeder drift, and burner condition changes, because the equipment causing each drift gets flagged and fixed instead of rediscovered next quarter. That is the number a quality team can put in front of a skeptical customer and defend line by line.
Fleet Manager Questions
Cement Quality Consistency — What Plant Quality Managers Ask
What causes batch-to-batch Blaine fineness variance in cement grinding?
+
Separator wear, feed rate swings, and mill liner wear are the most common causes — and mill liner wear is the hardest to catch because Blaine readings can still look stable while particle size distribution has already shifted.
Start a free trial to see liner wear tracked alongside your fineness trend.
Why does 28-day strength drift even when Blaine fineness looks stable?
+
Strength depends on clinker mineralogy as much as fineness, and free lime is the earliest indicator of a burning problem that fineness alone won't reveal. A reading above 1.5% signals under-burning; below 0.5% signals wasted fuel from over-burning.
How much strength margin should a plant carry above grade minimum?
+
A 3–5 MPa buffer above grade minimum is the commonly cited safe range. Below 2 MPa risks customer failures from normal batch variation; above 8 MPa typically means over-burning or over-grinding, wasting fuel and energy on quality nobody is paying for.
Can setting time swings hurt customer relationships even when strength passes spec?
+
Yes — a drifting gypsum feeder can shift setting time enough that ready-mix and precast customers have to adjust admixture dosing batch by batch. That friction is often what drives a buyer to test another supplier, even when strength results are fully compliant.
How does connecting quality data to equipment maintenance actually reduce variance?
+
When a lab result and the equipment that produced it live in the same system, an out-of-band reading routes straight to the calibration or inspection record most likely to explain it, instead of getting logged and forgotten.
Book a demo to see the workflow on your own quality data.
OxMaint · Cement Quality Consistency Platform
Boring, Predictable Batches Are What Keep Customers From Shopping Around
OxMaint connects your Blaine, strength, and setting time results to the mill, kiln, and feeder equipment behind them — so a quality signal becomes a work order before it becomes a rejected load. Build the consistency record that keeps your best accounts from testing another supplier.