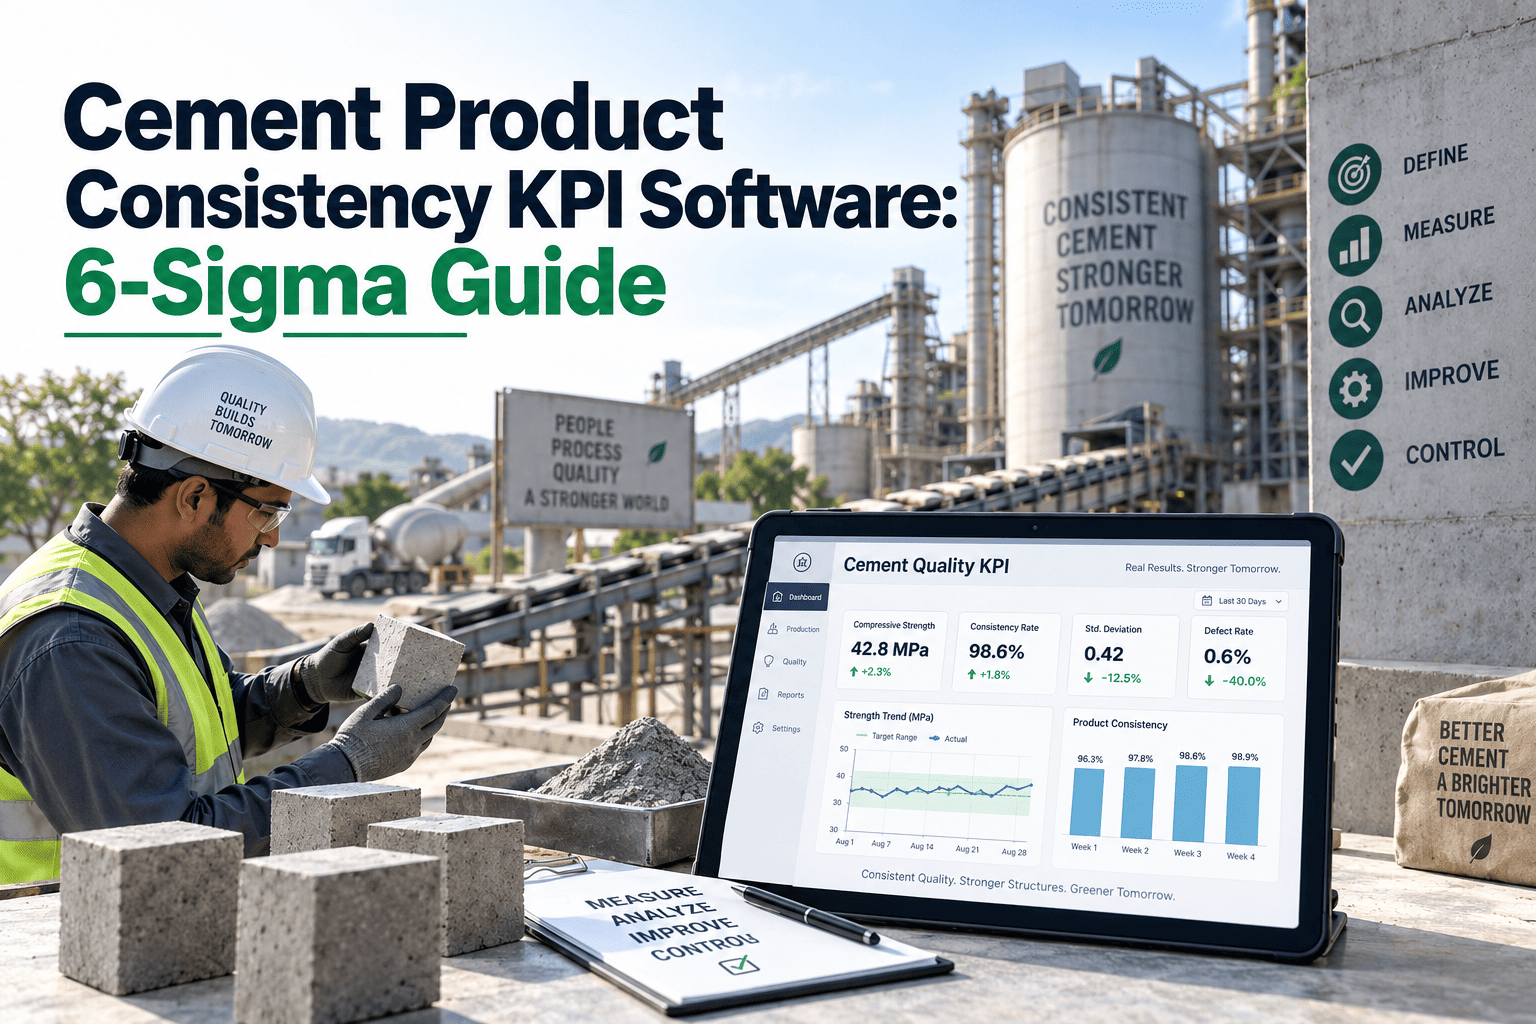
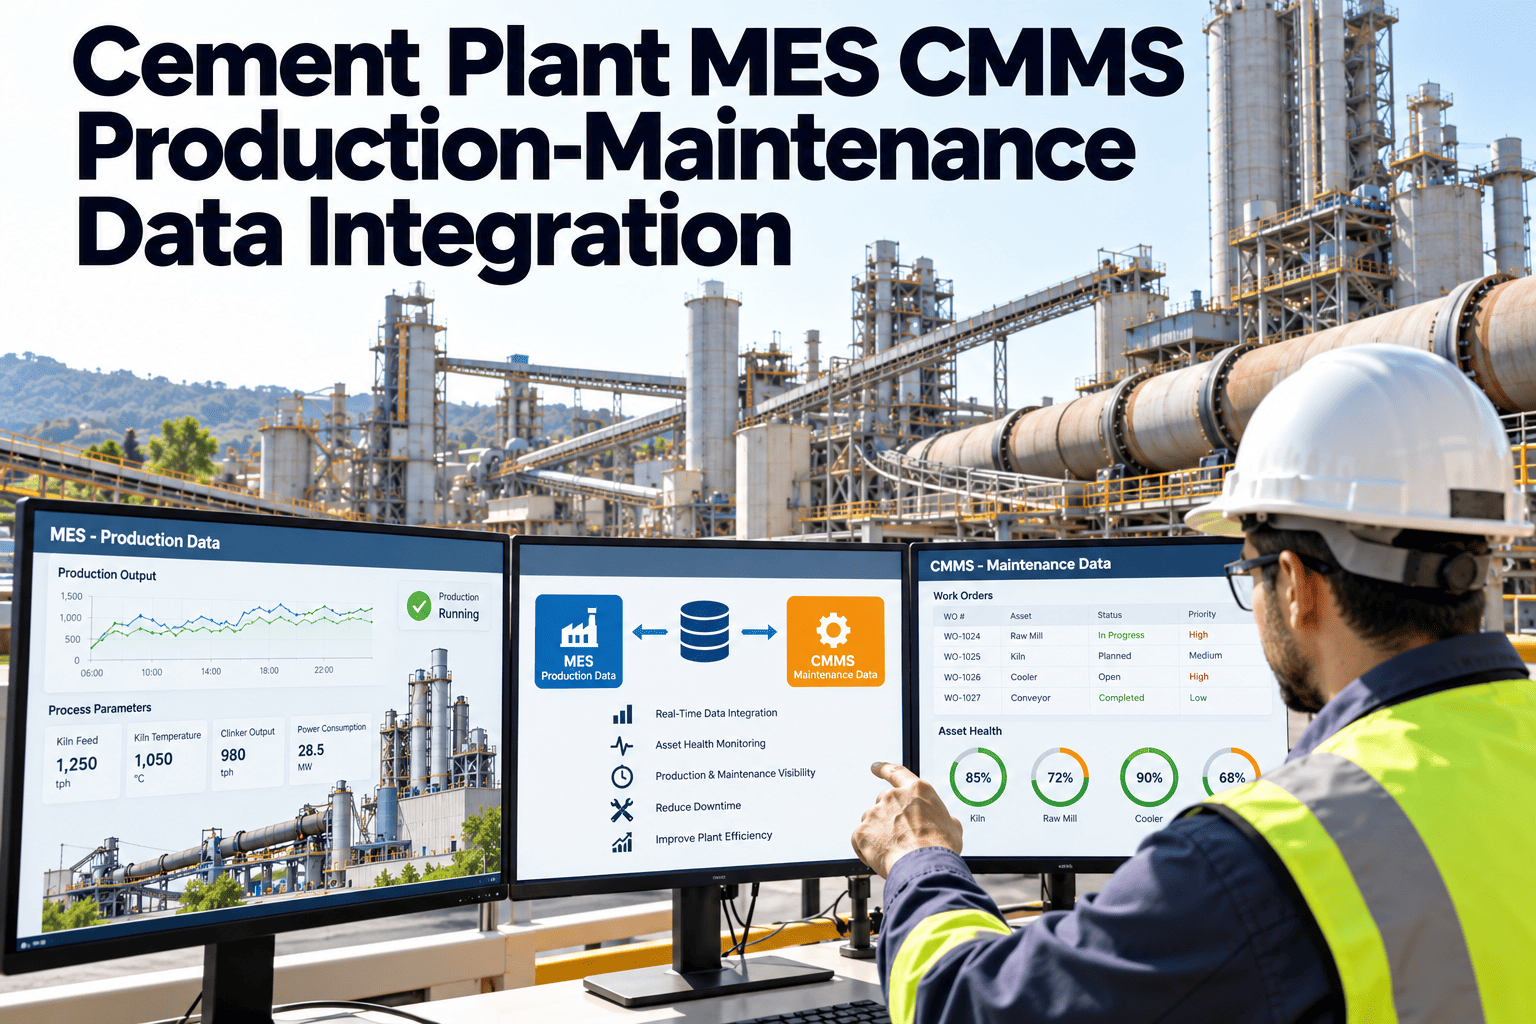
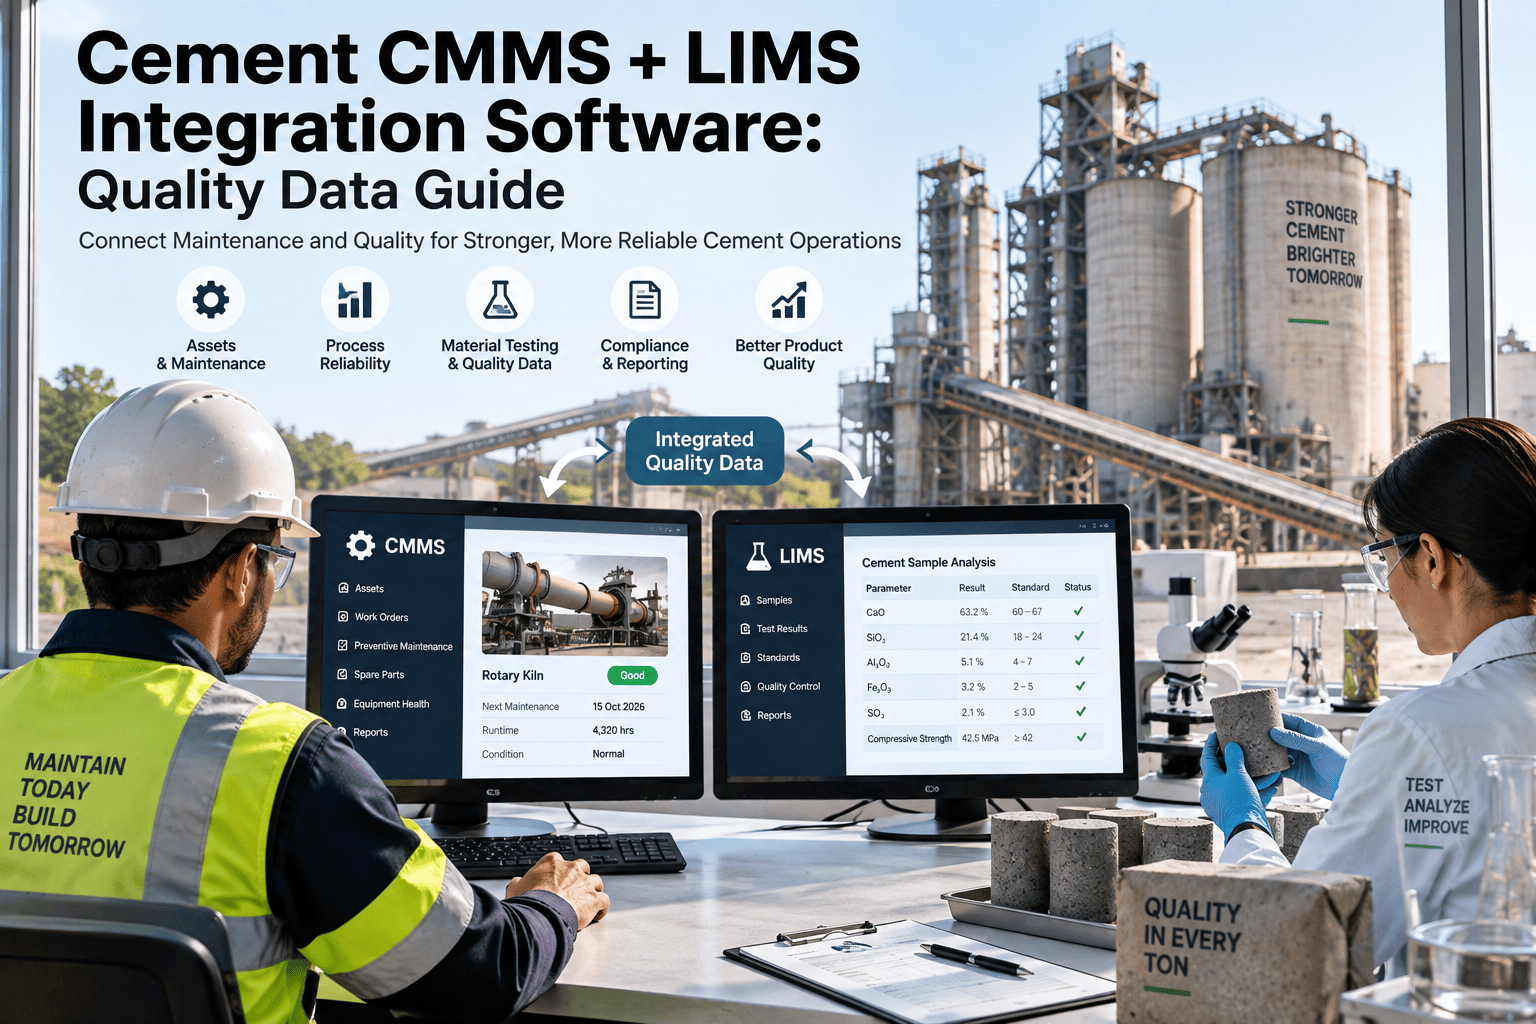
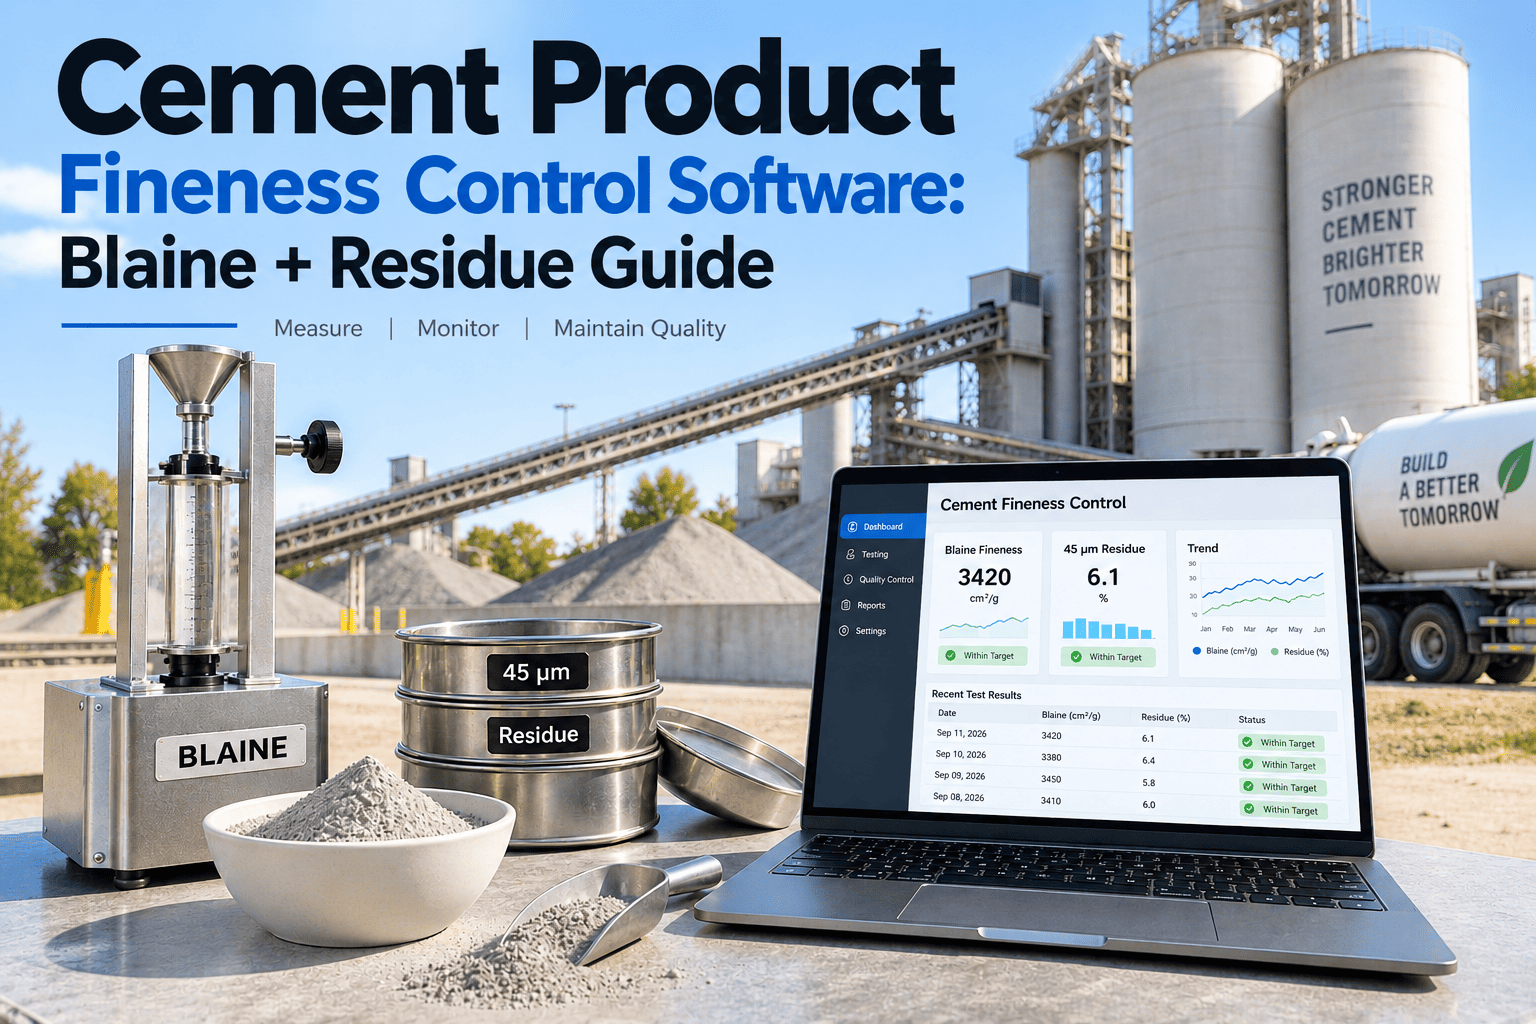
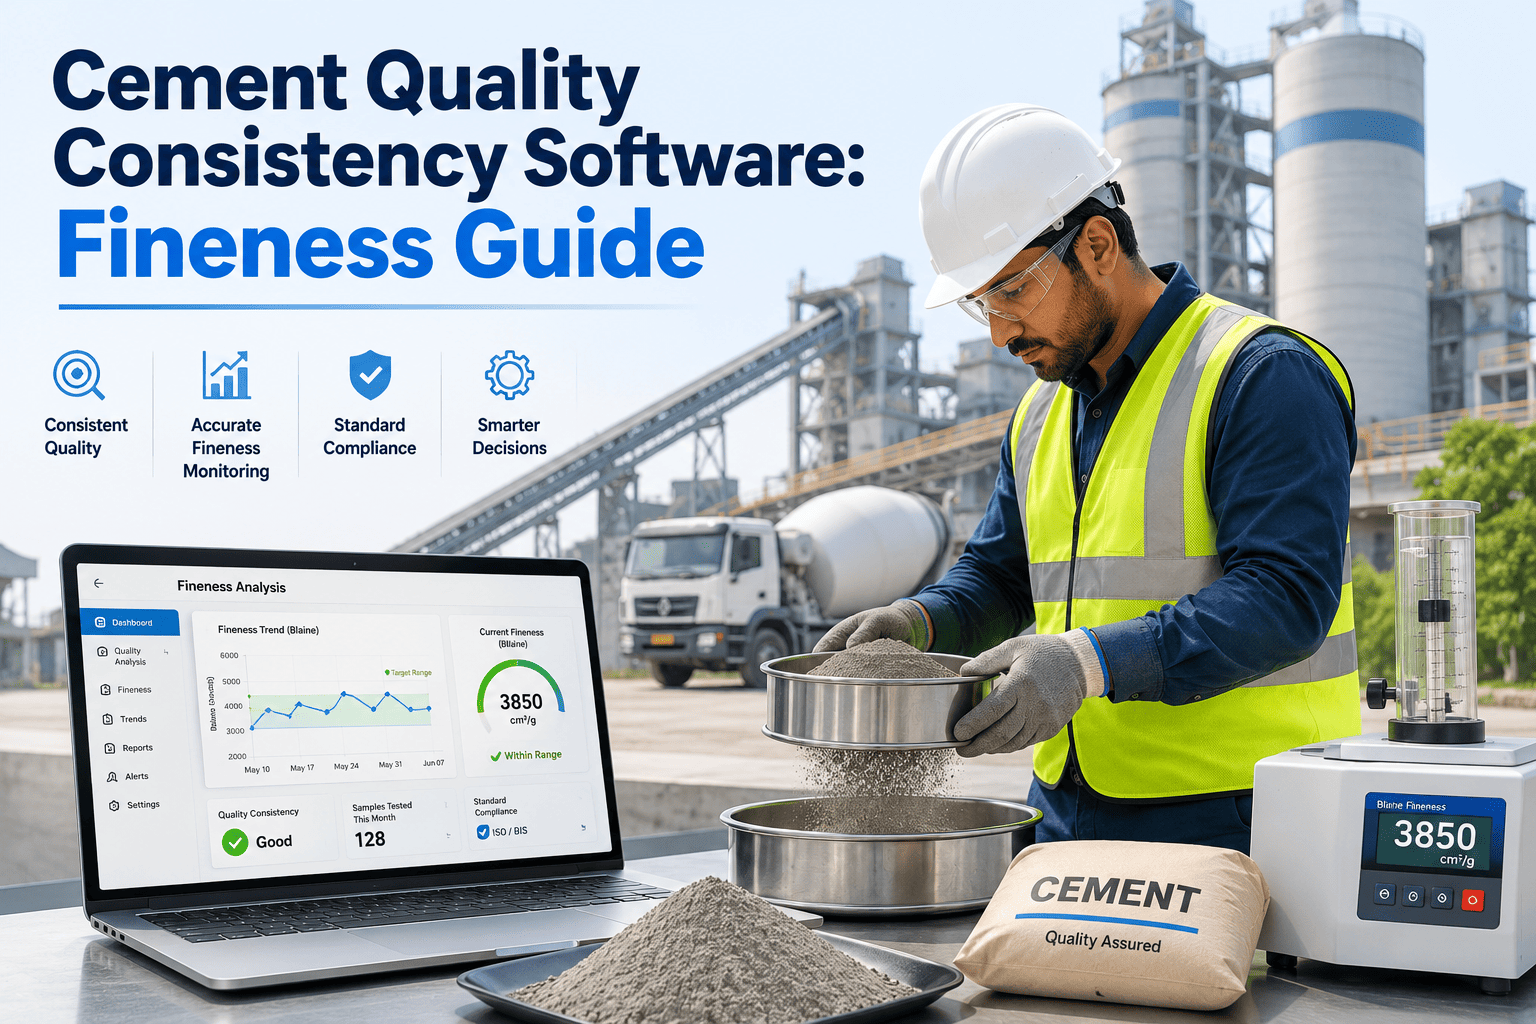
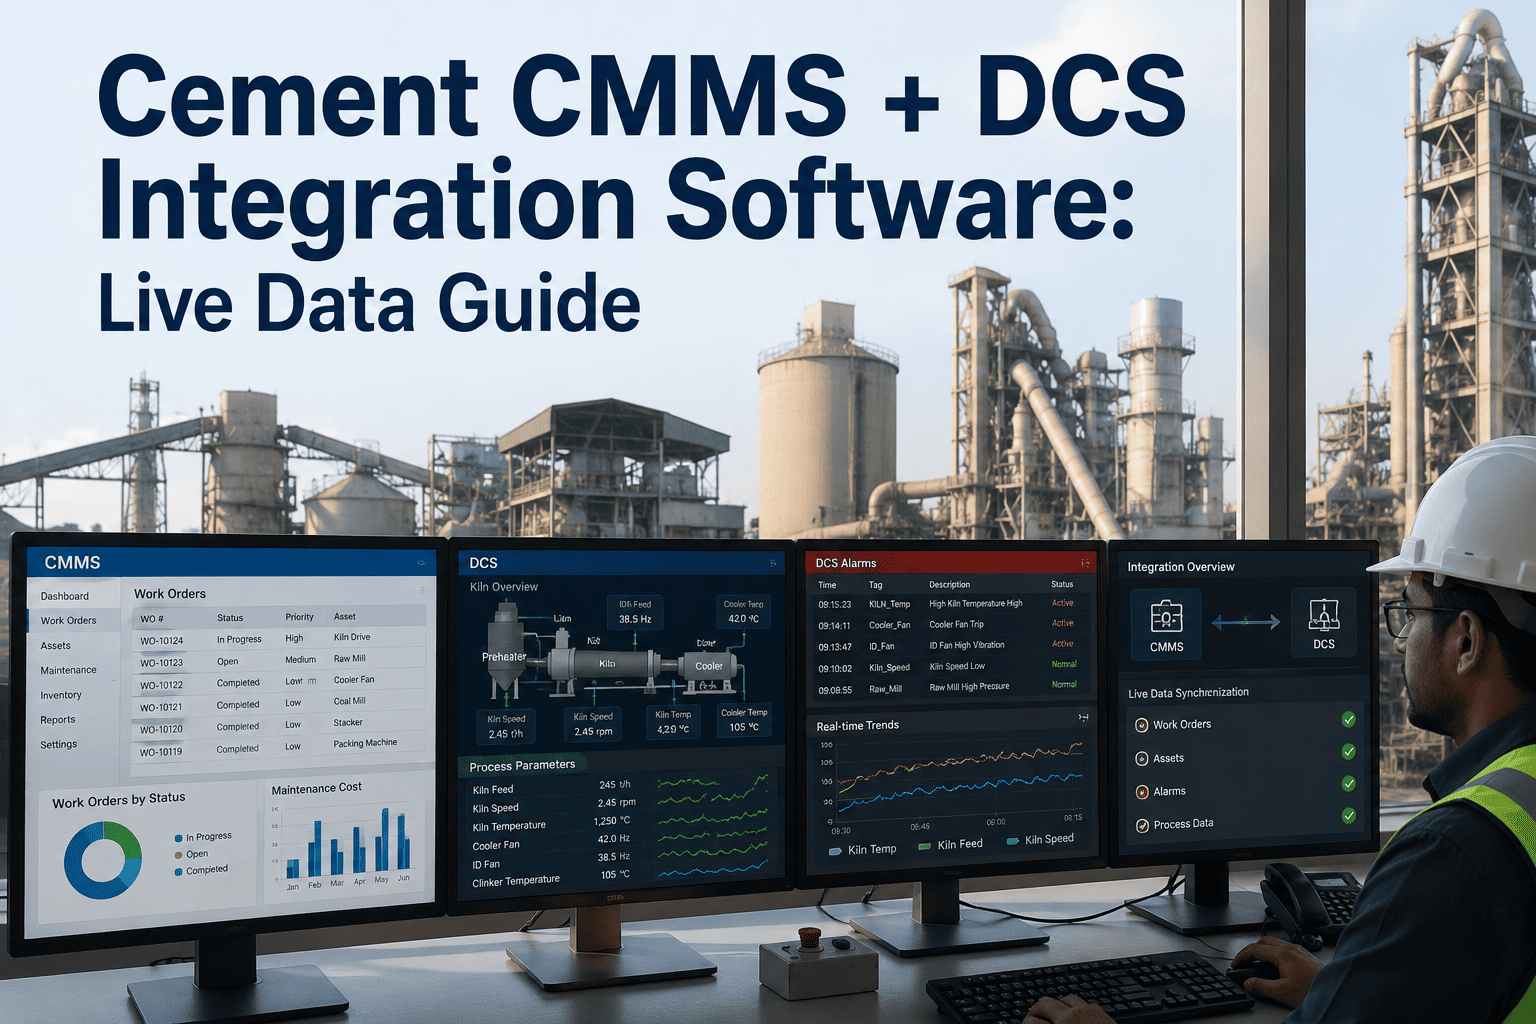
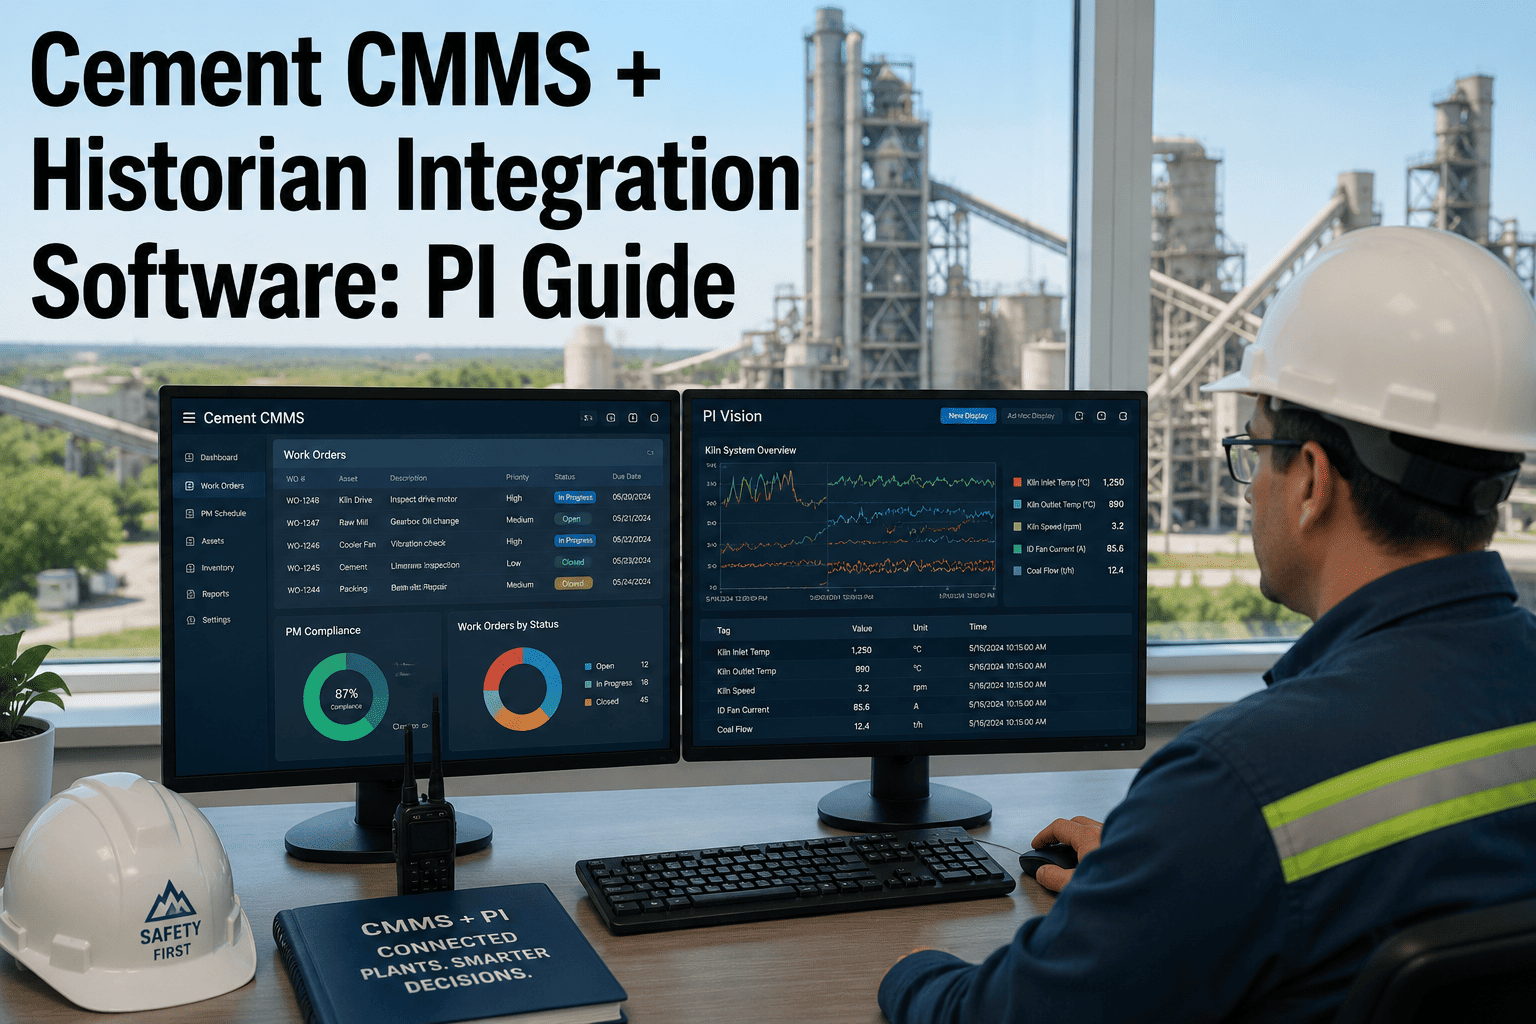
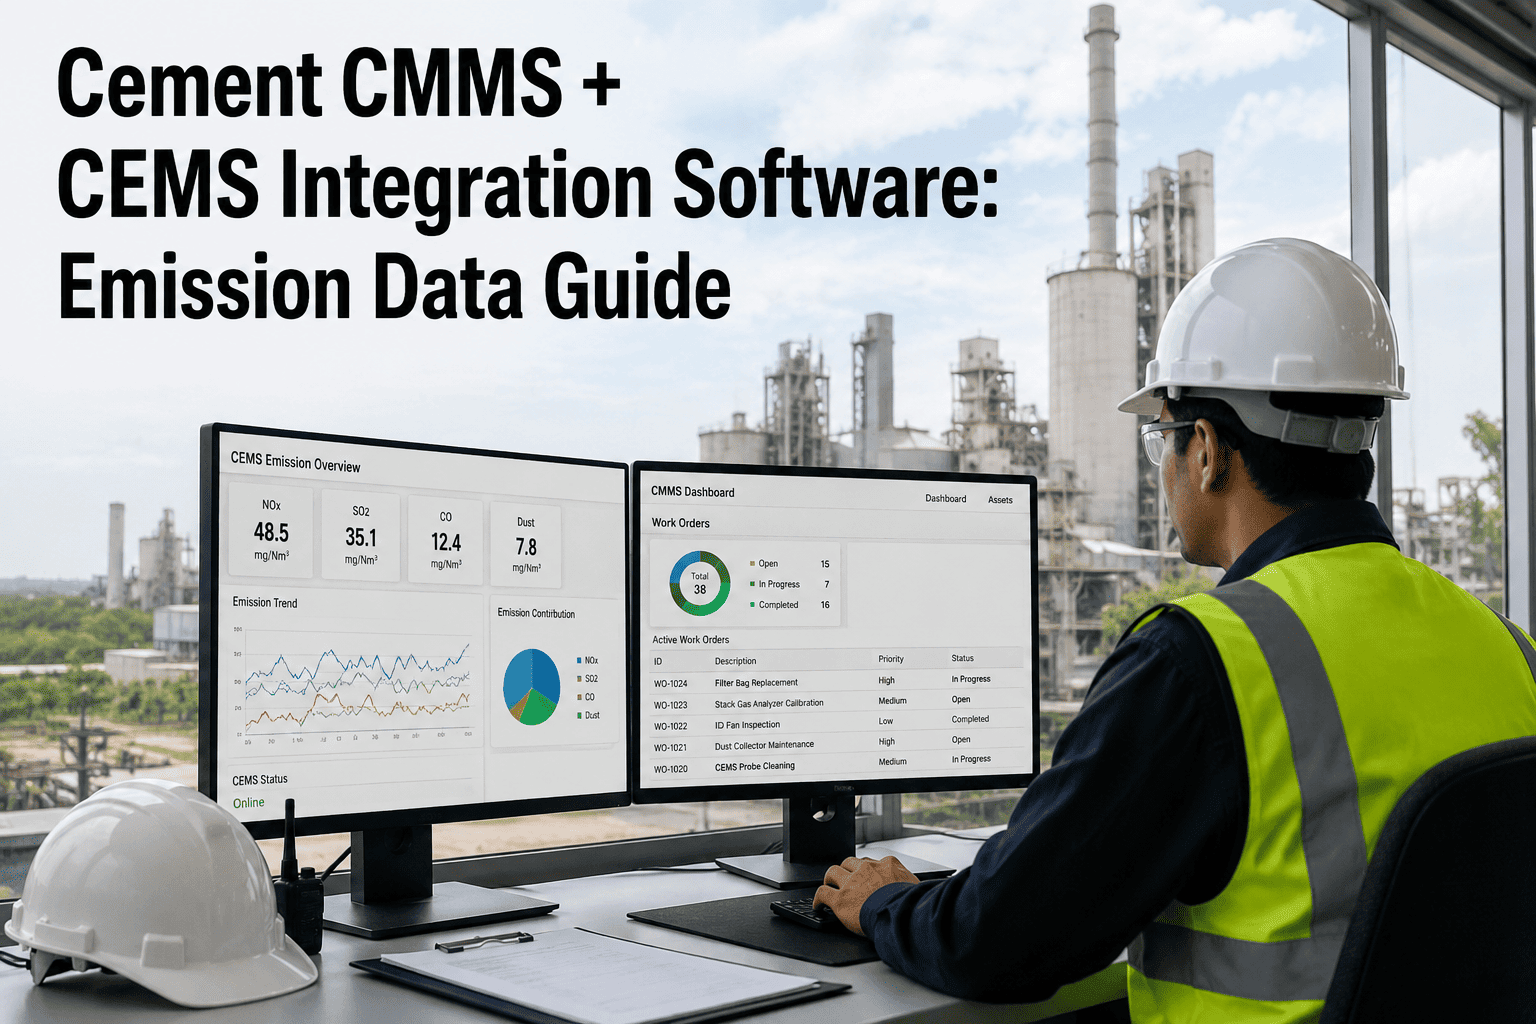
A cement plant can hit every tonnage target on the shift report and still lose the customer relationship that pays for it. The reason is almost never a breakdown — it is drift. A finish mill running slightly rich on clinker, a Blaine fineness that wanders outside its band for three consecutive shifts, a setting time that creeps two minutes past spec, or a 28-day compressive strength that barely clears the minimum. None of these trips a machine alarm. Each one shows up weeks later as a rejected truck, a customer complaint, or a quality claim that costs far more than the raw material it was supposed to save. Six-sigma thinking exists precisely to catch this kind of variation while it is still small, but most plants are still tracking Blaine, strength, and setting time in spreadsheets nobody opens until month-end. See how OxMaint turns every lab and process reading into a live consistency score your QA and sales teams can actually defend.
Cement Quality Control
Stop Finding Out About Quality Drift From a Customer Complaint
OxMaint turns Blaine, strength, setting time, free lime, and LSF into one rolling consistency score — updated every batch, visible before the truck leaves the yard.
±300–500 cm²/g
Typical uncontrolled Blaine swing within a single shift when fineness is corrected only after a lab result arrives
45–90 min
Average lag between a quality drift starting and a manual lab result reaching the control room operator
Cpk 1.33+
The process capability index most cement standards and customer audits expect for strength and fineness control
Why Consistency KPIs Deserve Their Own Dashboard
Most cement plants already track throughput, kiln uptime, and specific power consumption closely, because those numbers move the P&L every day. Product consistency gets less attention for a simple reason — it rarely fails all at once. Fineness drifts a little, then a little more. Free lime creeps up during a coal quality change. Gypsum dosing lags a clinker feed adjustment by a few minutes. Individually, none of these events breaches a hard specification limit, so nobody escalates them. Collectively, they are exactly what six-sigma programs are built to catch: small, correlated shifts in a process that is technically "in spec" but no longer in control. A dedicated consistency KPI layer treats every batch as a data point on a control chart, not a pass-or-fail test, which is the only way to see drift before a customer does.
Cement Six-Sigma Isn't the Same Playbook as Discrete Manufacturing
Most six-sigma literature was written for assembly lines, where a defect is a single part that either meets tolerance or does not. Cement is a continuous, blended process — raw mix, kiln burning, grinding, and dosing all interact, so a small shift in one parameter propagates into two or three others before it ever reaches a finished-product test. That is why a cement consistency program cannot just watch final Blaine or final strength in isolation. It has to track the chain — LSF into free lime, feed rate into fineness, gypsum dosing into setting time — so that when a control limit is approached, the root cause is already visible instead of requiring a separate investigation days later. This is the structural reason spreadsheet-based quality tracking struggles in cement plants even when the underlying six-sigma discipline is sound: the data lives in five different systems and nobody is correlating it batch by batch.
The Six KPIs That Actually Define Cement Consistency
A consistency program only works if it is built on the parameters that genuinely predict product performance, not just the ones that are easiest to measure. These six, pulled from lab LIMS data and mapped against every production batch, cover the full path from grinding circuit to loaded truck.
01
Blaine Fineness
Grinding circuit — highest-leverage single parameter
Blaine fineness governs strength development, water demand, and setting behaviour all at once. Reactive control — adjusting the separator after a lab result lands 45 to 90 minutes late — locks a plant into permanent chase-and-correct mode instead of holding a tight band.
02
Compressive Strength (1, 7, 28-day)
The parameter your customer actually pays for
Early and late-age strength results are the clearest signal of C3S content, fineness, and curing consistency working together. A widening gap between 1-day and 28-day results across batches usually points to raw mix or grinding variation upstream, not a testing error.
03
Setting Time (Initial & Final)
Gypsum dosing and SO₃ balance indicator
Setting time swings almost always trace back to gypsum feed rate lagging behind clinker feed changes, or to SO₃ content drifting out of its optimal window. Because it is downstream of two other variables, it is often the first place a hidden dosing problem becomes visible.
04
Free Lime
Kiln burning zone control signal
Free lime is the fastest-reacting indicator of clinker burning quality — a rise usually means burning zone temperature, kiln feed rate, or raw mix LSF has moved before any other quality test would show it. Tracking it batch-by-batch catches kiln upset conditions early.
05
SO₃ / Gypsum Balance
Long-term strength and false-set risk
An SO₃ level even slightly outside optimum can cause false set, flash set, or reduced later-age strength, none of which show up until the concrete is placed. Continuous tracking against target ratio, not just spec limits, protects against complaints that arrive weeks after shipment.
06
LSF & C3S Consistency
Raw mix stability — the root of everything downstream
Lime saturation factor and C3S content define how a clinker will behave in every downstream test. Batch-to-batch variability here, even within spec, propagates directly into fineness sensitivity, strength scatter, and setting time variation further down the process.
Six-Sigma Ready
Every Batch Scored. Every Drift Flagged. Before It Ships.
OxMaint pulls Blaine, strength, setting time, free lime, SO₃, and LSF straight from your lab LIMS and maps every value against your control limits automatically.
From Lab Result to Corrective Action — How the Loop Closes
A KPI is only useful if it triggers a response fast enough to matter. In most plants the lab-to-corrective-action loop is slow because it depends on someone manually checking a result against a chart. OxMaint closes that loop automatically, so a fineness or strength reading that starts drifting gets flagged the moment it happens, not at the next quality review meeting.
Batch
Lab Result Captured
Blaine, strength, setting time, free lime, and SO₃ results are pulled from the LIMS the moment they are logged and linked to the exact production batch and mill.
Instant
Control Chart Updated
Every result plots against its own Cpk control limits in real time, so a value that is technically within spec but trending toward it is visible immediately, not buried in a monthly average.
Alert
Drift Flagged to Shift Supervisor
When a parameter breaches a control limit or shows three consecutive shifts trending the same direction, an alert goes straight to the responsible operator with the specific batch and value attached.
Action
Corrective Action Logged
The adjustment made — separator speed, gypsum dosing, kiln feed rate — is logged against the alert, creating a documented, timestamped root-cause record instead of tribal knowledge.
Result
Consistency Score Recalculated
The plant's rolling consistency score updates automatically, giving QA managers and customer-facing sales teams a defensible, current answer whenever a big account asks how stable the product really is.
Six-Sigma Benchmarks for Cement Consistency
Six-sigma programs are judged on process capability, not just whether a result technically passed. The table below sets out where an uncontrolled process typically sits, where a Cpk-1.33-capable process sits, and where OxMaint raises an alert — so your team can see exactly how much room for drift actually exists before a batch becomes a risk.
What Consistency Control Is Actually Worth
Cement quality programs are usually justified on compliance grounds, but the real return shows up in three places that finance teams and plant managers both care about: fewer rejected loads, faster audit cycles, and stronger customer retention on large accounts that run their own incoming quality checks.
Rejected Load Reduction
Batch-level control instead of end-of-shift averages
Typical reduction in off-spec dispatches
30–45%
Time to first measurable improvement
60–90 days
Documentation generated
Automatic, batch-linked
Audit & Certification Speed
IS, ASTM, and EN standard compliance trails
Time to produce a compliance report
Under 15 minutes
Certificate generation
Auto-mapped to batch data
Audit trail depth
Every reading, every mill
Customer Retention
What large accounts ask for at renewal
Evidence QA teams can hand a buyer
Live consistency score
Response time to a quality query
Same day, not next cycle
Impact on repeat contract negotiations
Measurably stronger position
Before OxMaint, our Blaine chart was a paper log the shift supervisor updated by hand. Now every batch plots itself against our control limits automatically, and when fineness starts drifting we know within the hour instead of at the next lab review. Our largest ready-mix customer now gets a live consistency report instead of a monthly average, and that alone kept the account at renewal.
— Plant Quality Manager, Integrated Cement Group
Frequently Asked Questions
Does OxMaint replace our lab LIMS or connect to it?
OxMaint connects directly to your existing LIMS rather than replacing it. Lab results for Blaine, strength, setting time, free lime, and SO₃ flow in automatically and get mapped to the exact production batch.
Start a free trial to see it connect to your lab feed.
What counts as a "consistency KPI" versus a normal quality test?
A single test result tells you if one batch passed. A consistency KPI tracks the same parameter across every batch against its control limits, revealing drift and trend before any individual result actually fails specification.
Can OxMaint alert us before a batch goes off-spec, not after?
Yes. Alerts trigger on trend direction and control-limit proximity, not only on hard spec breaches, which is what shifts a plant from reactive testing to predictive quality control.
Book a demo to see real alert thresholds configured for your grades.
How does this help during a customer or third-party quality audit?
Every reading is timestamped, batch-linked, and exportable, so a compliance report that used to take a full day of pulling paper logs together can be generated in minutes with a complete, defensible audit trail attached.
Is OxMaint's consistency dashboard usable by non-technical managers?
The dashboard is designed for plant managers and sales teams, not just process engineers — a single consistency score and trend line communicate quality performance without requiring anyone to read a raw control chart.
See the dashboard free before your next customer call.
Cement Product Consistency — OxMaint
Give Your QA and Sales Teams a Score They Can Defend
Connect your lab LIMS, set your control limits, and start catching drift before it becomes a rejected load or a lost account.