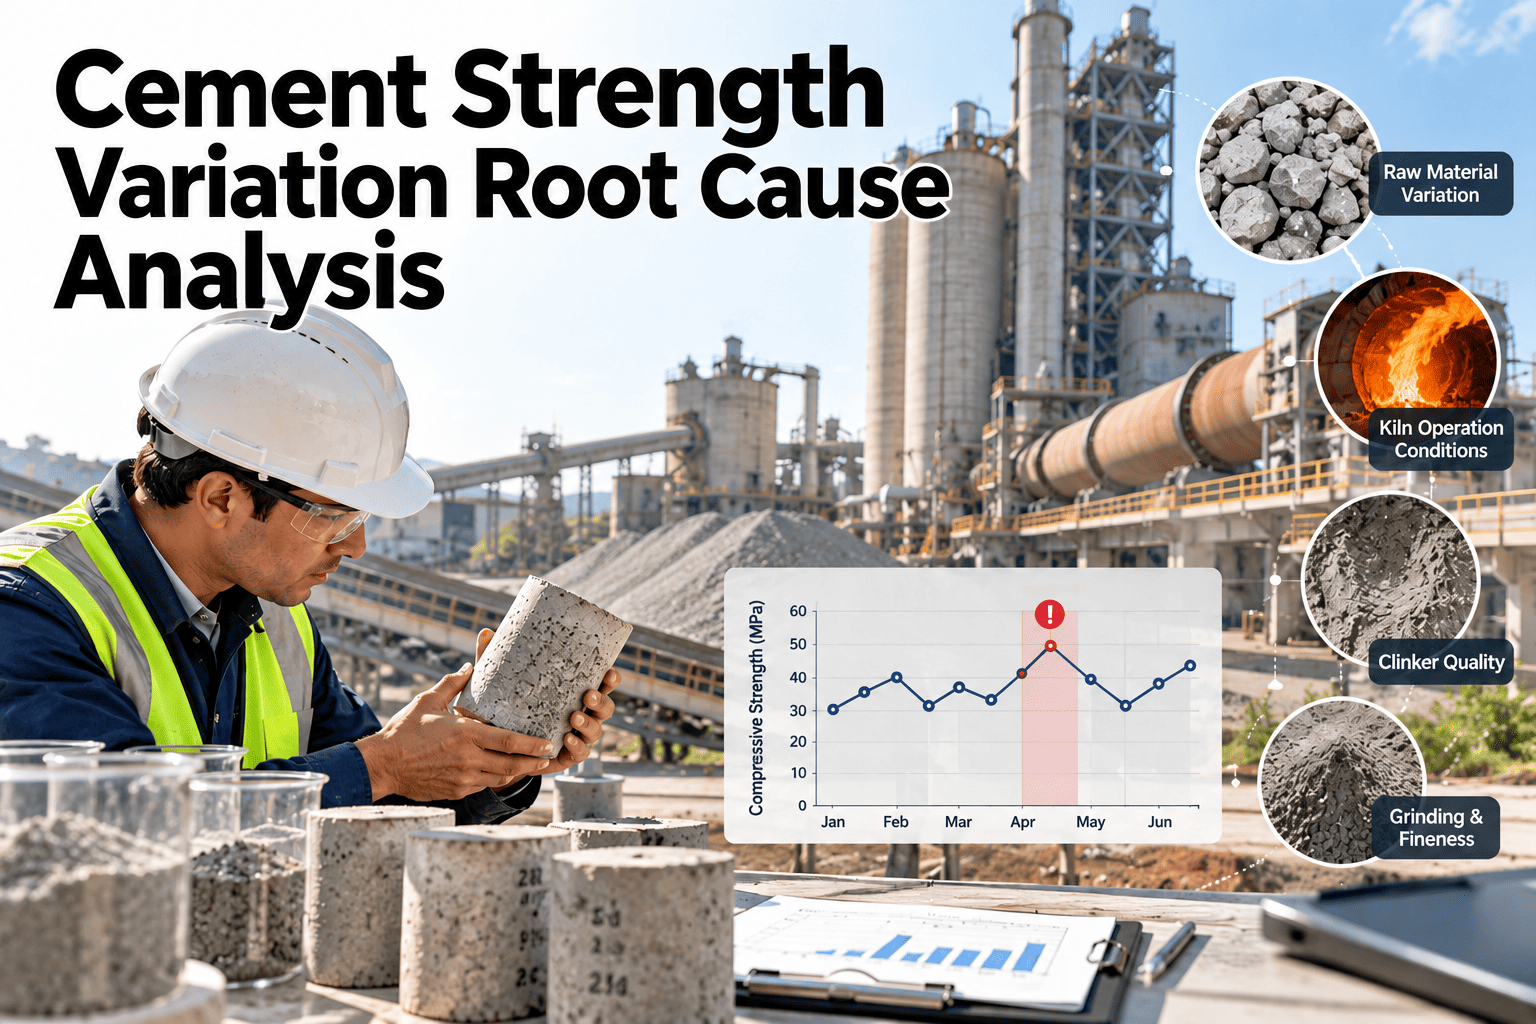
Strength variation is one of the hardest quality problems in cement manufacturing because the cause is rarely where the result appears. A low 28-day result may trace back to clinker phases, gypsum dosing, fineness, additive moisture, or even sampling and testing practice. Chasing it without a method wastes weeks. A disciplined root cause approach, supported by maintenance and work order records, separates process causes from equipment causes and shows which corrective action actually worked.
Cement Strength Variation Root Cause Analysis
Trace strength inconsistency from the test result back through the cement mill, additives, gypsum, clinker, and kiln. Use evidence from equipment condition and maintenance history, not assumption.
Why strength results are hard to explain
- Standard strength tests take days, so the cause is long gone when the number arrives.
- Early strength at one and two days responds to clinker and fineness, while 28-day strength also reflects later hydration effects.
- Several small variations can stack up even when each stays within its own limit.
- Test variability itself adds noise, so a single result should not trigger major process changes.
Cause map by category
Clinker
- Free lime and alite content shifts
- Burning zone temperature swings
- Slow or uneven cooling
- Fuel and raw mix variability
Grinding
- Particle size distribution changes
- Separator wear and poor cut point
- Mill temperature and dehydration of gypsum
- Liner and grinding media wear
Composition
- Gypsum dosing accuracy and SO3 control
- Limestone, slag, or fly ash proportions
- Additive moisture and quality
- Weigh feeder drift
Sampling and testing
- Sampler condition and sample handling
- Mixing, curing, and mortar preparation
- Calibration of lab equipment
- Operator technique differences
Symptom to likely cause
| Symptom | Possible cause | Evidence to check | Asset or record to review |
|---|---|---|---|
| Low early strength | Coarser cement or low alite | Blaine, sieve residue, clinker phases | Separator condition, mill liner history |
| Erratic strength across days | Unstable clinker or dosing | Free lime trend, feeder logs | Kiln events, feeder calibration records |
| Good early, weak late | Low clinker reactivity or SO3 imbalance | SO3 results, clinker cooling | Cooler condition, gypsum feeder |
| Variation between mills | Different wear or settings | Fineness distribution by mill | Maintenance history per mill |
| Sudden shift after a stop | Changed component or setting | Work orders around the date | Completed repairs, parts replaced |
Root cause workflow
Define the deviation
State the product, period, and size of the change. Confirm the test result is repeatable.
Build a timeline
Place kiln events, mill changes, feeder trips, and maintenance work on one axis.
Test the categories
Check clinker, grinding, composition, and testing in order, using measured data.
Confirm the cause
Look for a change that matches the timing and explains the direction of the shift.
Correct and verify
Apply the fix through a work order and confirm results return to the expected range.
Put quality and maintenance evidence on one timeline
Link strength deviations to the equipment work that preceded them, so each investigation starts with facts.
Equipment causes that quality teams often miss
Before and after a structured RCA practice
Without structure
- Multiple changes made at once
- Cause guessed from the latest event
- Maintenance records not consulted
- Same deviation returns weeks later
With structure
- One hypothesis tested at a time
- Cause supported by timeline and data
- Asset history reviewed with quality data
- Fix recorded and verified
Preventive controls that reduce strength variation
- Calibrate gypsum, additive, and clinker feeders on a schedule and record the results.
- Inspect separator vanes, seals, and airflow at planned intervals.
- Track mill liner and media wear, and align rebuilds with quality data.
- Maintain cooler grates and air distribution to protect clinker quality.
- Service samplers and lab equipment as regulated assets, not afterthoughts.
- Review recurring deviations monthly with quality, production, and maintenance together.
Where Oxmaint fits
Asset history
Every repair, calibration, and inspection sits against the asset, ready for investigation.
Preventive scheduling
Recurring calibration and inspection tasks keep feeders, separators, and samplers in condition.
Corrective tracking
Root cause findings become work orders with owners, due dates, and closure records.
Evidence checklist for each investigation
- Strength, fineness, and SO3 results for the affected period
- Clinker free lime and phase data from the preceding days
- Kiln stability and fuel change log
- Feeder calibration and trip records
- Mill and separator maintenance history
- Lab equipment calibration and sample handling notes
Frequently asked questions
What is the first step in strength RCA?
Confirm the result is real, then build a timeline of process and equipment events.
Can equipment condition affect strength?
Yes, through fineness, dosing, and clinker cooling. Book a demo to see the tracking.
Why look at feeders?
Small drift in gypsum or additive dosing changes composition without alarms.
Is one bad result enough to act on?
Usually not. Look for a trend or repeat before changing the process.
How does software help?
It keeps asset history and corrective actions together. Sign up to try it.
Find the cause behind strength variation
Bring maintenance history into your quality investigations and close corrective actions with proof.