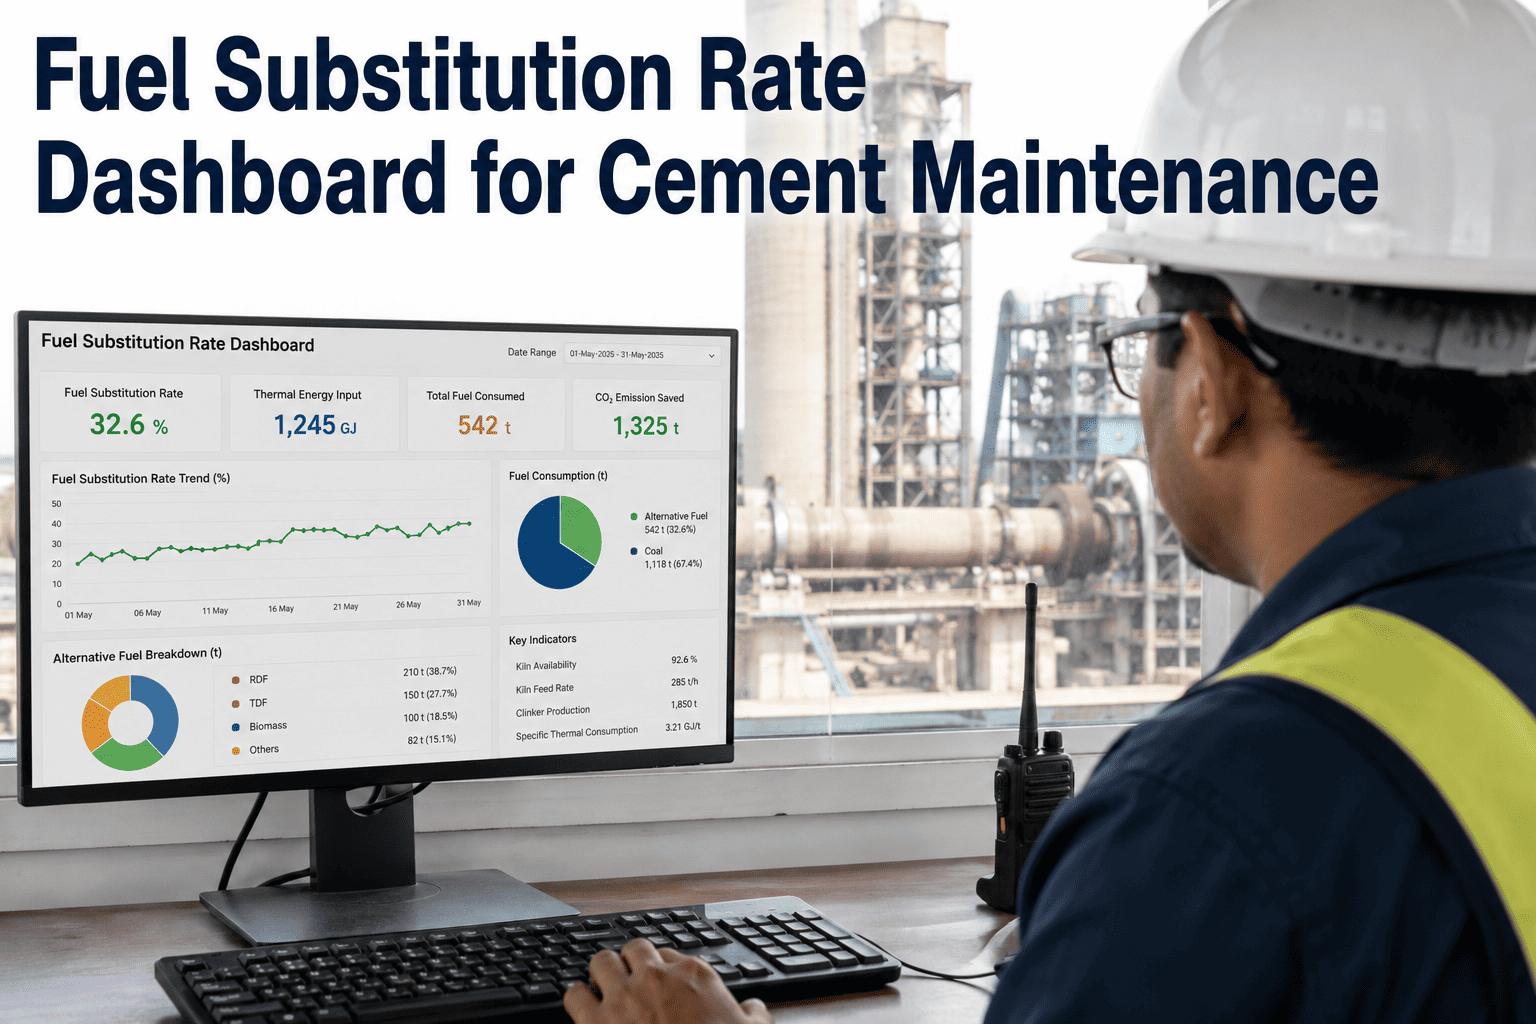
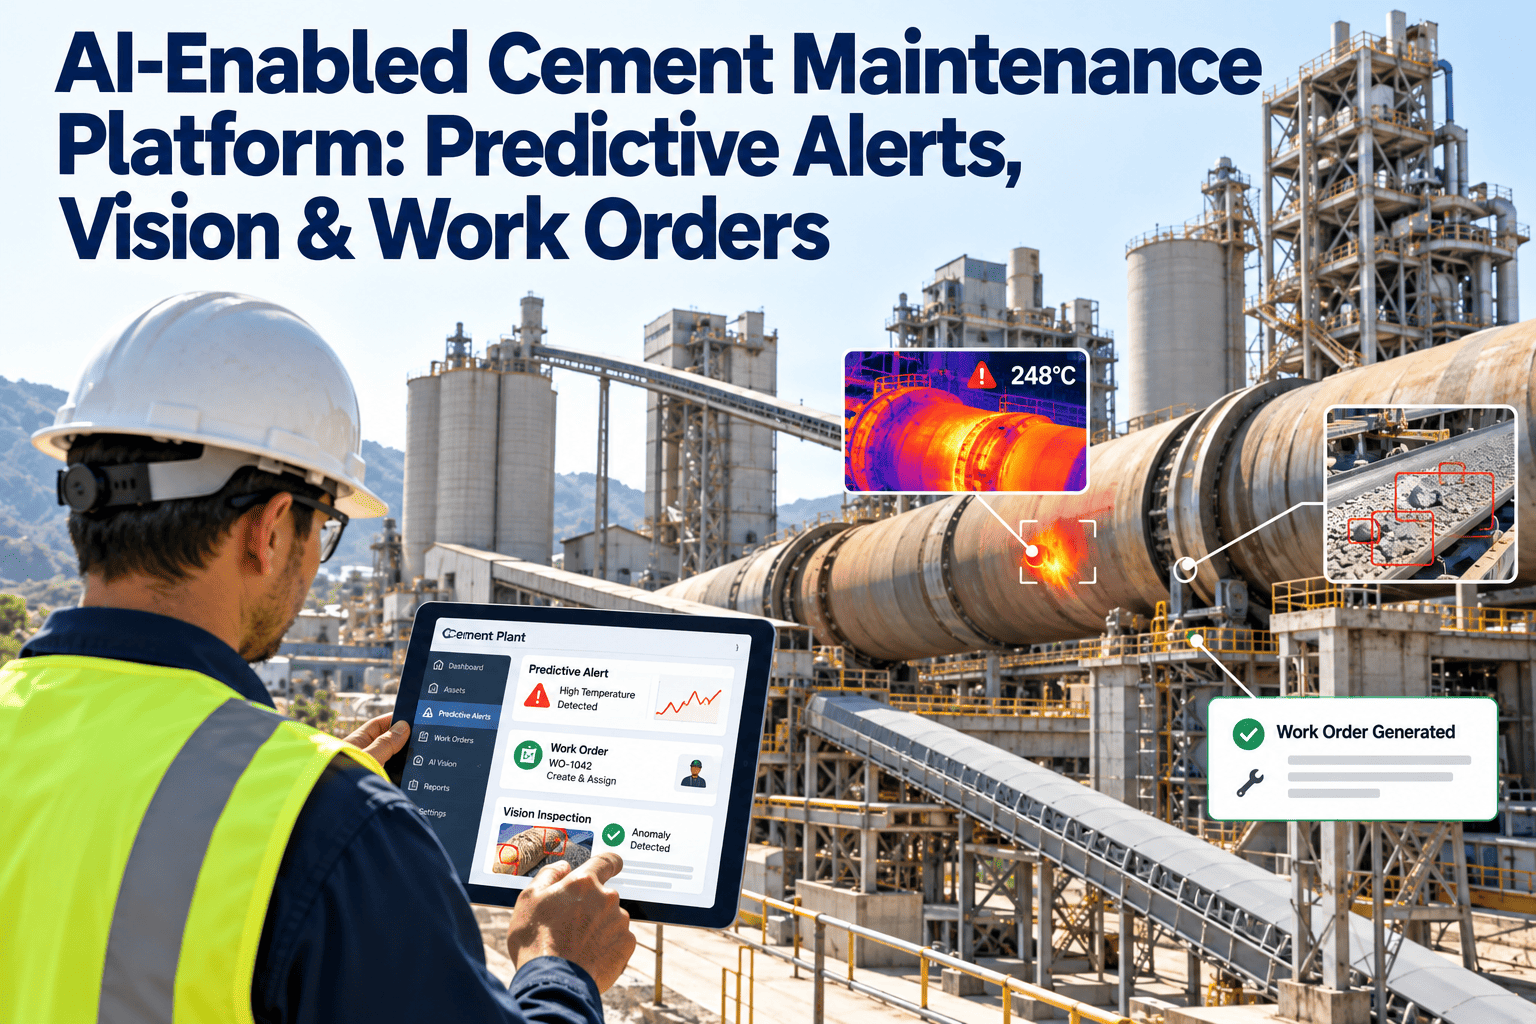
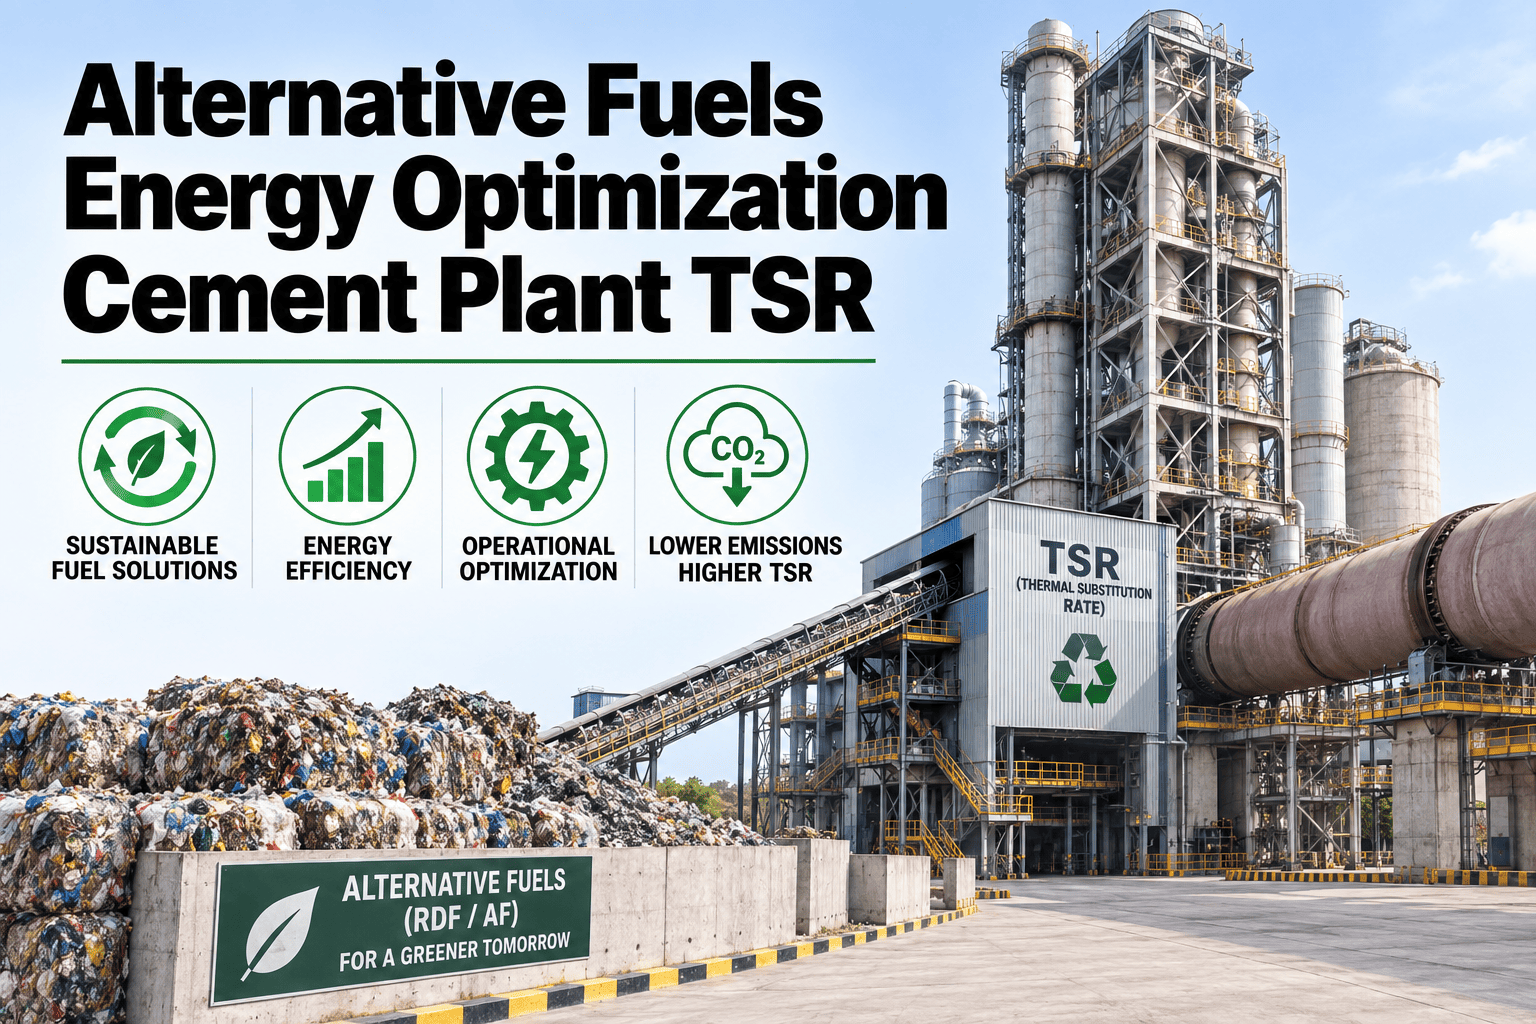
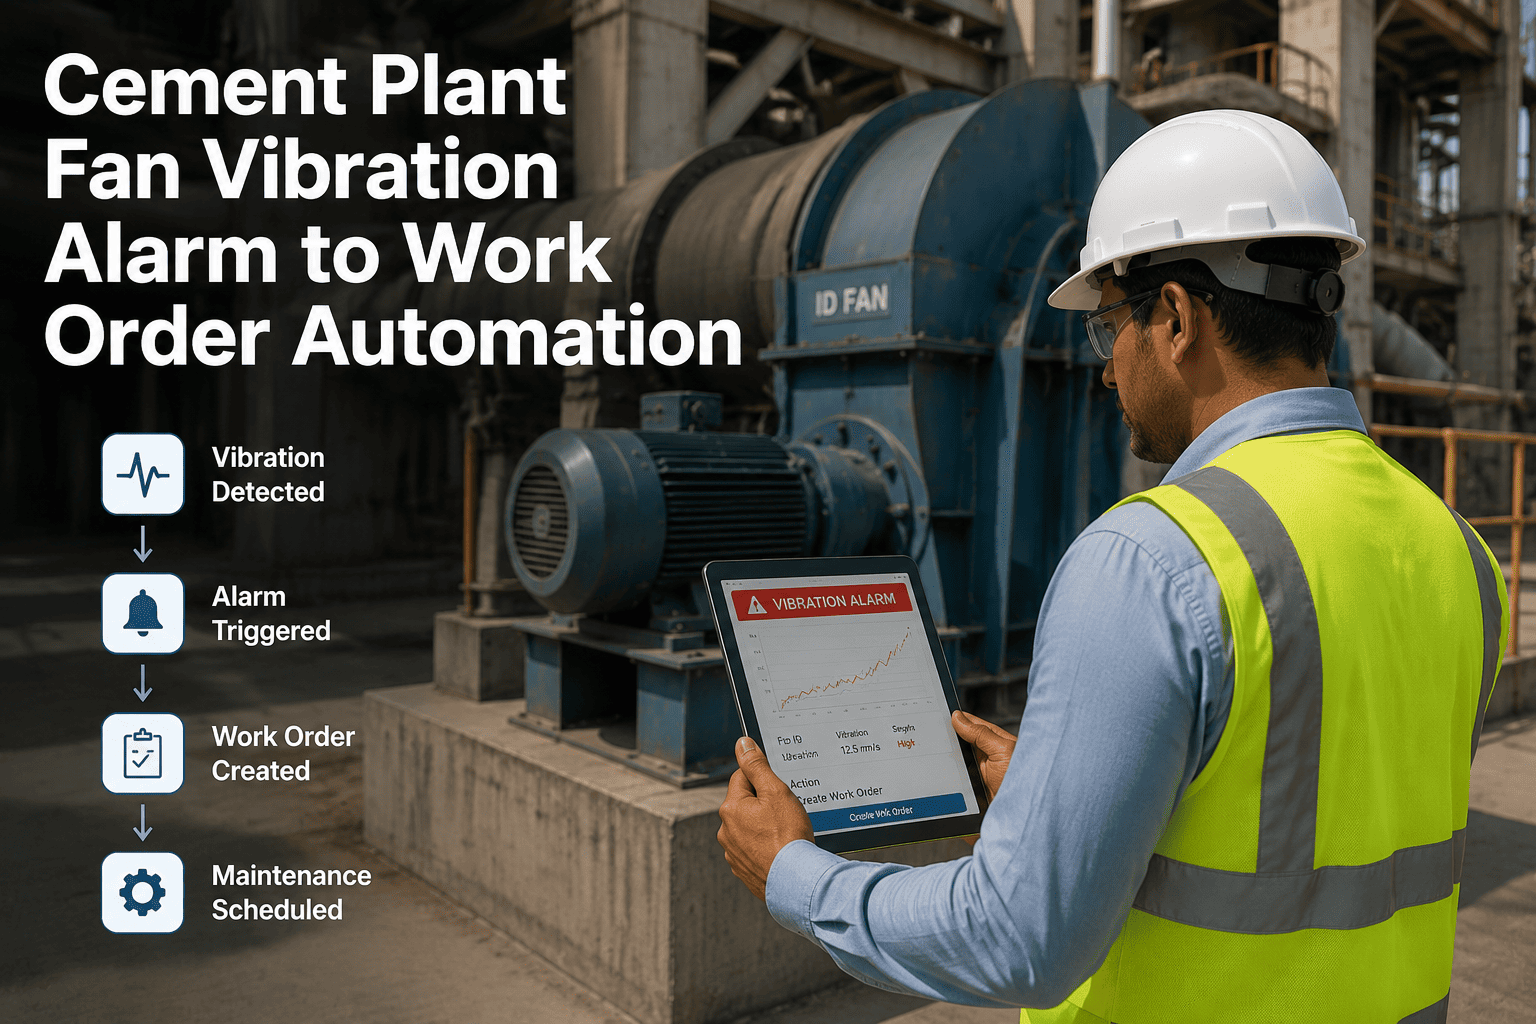
Most cement plants know their thermal substitution rate as a monthly number someone calculates after the fact — not a live figure they can act on while the kiln is running. By the time a TSR report lands on a manager's desk, the fuel blend that produced it is long gone, and any quality or maintenance issue it caused has already happened. The plants pushing past 30% and 40% TSR are not doing it with better fuel alone — they are doing it with a dashboard that connects fuel data, kiln condition, and maintenance action in real time. See how OxMaint turns thermal substitution rate from a monthly report into a live operational dashboard your team can act on every shift.
OxMaint · AI Analytics & Reporting
Your TSR Number Is Only Useful If You See It Before the Shift Ends
A fuel substitution rate dashboard that updates with kiln operations — not one that arrives as a spreadsheet three weeks later.
Live TSR Dashboard — Kiln Line 2
RDF
62%
Biomass
23%
TDF
15%
Where You Stand
The Global TSR Benchmark Ladder
Thermal substitution rate varies enormously by region, and knowing where your plant sits on this ladder shapes what your dashboard should actually be tracking. India's industry average remains under 1%, with a stated target of 25% by 2030, while parts of the EU already operate above 50% on average — and individual European plants have pushed past 80%.
India average — under 1% TSR today, 25% target by 2030
US average — approximately 16% TSR, rising about 1.4 points yearly
UK average — approximately 45% TSR across the national kiln fleet
EU average — approximately 52% TSR, with regional variation
Leading EU plants — 80% average, peaks reaching 100%
Wherever your plant sits on the ladder, the next step up depends on visibility — not guesswork. See what a live TSR dashboard looks like for your kiln configuration.
What the Dashboard Actually Tracks
Five Metrics That Matter More Than the Headline TSR Number
A single TSR percentage hides as much as it reveals. The plants that scale alternative fuel use safely watch a small set of supporting metrics alongside it — because TSR climbing while these drift in the wrong direction is not progress, it is risk building up out of sight.
01
Free Lime Trend Alongside TSR
Confirms substitution increases are not being paid for in clinker quality. A rising TSR with stable free lime is the only combination that counts as a genuine win.
02
Calorific Value Variance by Batch
Wide batch-to-batch swings in incoming RDF or biomass calorific value predict combustion instability before it shows up in the kiln.
03
AF-Linked Maintenance Work Orders
Tracks whether higher substitution is generating more burner, feeder, or handling system work orders than the fuel cost savings justify.
04
Number of Active Fuel Streams
Industry practice recommends a minimum of three different alternative fuel sources at target TSR to reduce supply disruption risk.
05
Kiln Shell Temperature Stability
A direct, fast-reacting indicator of whether the current fuel blend is shifting the combustion zone away from its design position.
Scaling Up Safely
The Staged Path From 10% to 40%+ TSR
Plants that scale alternative fuel use successfully follow a staged approach rather than jumping straight to a target percentage. Each stage has a different dashboard priority, and trying to track the wrong metrics at the wrong stage is a common reason substitution programmes stall.
Stage
TSR Range
Dashboard Priority
Typical Action
Trial
5–10%
Stack emissions, shell temperature, torque variation
30-day trials with stack testing at 7, 14, 30-day intervals
Ramp-Up
10–25%
Free lime stability, blend ratio per fuel stream
5% increments with minimum 2-week stabilisation between steps
Reliability
25–35%
Supply chain diversity, AF-specific equipment PM
Minimum three AF sources, predictive maintenance on feed systems
Optimisation
35%+
Automated blending, real-time kiln thermal feedback
Continuous control loop between fuel feed and burner settings
Most TSR programmes stall not from lack of ambition, but from lack of visibility into the stage they're actually in. Build the dashboard that matches your stage.
Frequently Asked Questions
Fuel Substitution Rate Dashboards
What data sources feed a real-time TSR dashboard?
A working TSR dashboard typically pulls from fuel weighing and feed rate systems, calorific value testing results, the DCS or SCADA layer for kiln thermal data, and the maintenance system for any equipment events affecting fuel feed. OxMaint connects to belt sensors, moisture analyzers, and feed system data to calculate live thermal contribution by fuel type rather than waiting for end-of-month fuel consumption reconciliation, which is the source of most reporting lag described in
this alternative fuels operational guide.
Why does my reported TSR not match what operations feels like on the ground?
This mismatch almost always comes from a timing or boundary problem in how the number is calculated, not from an error in the underlying fuel data. Monthly TSR reports average out daily and shift-level swings that operations staff actually experience in real time, so a week of strong substitution can be masked by a week of forced reduction due to a supply gap or quality issue. Calculating TSR at the shift level rather than only monthly, and tracking it against the specific fuel streams active at that time, closes most of this gap.
How many alternative fuel sources should a dashboard track simultaneously?
Industry guidance recommends maintaining a minimum of three distinct alternative fuel sources once a plant approaches its target thermal substitution rate, specifically to reduce the risk of a single supply disruption forcing a sudden drop back to fossil fuel. A dashboard built around tracking only one or two fuel streams will struggle to show this risk clearly, since the real exposure is concentration in any one source rather than the aggregate substitution percentage. Tracking percentage contribution and supply consistency per individual fuel stream, not just the combined total, is what actually protects the substitution rate over time.
Can a TSR dashboard help justify alternative fuel infrastructure investment to plant management?
Yes, and this is often the most practical use of the data beyond day-to-day operations. A dashboard that links TSR progress to specific fuel cost savings, maintenance work order volume, and energy consumption trends turns an abstract sustainability target into a financial case that plant management and finance teams can evaluate directly. Showing the stage-by-stage cost and savings pattern, rather than only the current percentage, is generally more persuasive than the TSR number on its own.
Does increasing TSR always reduce fuel cost, or can it increase maintenance cost instead?
Increasing TSR generally reduces fuel cost because alternative fuels are typically cheaper per unit of energy than coal or petcoke, but the maintenance side of the equation depends heavily on how well the transition is managed. Poorly managed substitution increases can raise wear on feed systems, burner components, and refractory, partially or fully offsetting the fuel savings if those costs are not tracked. A dashboard that shows fuel savings and AF-linked maintenance cost side by side is the only way to confirm the net financial outcome is actually positive.
OxMaint · AI Analytics & Reporting
Stop Waiting for the Monthly Fuel Report to Find Out What Happened.
See your thermal substitution rate, fuel blend, and the maintenance signals connected to it — updated as your kiln runs, not weeks after.