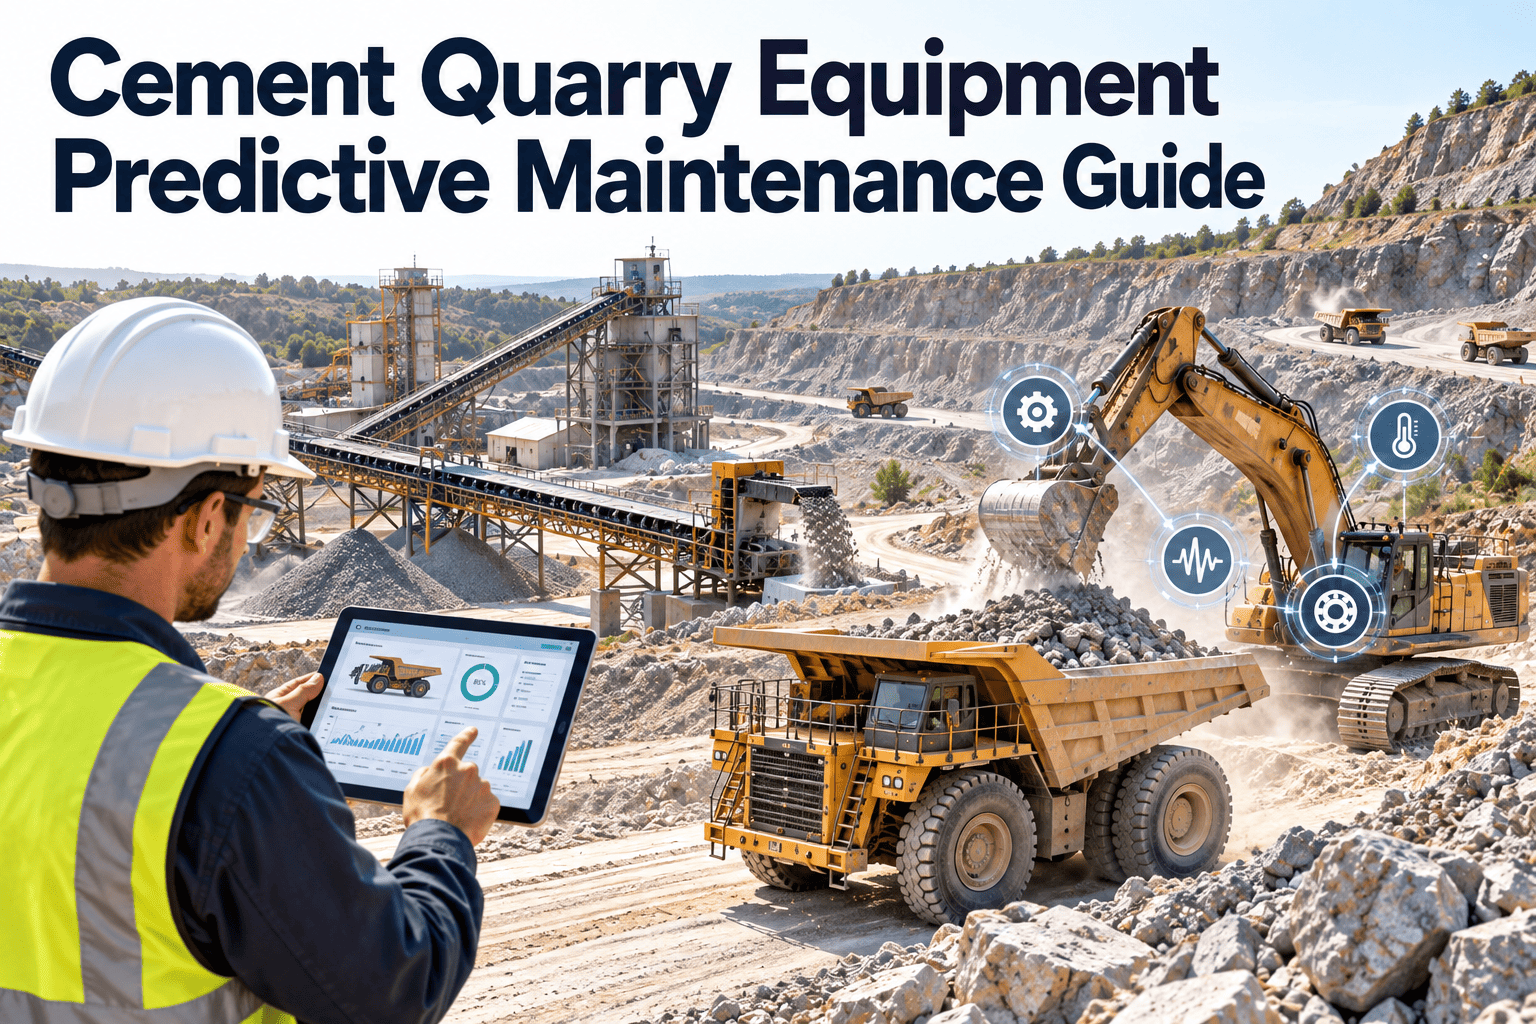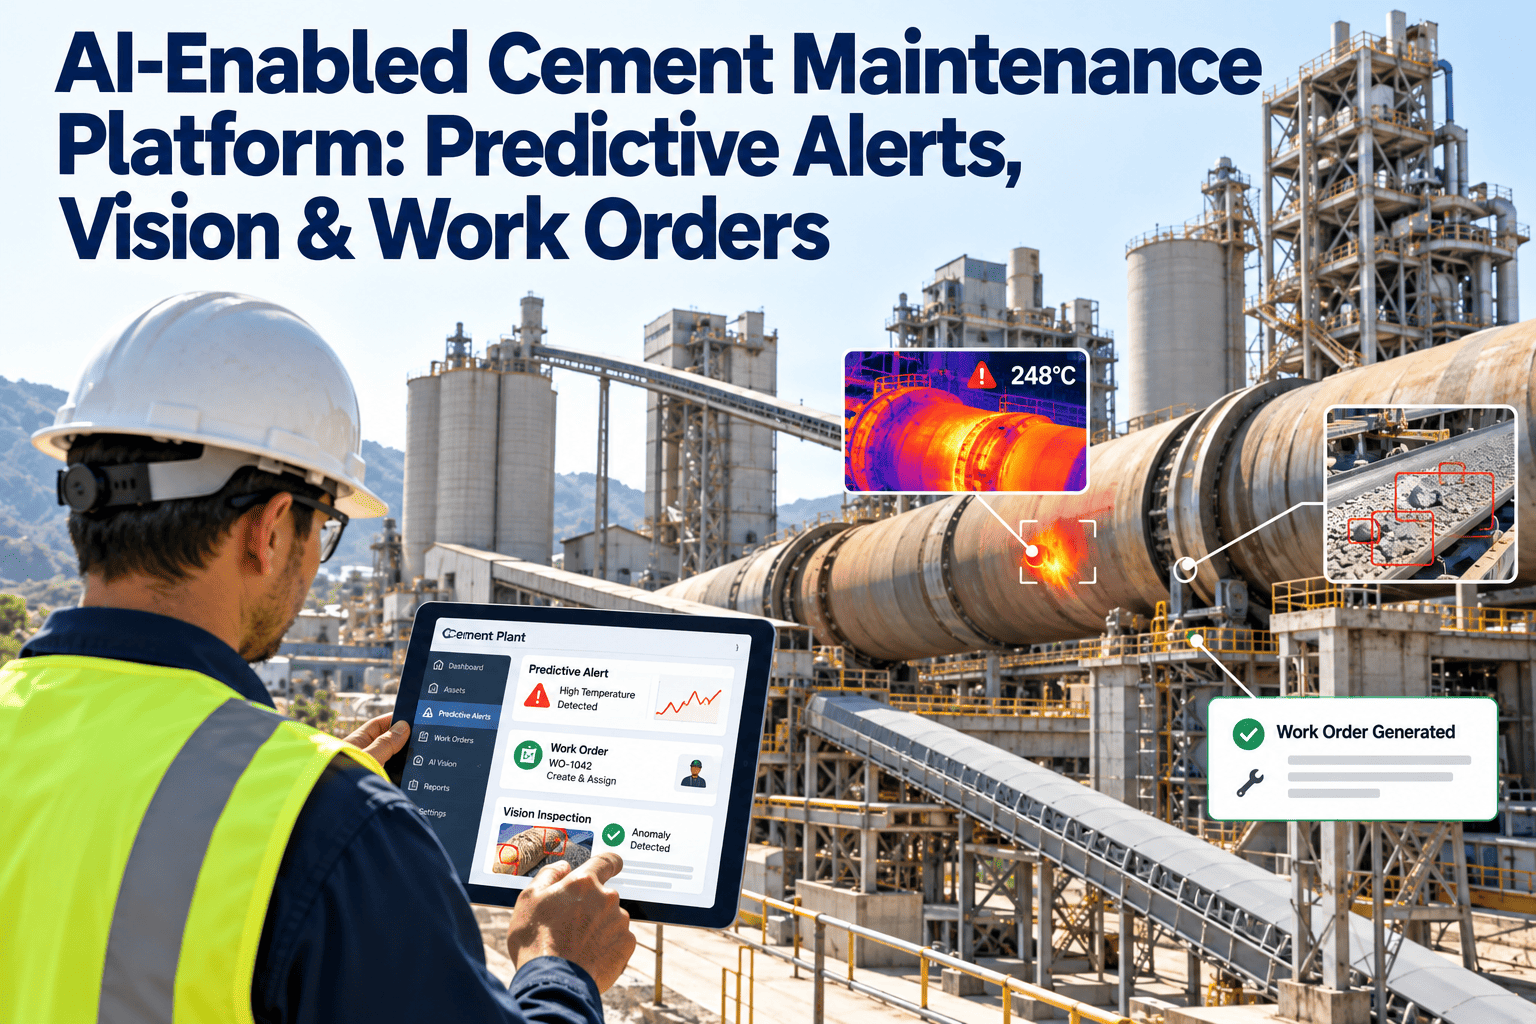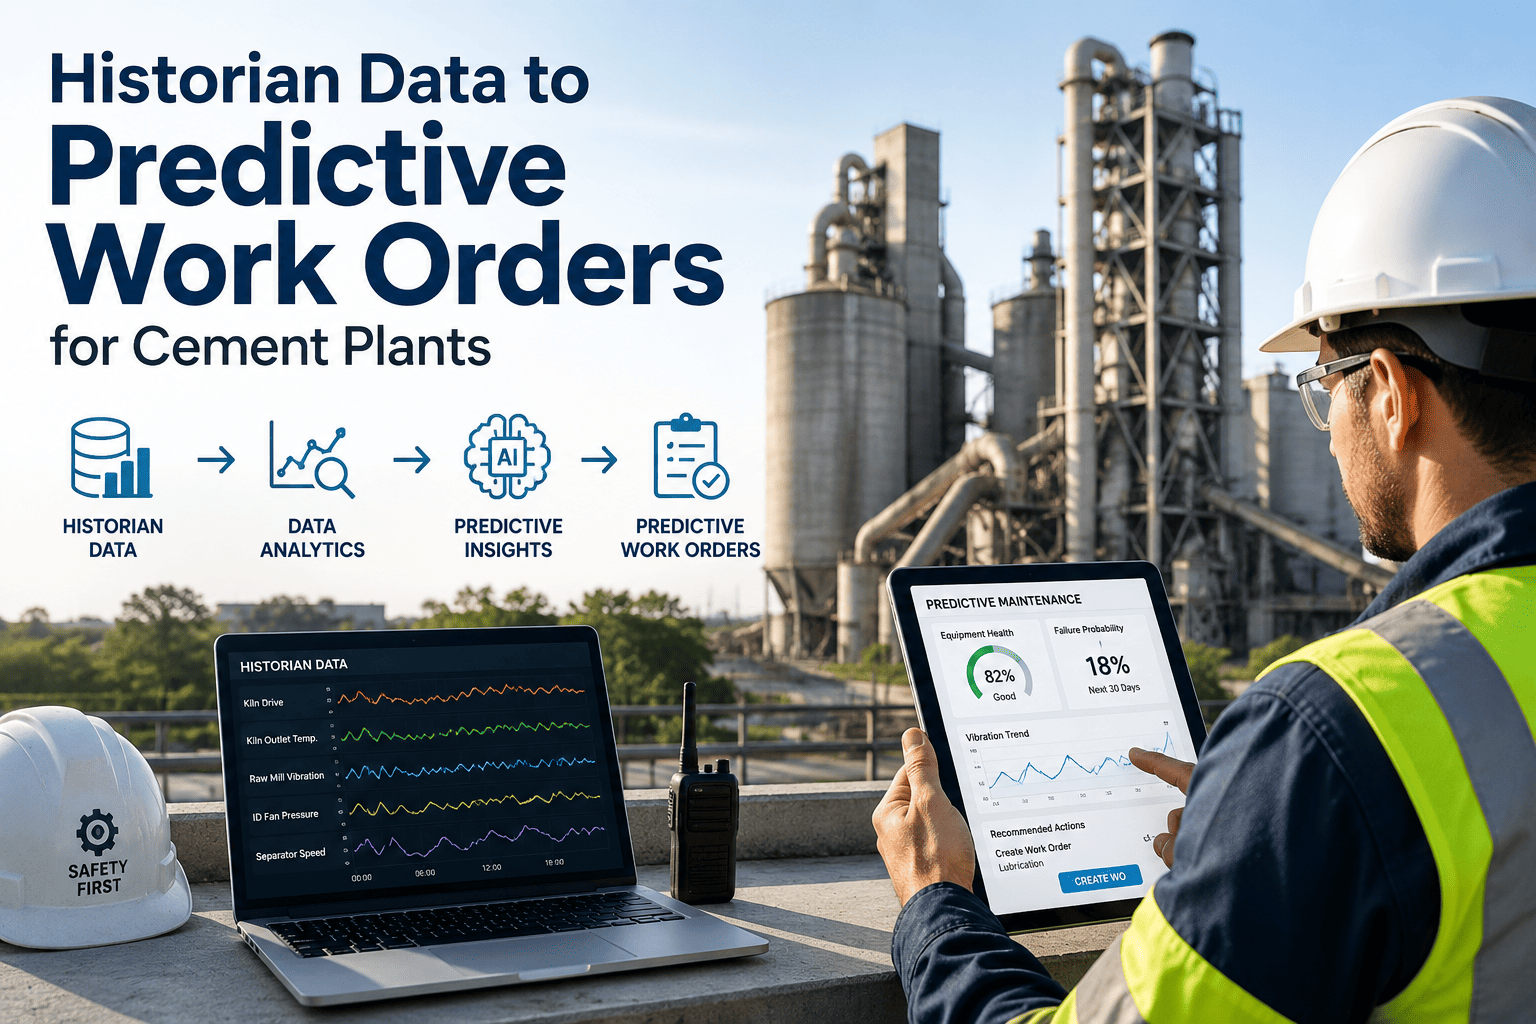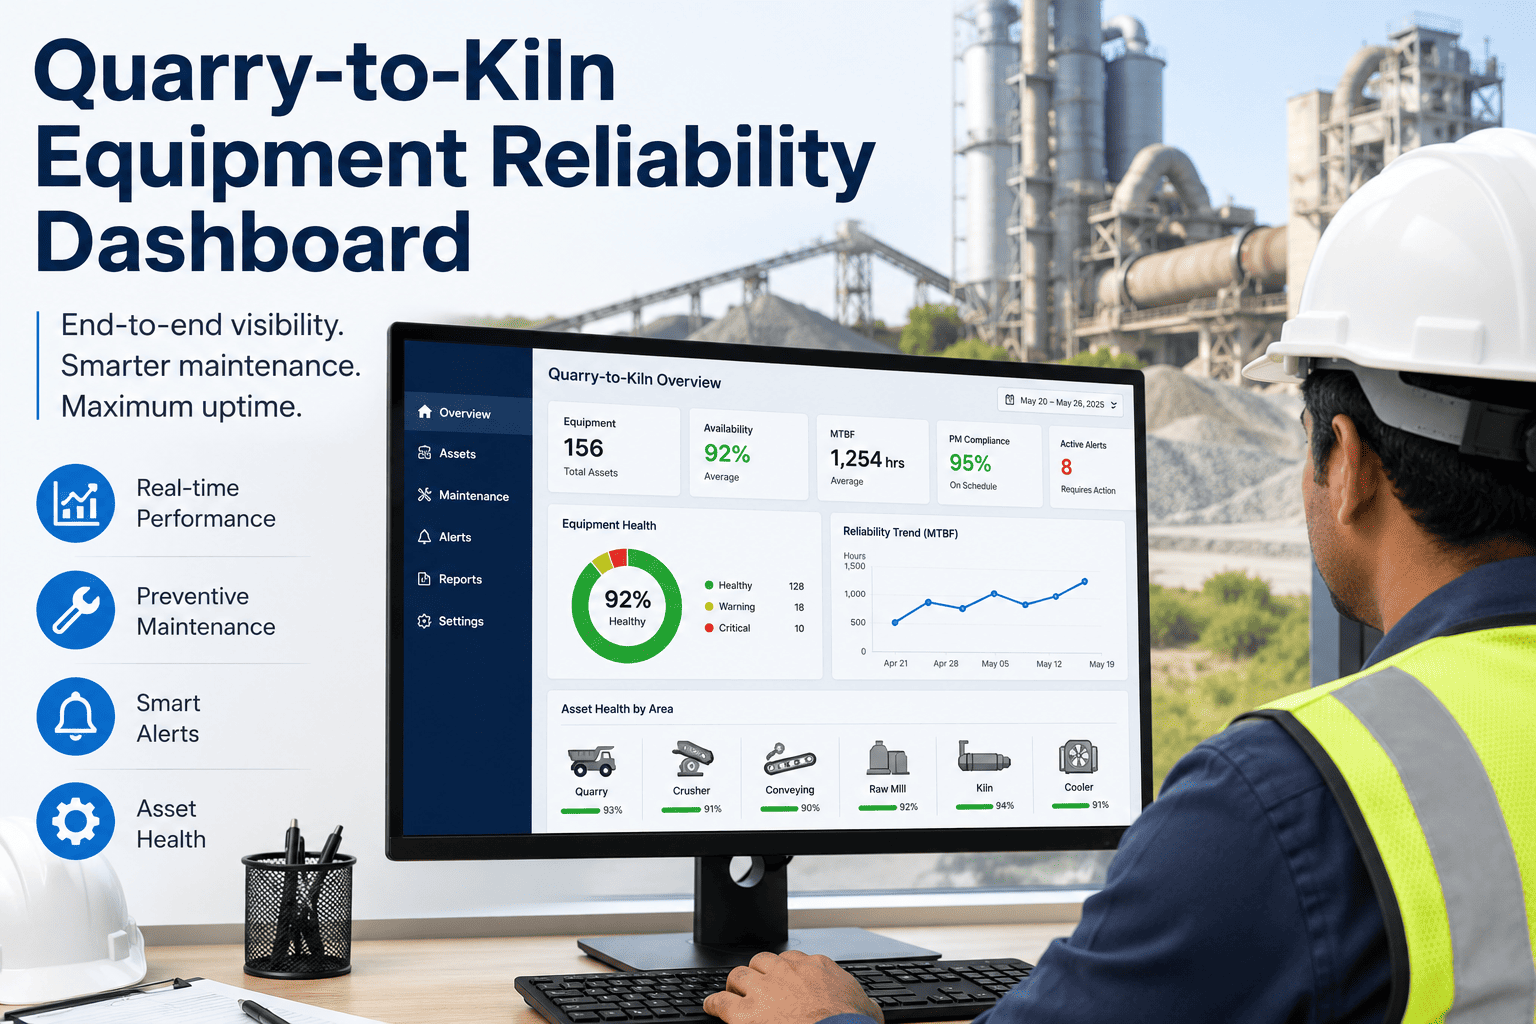
Raw material travels a long way before it becomes clinker — out of the quarry face, through primary and secondary crushing, across kilometres of conveyor, into the raw mill, and finally into the kiln feed system. Every one of those stages has its own equipment, its own failure modes, and in most plants, its own disconnected spreadsheet or SCADA screen. A crusher liner wearing out and a conveyor idler running hot rarely get looked at side by side, even though either one can starve the kiln within hours. Sign in to OxMaint to bring the full quarry-to-kiln chain onto one reliability dashboard.
The Fragmentation Problem
Why Reliability Data Breaks Down Across The Material Chain
Quarry Data Lives With The Mine Team
Excavator hours, haul truck condition, and drill rig status are tracked by a fleet team that rarely talks to plant maintenance, even though a quarry breakdown directly limits feed to the crusher.
Crusher And Conveyor Sit In SCADA, Not CMMS
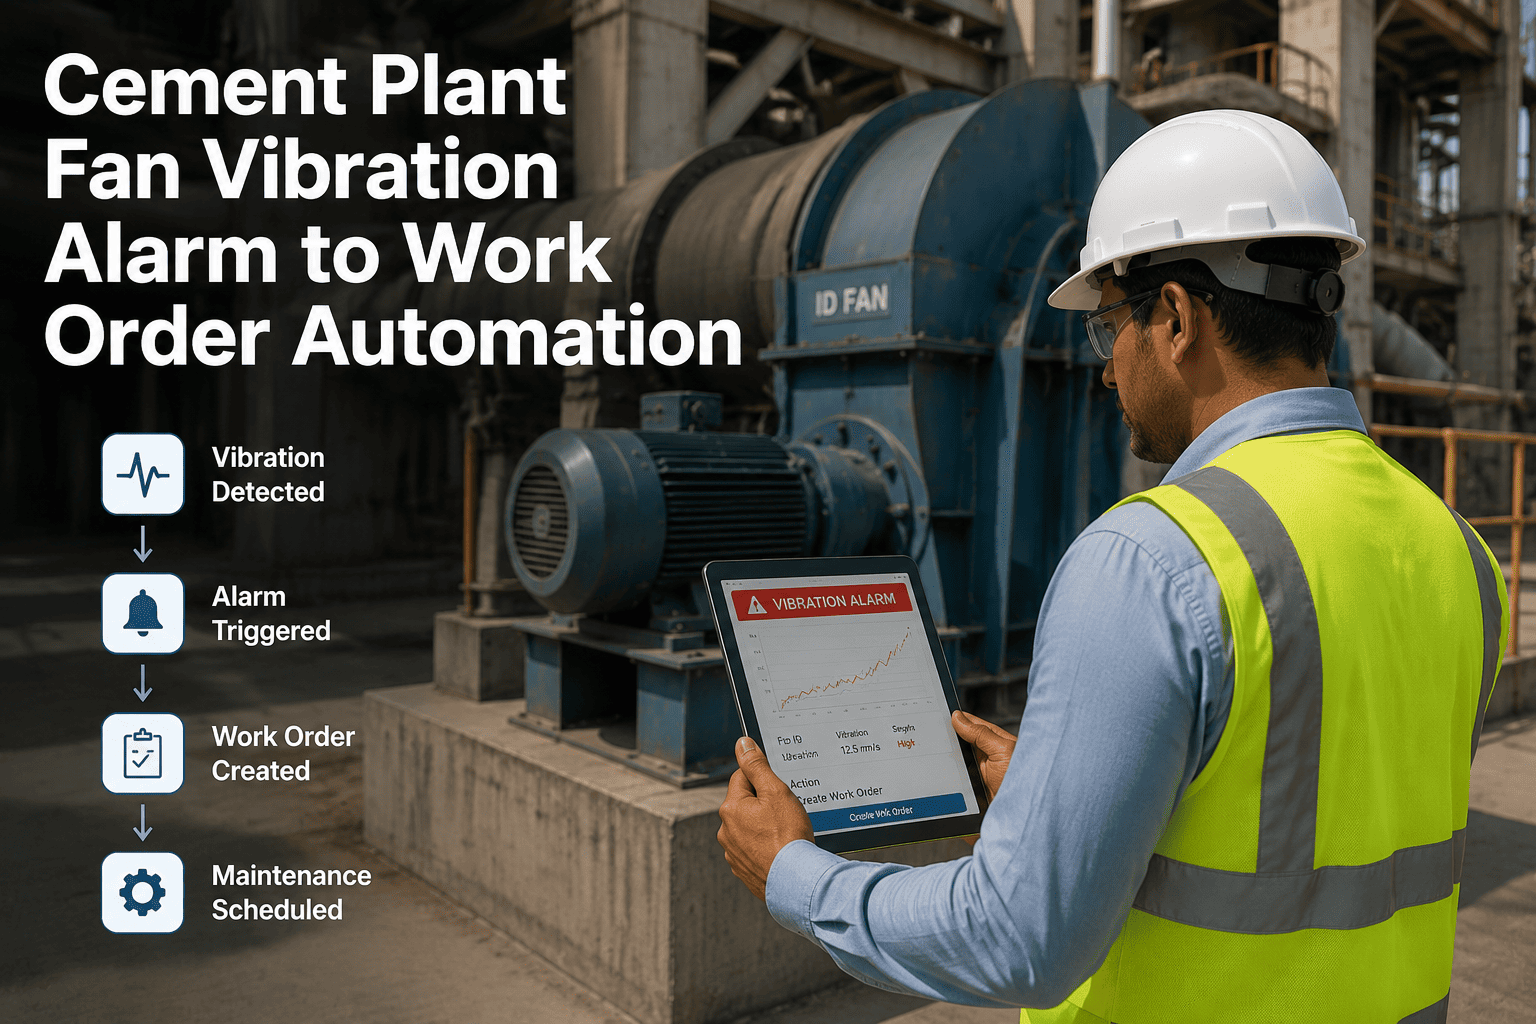
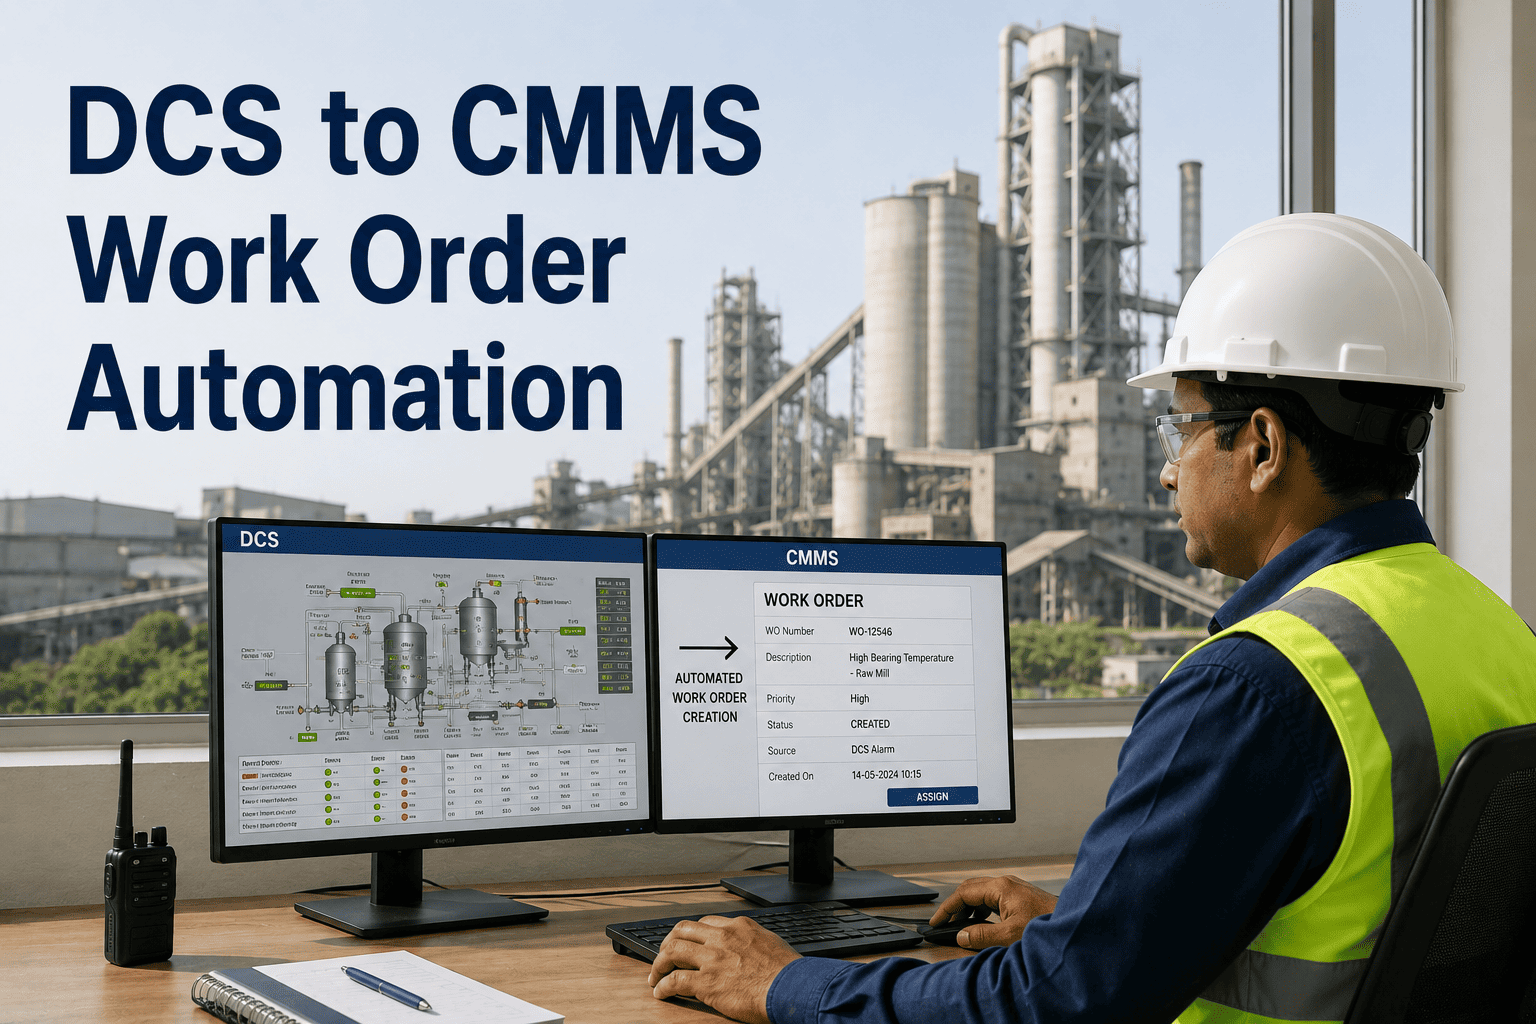
Vibration and current draw values exist on a control room screen, but they rarely connect automatically to a work order or a maintenance planner's queue.
Raw Mill Condition Is A Separate Report
Gearbox oil analysis and bearing trend reports are compiled by a reliability engineer on a monthly cycle, long after an early warning signal first appeared.
No One Sees The Whole Chain At Once
A planner scheduling kiln feed cannot see, in one view, that the quarry loader is due for service, the crusher bearing is trending hot, and a conveyor idler alert is open — all at the same time.
The Reliability Chain
One Dashboard Across Every Stage From Quarry To Kiln
Quarry
Excavator And Haul Truck Health
Crushing
Bearing Temp, Liner Wear, Motor Load
Conveying
Idler Health, Belt Alignment
Raw Mill
Gearbox Vibration, Oil Condition
Kiln Feed
Buffer Level, Feed Continuity
A single stall anywhere in this chain cascades forward. OxMaint tracks reliability at every node so a planner sees the weak link before it stalls the kiln, not after.
See Every Stage Of Your Material Chain On One Screen
OxMaint's AI analytics pulls quarry fleet condition, crusher and conveyor health, and raw mill trends into a single reliability dashboard, so kiln feed risk is visible days before it becomes a stoppage.
What The Dashboard Tracks
Key Metrics Pulled Into The Reliability Dashboard
| Metric | Chain Stage | Data Source | Refresh Rate |
|---|---|---|---|
| Equipment Availability | Quarry Fleet | Fleet telematics, work order history | Daily |
| Bearing Temperature Trend | Crusher | IoT sensor, SCADA | Continuous |
| Idler And Belt Alignment | Conveyor | IoT sensor, AI vision | Continuous |
| Gearbox Vibration Signature | Raw Mill | Vibration sensor, oil analysis lab | Continuous to weekly |
| Kiln Feed Buffer Level | Kiln Feed | Process historian, DCS | Continuous |
A Day With The Dashboard
How A Planner Uses The Reliability View
At the morning review, the planner opens the dashboard and sees a crusher bearing trending into the alert tier, a quarry loader flagged for a due service, and every conveyor showing green. Instead of three separate conversations with three separate teams, the planner sees the full picture in one screen, ranks the crusher bearing as the higher risk to kiln feed continuity, and schedules that repair for the afternoon maintenance window while the loader service is booked for the following day without disrupting quarry output.
What Changes For Each Team
The Impact Of A Shared Reliability View
For Reliability Engineers
Condition trends across quarry, crusher, conveyor, and mill are ranked by risk to kiln feed, not just by asset criticality alone
Recurring failure patterns across the chain become visible from history, not from memory of past incidents
Reports for leadership pull directly from the dashboard instead of being assembled manually from four systems
For Plant And Production Managers
Kiln feed risk is visible days ahead, giving production planning time to adjust before an unplanned stop
Maintenance spend across the material chain is tracked in one place, supporting budget decisions with real data
Cross-team coordination between quarry, maintenance, and production improves because everyone is looking at the same numbers
Reliability Team Experience
What Changed With A Single Chain-Wide Dashboard
Before this, I was pulling three different reports every Monday just to understand where the weakest point in our material chain was that week. Now it is one screen, updated continuously, and it has already caught two situations where a crusher bearing and a conveyor idler were both trending toward trouble at the same time. We would have missed the connection between them without seeing both on the same dashboard.
Plant Reliability Manager
Integrated Cement Plant, Quarry And Raw Material Handling
What Gets Missed
Failure Points A Fragmented View Lets Slip Through
Compounding Risk Across Stages
A crusher bearing trending hot and a conveyor idler trending hot at the same time is a bigger kiln feed risk than either alone, but that link is invisible across separate systems.
Quarry Equipment Downtime Ripple
A haul truck or loader out of service reduces feed to the crusher long before the crusher itself shows any sign of a problem.
Delayed Root Cause Analysis
Without a shared timeline, it can take weeks to notice that repeated crusher stoppages line up with a specific quarry haul route or feed pattern.
Budget Decisions Made On Incomplete Data
Capital requests for upgrades get built on whichever team's data is easiest to pull, rather than the full chain-wide reliability picture.
Alert Response Matrix
How Dashboard Alerts Route To The Right Team
| Chain Stage | Alert Trigger | Routed To | Typical Response Time |
|---|---|---|---|
| Quarry Fleet | Service due or fault code raised | Quarry maintenance team | Within 48 hours |
| Crusher | Bearing temperature or vibration threshold | Crusher maintenance crew | 1 to 3 weeks |
| Conveyor | Idler heat or belt drift threshold | Conveyor maintenance crew | 24 hours to 1 week |
| Kiln Feed | Buffer level below safe threshold | Production planning and shift lead | Immediate |
Weekly Reliability Review
How A Reliability Engineer Uses The Trend View
Each week, the reliability engineer reviews the trend view across all five chain stages rather than pulling separate reports from the quarry, crusher, and mill teams. A pattern emerges: crusher bearing alerts have clustered on Tuesdays for three weeks running, which lines up with a specific haul truck route feeding harder rock on that day. That connection, invisible in any single system, becomes the basis for a haul route adjustment that reduces bearing stress without any equipment change at all.
Common Questions
What Cement Plant Teams Ask About The Reliability Dashboard
Does the dashboard need every stage on IoT sensors before it becomes useful?
No. OxMaint can combine sensor data where it exists with manual inspection entries and work order history where it does not, so a plant can start with partial sensor coverage and expand it stage by stage over time. Sign in to see the dashboard with your current data sources.
Can quarry fleet data from a separate telematics system feed into this dashboard?
Yes. OxMaint connects to most fleet telematics platforms through REST API integration, pulling equipment hours, fault codes, and service due dates into the same reliability view as your fixed plant assets. Book a demo to review your specific telematics integration.
How does the dashboard decide which risk to show first when several assets are trending at once?
OxMaint ranks open alerts by proximity to failure and by how directly that asset threatens kiln feed continuity, so a crusher bearing that could stall raw material flow ranks above a lower-impact issue elsewhere in the chain, even if both are technically at the same alert tier. Sign in to review your current risk ranking configuration.
Can different teams see different views of the same dashboard?
Yes. Quarry supervisors, crusher and conveyor maintenance leads, and plant managers can each be given a filtered view focused on their area, while leadership retains the full chain-wide picture for planning and reporting purposes. Sign in to configure role-based dashboard views.
Is historical reliability data preserved when a new sensor or asset is added to the chain?
Yes. Every asset carries its own condition history from the moment it is added, and the dashboard continues to build a longer trend line for that asset over time, which improves the accuracy of failure prediction the longer OxMaint runs on your equipment. Book a demo to see historical trend tracking in action.
Stop Managing Quarry-To-Kiln Reliability In Four Separate Systems
Bring quarry fleet condition, crusher and conveyor health, and raw mill trends into one dashboard, so the whole chain that feeds your kiln is visible on a single screen, every day.