Cement plants track plenty of numbers, yet many reliability teams struggle to connect them. OEE looks fine while a kiln trips every few weeks, or availability is high because repairs are fast but failures are frequent. A KPI tree solves this by showing how OEE, availability, MTBF and MTTR relate, and which maintenance action moves each one. This guide builds that tree for a cement plant, with definitions, formulas and data requirements you can apply to kilns, mills, fans and packing lines. To collect the underlying failure and repair data cleanly, you can start using Oxmaint as your maintenance record.
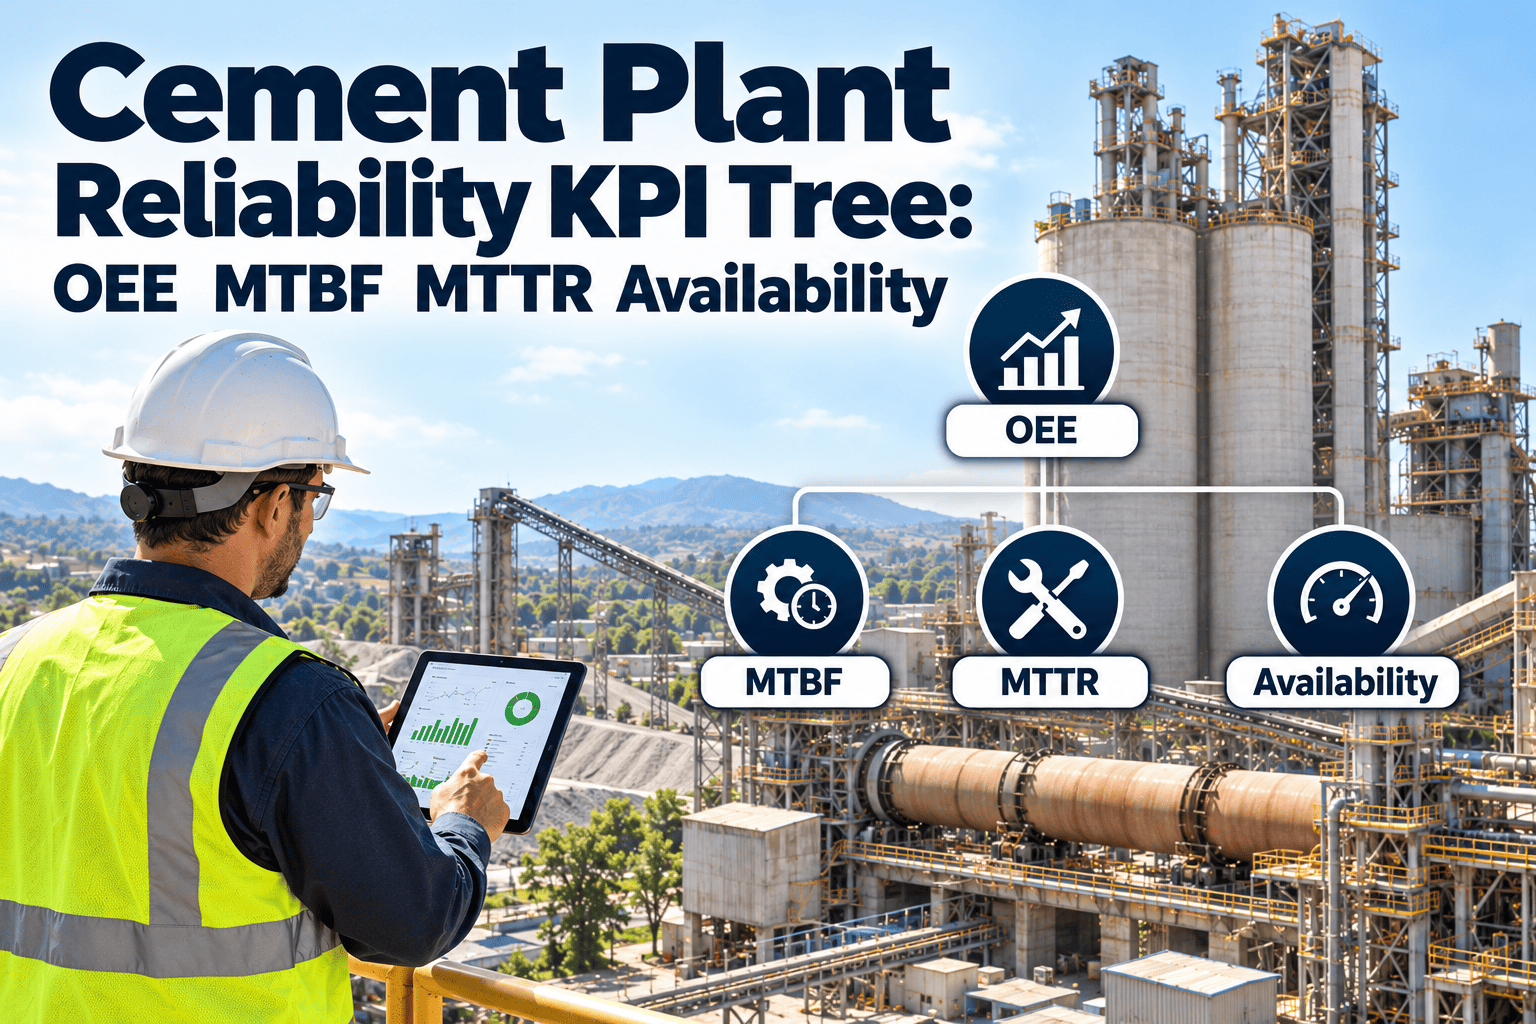
Cement Plant Reliability KPI Tree: OEE, MTBF, MTTR and Availability
See how plant-level OEE breaks down into availability, performance and quality, and how failure frequency and repair time drive availability.
OEE
Availability
Performance
Quality
MTBF
MTTR
Planned stops
The four core definitions
Availability
Run time divided by planned production time
Shows how much of the scheduled time the asset was actually able to run.
MTBF
Operating time divided by number of failures
Measures how often an asset fails. Higher is better.
MTTR
Total repair time divided by number of repairs
Measures how quickly the asset is returned to service. Lower is better.
OEE
Availability multiplied by performance multiplied by quality
Combines losses from stops, slow running and off-spec output.
Inherent availability can be estimated as MTBF divided by the sum of MTBF and MTTR, so both failure frequency and repair duration matter.
Adapting OEE to a continuous cement process
OEE comes from discrete manufacturing, so cement plants need clear rules before the number means anything. Agree these definitions and document them.
| Component | Cement interpretation | Decision to make |
|---|---|---|
| Availability | Kiln or mill running versus planned running time | Whether planned shutdowns and market stops count as loss |
| Performance | Actual output rate versus design or demonstrated rate | Which reference rate to use for each product or mode |
| Quality | On-spec clinker or cement versus total output | How to treat reprocessed or downgraded material |
| Scope | Equipment, line or whole plant | Where the bottleneck sits, usually the kiln or a grinding circuit |
Because the kiln is the heart of the plant, kiln-line OEE is often the headline figure, while mills and packing are measured against their own constraints.
Expanding the tree below availability
Failure frequency, MTBF
- Preventive maintenance compliance
- Quality of lubrication and cleaning
- Condition monitoring coverage
- Root cause elimination of repeat failures
- Operating practice and process stability
Repair time, MTTR
- Fault diagnosis speed
- Spare parts availability and criticality ranking
- Work order planning and job preparation
- Crew skills, tools and access equipment
- Permit, isolation and handover delays
Planned stops
- Shutdown scope accuracy
- Planned versus actual duration
- Emergent work found during the stop
- Restart success without early failures
- Alignment of maintenance with market demand
Measure reliability from clean maintenance data
Failure codes, repair times and downtime durations are the raw material for every KPI in the tree. Capture them once, consistently.
Reading the KPIs together
Each metric hides something on its own. The combination tells you which kind of problem you have.
| MTBF | MTTR | Availability | Likely situation | Priority action |
|---|---|---|---|---|
| Low | Low | Moderate | Frequent minor failures fixed fast | Root cause analysis and preventive work |
| High | High | Moderate | Rare but long failures | Spares strategy and job planning |
| Low | High | Low | Chronic reliability problem | Criticality review and major improvement plan |
| High | Low | High | Healthy asset | Sustain routines and optimise cost |
Data you need before the numbers are trusted
1
A clean asset hierarchy
Plant, line, equipment and component, so failures roll up correctly.
2
Failure and downtime codes
Consistent causes, effects and categories, agreed with operations.
3
Accurate start and end times
Time of failure, start of repair and return to service recorded separately.
4
Operating hours or throughput
Run time from the control system, so MTBF uses real operation, not calendar time.
5
Disciplined work order closure
Failure cause and action captured when the job closes, not weeks later.
Supporting indicators around the tree
PM compliance
Preventive tasks completed on time
Planned work ratio
Planned versus reactive labour hours
Backlog age
Open work orders by criticality and age
Repeat failures
Same failure mode on same asset
Schedule compliance
Planned jobs completed in the window
Stock-outs
Jobs delayed by missing parts
Cement-specific pitfalls
Counting kiln trips as one event
A trip can hide several root causes. Record the initiating failure and the consequences separately.
Mixing process and equipment stops
Refractory, build-up and quality stops need categories that separate them from mechanical faults.
Averages that hide extremes
One very long repair can distort MTTR. Review the distribution as well as the mean.
Comparing unlike assets
Compare kilns with kilns and similar mills with similar mills, and track each against its own trend.
How Oxmaint supports the KPI tree
| KPI input | Oxmaint capability |
|---|---|
| Asset hierarchy and criticality | Asset management with structure and history |
| Failure and repair records | Work orders with causes, labour and timestamps |
| PM compliance | Preventive maintenance scheduling and completion tracking |
| Downtime context | Inspection records and corrective workflows |
| Spares-related delays | Inventory and parts visibility |
| Review and reporting | Dashboards and reports for reliability meetings |
A worked calculation with illustrative numbers
The figures below are invented to show the arithmetic. They are not benchmarks for any plant.
Inputs
A mill ran for 700 hours in a month. It failed 5 times. Total repair time across those failures was 35 hours.
MTBF
700 hours divided by 5 failures
Result: 140 hours between failures.
MTTR
35 hours divided by 5 repairs
Result: 7 hours per repair.
Inherent availability
140 divided by the sum of 140 and 7
Result: about 95 percent.
Halving repair time to 3.5 hours improves availability slightly, but doubling MTBF to 280 hours improves it more. This is why chronic repeat failures deserve root cause work, not only faster repairs.
Choosing the level of measurement
| Level | Useful for | Risk if used alone |
|---|---|---|
| Plant | Management reporting and strategic targets | Averages hide which assets cause losses |
| Production line | Kiln line, cement grinding or packing comparisons | Shared equipment effects can be unclear |
| Equipment | Maintenance planning and reliability analysis | Too many numbers without prioritisation |
| Component | Root cause and parts strategy for bearings, drives or liners | Needs disciplined failure coding to be reliable |
Ranking assets by criticality before ranking KPIs
Not every asset deserves the same measurement effort. A simple criticality ranking decides where MTBF and MTTR matter most.
Class A: critical
- Stops the kiln or main production
- Long repair or replacement time
- Safety or environmental consequence
- Examples: kiln drive, ID fan, main mill drive
Class B: important
- Reduces output or quality
- Some redundancy or workaround exists
- Moderate repair time
- Examples: separators, cooler fans, conveyors with standby
Class C: general
- Limited production effect
- Easy to repair or replace
- Run to failure may be acceptable
- Examples: lighting, minor pumps, non-critical conveyors
Review cadence for each KPI layer
| Frequency | Forum | Focus |
|---|---|---|
| Daily | Production and maintenance meeting | Stops, open breakdowns, next 24-hour jobs |
| Weekly | Reliability review | Repeat failures, PM compliance, backlog by criticality |
| Monthly | Management review | Availability, MTBF, MTTR and OEE trends by line |
| Quarterly | Improvement review | Root cause projects, spares policy, shutdown lessons |
| Annually | Budget and strategy | Asset renewal, targets and resource planning |
From a falling KPI to an improvement action
1
Find the loss
Rank downtime by asset and failure cause to see where hours are actually lost.
2
Separate frequency from duration
Decide whether the issue is many short failures or a few long ones.
3
Investigate the cause
Use inspection history, failure codes and operator notes to find recurring patterns.
4
Choose the response
Options include preventive tasks, condition monitoring, design changes, spares or training.
5
Verify the result
Check whether MTBF, MTTR or planned stop duration improved after the change.
Using the tree around planned shutdowns
Before the stop
Use failure history and open findings to build scope and set realistic duration targets.
During the stop
Track planned versus actual hours and emergent work, because these shape future availability.
At restart
Record early-life failures separately so repair quality can be assessed.
After the stop
Compare MTBF in the following months with the previous period for the repaired assets.
A failure coding scheme that supports MTBF and MTTR
KPI quality depends on failure data quality. A short, consistent coding scheme beats a long list that nobody uses correctly.
| Code layer | Purpose | Examples for cement equipment |
|---|---|---|
| Asset | Where the failure happened | Kiln drive, ID fan, cement mill gearbox, packing machine |
| Failure mode | How it failed | Bearing overheating, seal leak, blocked chute, trip, wear-out |
| Cause | Why it failed | Lubrication fault, contamination, overload, wear, operating error |
| Detection | How it was found | Operator round, alarm, inspection, breakdown |
| Action | What was done | Replaced, adjusted, cleaned, reset, temporary fix |
| Impact | Effect on production | Kiln stop, reduced load, no production loss |
Who should see which KPI
Operators
Open abnormalities, round completion and current equipment limits
Technicians
Assigned work orders, asset history and repeat failures
Planners
Backlog by criticality, schedule compliance and parts delays
Reliability engineers
MTBF, MTTR and failure cause analysis by asset class
Production managers
Availability, OEE and downtime by line
Plant leadership
Trends, risk areas and improvement project results
Setting targets that are realistic and defensible
1
Establish your own baseline
Use at least several months of clean data per asset class before setting targets.
2
Separate controllable from external causes
Market stops and power outages should be tracked but not counted against maintenance performance.
3
Target the drivers
Set goals for PM compliance, planned work ratio and repeat failures, which you can influence directly.
4
Use ranges, not single numbers
Variation is normal in a continuous plant, so judge trends over several periods.
Connecting reliability KPIs to cost
| KPI movement | Cost effect to estimate | Data source |
|---|---|---|
| Fewer unplanned kiln stops | Lost production margin, restart fuel and refractory stress | Production records and stop log |
| Shorter MTTR | Reduced downtime hours and overtime | Work order timestamps and labour records |
| Higher PM compliance | Fewer emergency repairs and lower parts expediting | Preventive schedule and corrective work cost |
| Fewer repeat failures | Avoided duplicate repairs and parts | Failure codes by asset |
| Better planned work ratio | More efficient labour use and fewer emergency call-outs | Work order types and hours |
Maturity stages of reliability measurement
Stage 1: record
- Breakdowns logged inconsistently
- KPIs calculated manually
- Focus on reporting totals
Stage 2: standardise
- Coding scheme in use
- Work orders closed with causes
- Monthly KPI review
Stage 3: improve
- Root cause projects drive MTBF
- Condition triggers feed planning
- KPIs linked to cost and risk
Questions to ask when a KPI looks wrong
- Are start and end times recorded consistently, or are repairs logged after the fact?
- Is operating time taken from the control system or estimated from the calendar?
- Are failures counted once per event, or once per affected component?
- Do planned stops, market stops and power outages sit in the right categories?
- Has the asset hierarchy changed, so history is split across old and new records?
- Is one extreme event distorting the average for the period?
- Do operators and maintenance agree on what counts as a failure?
- Does the number match what supervisors experienced on the floor?
Trust in KPIs is built by investigating anomalies openly. When crews see that questionable numbers are corrected, they are more willing to record accurate data.
Starting small: a first-quarter plan
Month one
Agree definitions, build the asset hierarchy for the kiln line and one grinding circuit, and introduce the failure coding scheme.
Month two
Capture every failure and repair with timestamps, review data quality weekly and correct habits early.
Month three
Publish the first MTBF, MTTR and availability figures, rank the worst assets and agree two or three improvement actions.
Afterwards
Extend to more assets, add OEE for the lines where rates and quality are tracked, and review targets each quarter.
Frequently asked questions
What is a reliability KPI tree?
A diagram linking top-level results such as OEE to the drivers beneath, like MTBF, MTTR and planned stops.
How are MTBF and MTTR linked to availability?
Availability improves when failures become less frequent or repairs become faster, ideally both.
Which cement assets should be measured first?
Start with the kiln line and the main grinding circuits. Book a demo to plan the rollout.
Is OEE useful for a kiln?
Yes, if you define planned time, reference rate and quality consistently and document the rules.
How do I get reliable failure data?
Use structured work orders with codes. Set them up in Oxmaint.
Build a KPI tree your whole plant can trust
Standardise failure records, repair times and preventive schedules so OEE, MTBF, MTTR and availability tell the same story.