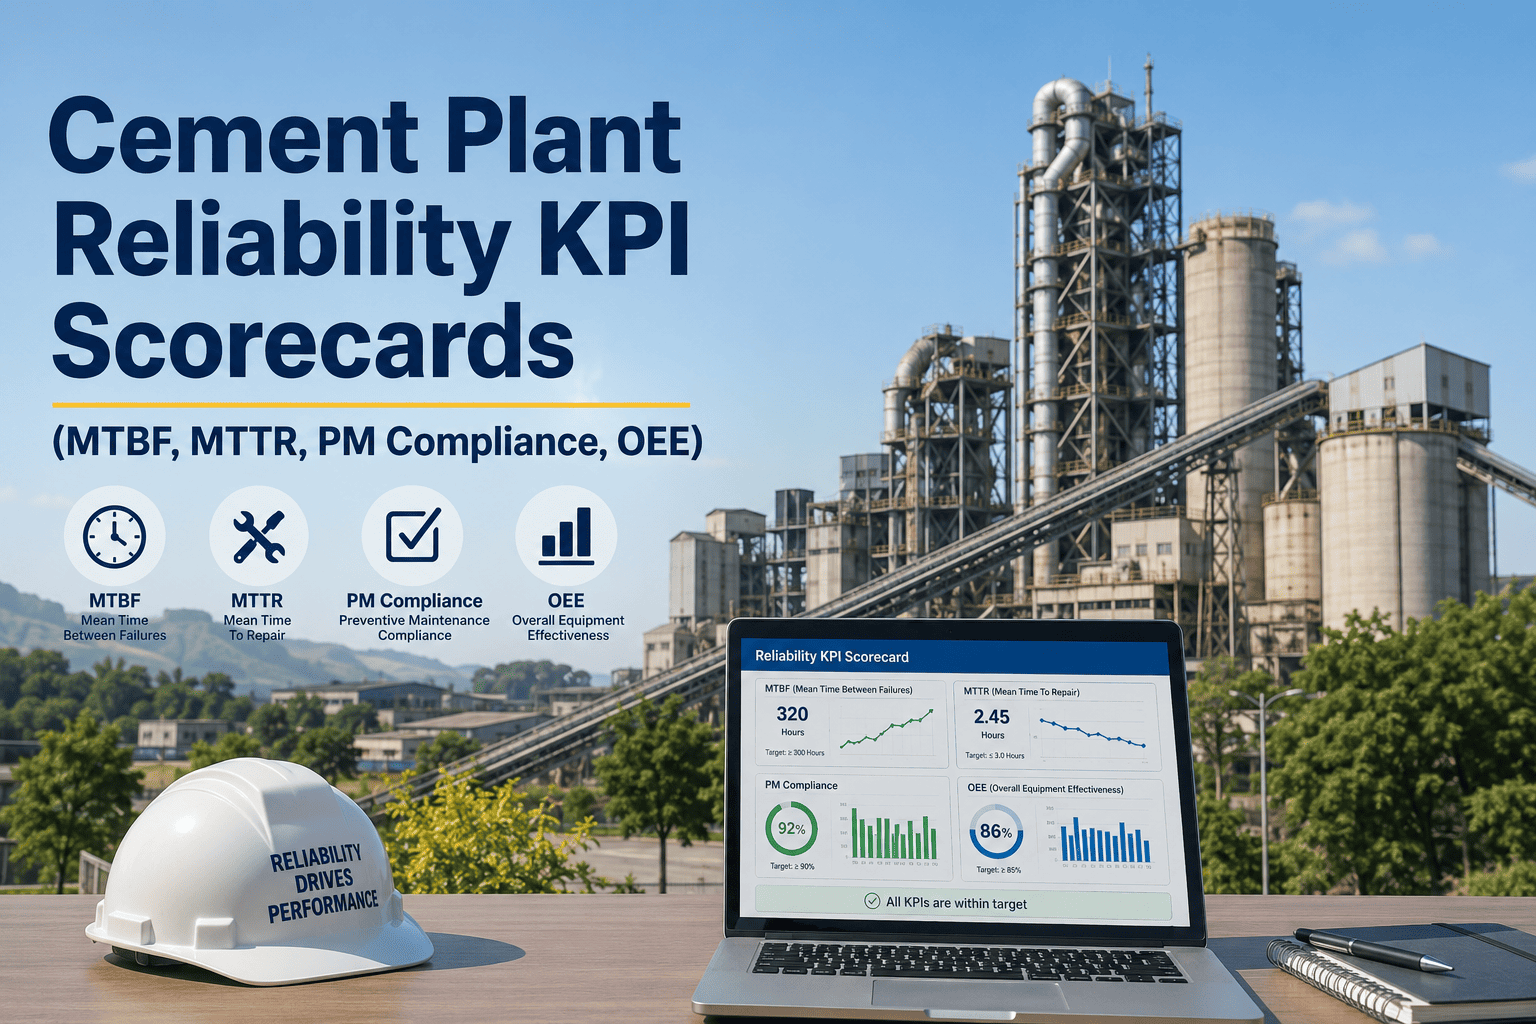
Cement plants run long, capital-intensive process lines where a single kiln, mill or fan stoppage can ripple through clinker, grinding and dispatch. Reliability teams already hold the data to see this coming, but it often sits in shift logs, DCS screens and spreadsheets. A maintenance KPI dashboard turns that into a shared view of MTBF, MTTR and OEE, and a connected cement plant CMMS keeps the numbers tied to real work orders.
Cement Plant Maintenance · KPI Dashboard · MTBF, MTTR and OEE
Top Cement Plant Maintenance KPI Dashboard: MTBF, MTTR and OEE
Measure how often equipment fails, how fast it is restored and how much good production the plant actually delivers, from one maintenance system.
Dashboard layout (illustrative, no live data)
MTBFBy kiln, mills, fans
MTTRBy failure cause
OEEBy production line
PM complianceBy area and crew
The three core KPIs and how to calculate them
MTBF
Operating time divided by number of failures
Shows how reliable an asset is between failures. Rising MTBF suggests failure prevention is working.
MTTR
Total repair time divided by number of repairs
Shows how quickly the team restores equipment. It reflects parts, planning, skills and access, not just effort.
OEE
Availability x Performance x Quality
Shows how much of planned production time yields good output at the intended rate.
Definitions to fix before building the dashboard
- Decide what counts as a failure, such as any unplanned stop or only stops above a set duration.
- Separate planned stops, process stops and equipment failures, so MTBF is not distorted.
- Use the same time basis across lines, either calendar hours or scheduled operating hours.
- Record cause codes at closure, otherwise MTTR cannot be broken down usefully.
Where the KPIs matter on a cement line
| Area | Typical critical assets | KPI to watch most | Why |
|---|---|---|---|
| Quarry and crushing | Crushers, conveyors, feeders | MTTR | Wear parts and blockages make repair speed important |
| Raw grinding | Vertical roller mill, raw mill fan, separator | MTBF | Roller and bearing life drives stoppages |
| Pyroprocessing | Kiln drive, kiln shell support, preheater fans, cooler | OEE and MTBF | Kiln stops cost the most production |
| Cement grinding | Ball or roller mills, gearboxes, separators | OEE | Rate and availability set output |
| Packing and dispatch | Packers, loaders, bag handling | MTTR | Short stops affect truck turnaround |
From raw data to dashboard: the data flow
1. Event captureStops, failures and repairs logged on mobile work orders
2. ClassificationCause, asset, area and failure type chosen at closure
3. CalculationMTBF, MTTR and availability per asset and area
4. ReviewWeekly reliability meeting reads the same dashboard
5. ActionCorrective and preventive tasks generated from findings
Stop building KPI reports by hand
Let work orders, downtime and asset history feed your cement plant dashboard in Oxmaint.
Reading the numbers: what each pattern usually means
Low MTBF, low MTTR
Frequent but quick fixes. Look for chronic minor faults, wear parts and blockages that need a root cause fix.
High MTBF, high MTTR
Rare failures that take long to repair. Look at spares, access, tooling, planning and skills.
Low MTBF, high MTTR
The most costly pattern. Reliability and repair readiness both need attention, starting with critical assets.
High MTBF, low MTTR
A healthy pattern, but check that data is complete and that planned work is not hiding hidden risk.
Supporting KPIs that explain the big three
Work management
- Preventive maintenance compliance.
- Planned versus unplanned work share.
- Backlog age by priority.
- Work order closure quality.
Asset and cost
- Repeat failures by asset and cause.
- Spare parts availability for critical equipment.
- Maintenance cost per tonne of output.
- Condition alarms acted on in time.
Connecting condition data and AI to the dashboard
- Vibration, temperature and motor current data from fans, mills and gearboxes can raise condition alerts that become work orders.
- Analytics can flag assets whose time between failures is shortening, giving planners a reason to review them.
- Predictive signals are only useful when they link to a task, an owner and a closure record.
- Treat AI outputs as decision support for engineers, validated against plant knowledge and inspection results.
Common KPI mistakes in cement plants
Mixing stop typesProcess, market and equipment stops merged together hide the real reliability picture.
Averaging across everythingOne plant-wide MTBF hides the few assets that cause most of the lost production.
No cause codesMTTR without cause detail cannot guide spares or training decisions.
Late data entryTimes typed at shift end are rounded and unreliable, unlike mobile entry at the equipment.
Targets without ownersA KPI no one owns rarely moves, so assign each to an area lead.
A practical weekly review routine
- Open the dashboard filtered to critical assets and last week's unplanned stops.
- Review the top three downtime causes and confirm each has an owner.
- Check overdue preventive tasks on kiln, mills, fans and gearboxes.
- Look at repeat failures and decide which need root cause analysis.
- Confirm spares for planned shutdown work are reserved.
- Record decisions as work orders, not meeting notes.
Oxmaint capabilities behind the dashboard
- Asset hierarchy from plant and line down to equipment and components.
- Preventive maintenance scheduling and inspection checklists on mobile.
- Work orders capturing downtime, cause, parts and labour for accurate KPIs.
- Inventory for critical spares, linked to work orders and shutdown plans.
- Reporting dashboards for MTBF, MTTR, backlog and compliance by area.
- Condition-based workflows that create tasks when readings cross set limits.
Frequently asked questions
What are the main KPIs for cement plant maintenance?
MTBF, MTTR and OEE lead, supported by PM compliance, backlog, repeat failures and spare availability.
Is OEE a maintenance KPI?
Partly. Availability depends on maintenance, while performance and quality involve operations and process teams.
How do I get accurate MTTR?
Log start and finish times on mobile work orders. Oxmaint captures them at the equipment.
Which assets should I track first?
Start with kiln, raw and cement mills, major fans and gearboxes, then widen to feeders and packing.
Can I see a sample dashboard?
Yes. Book a demo to walk through cement KPI reporting.
Setting targets that fit your plant
- Start from your own history. Calculate MTBF, MTTR and availability for the last twelve months by asset group before you set any improvement target.
- Set targets per equipment class. A crusher, a kiln drive and a packing machine have very different failure patterns, so one plant-wide number is rarely useful.
- Agree targets with operations, not only maintenance, since availability and OEE are shared outcomes.
- Review targets after each major shutdown, when asset condition and failure patterns often change.
- Use industry benchmarks only as context. Raw material, fuel mix, plant age and kiln design make direct comparison between sites unreliable.
The three loss categories inside OEE
Availability loss
Stops and breakdowns
Equipment failures, unplanned stops, changeovers and waiting for parts or crews. This is where maintenance has the most direct influence.
Performance loss
Slow running and short stops
Mills or kilns running below design rate because of wear, fouling, blockages or constraints in downstream equipment.
Quality loss
Off-spec output
Clinker or cement outside quality limits, rework or downgraded product, often linked to process stability and equipment condition.
Downtime coding that makes the dashboard useful
| Code level | Example entries | Purpose |
|---|---|---|
| Stop category | Equipment failure, planned maintenance, process, utility, external | Keeps MTBF based on true equipment failures |
| Area and asset | Raw mill, kiln, cooler, cement mill, packer | Shows where losses concentrate |
| Failure mode | Bearing, seal, wear, electrical, control, blockage | Guides spares and root cause work |
| Cause | Lubrication, overload, ageing, operator error, design | Separates repair from prevention |
| Action | Repaired, replaced, adjusted, deferred | Feeds repeat failure review |
Dashboard views for different roles
Plant manager
OEE by line, unplanned downtime trend, maintenance cost per tonne and a short list of top loss contributors.
Maintenance manager
Backlog age, PM compliance, repeat failures, planned versus unplanned work and spare availability.
Area engineer
MTBF and MTTR by asset, open condition alerts, overdue inspections and shutdown job readiness.
Shift supervisor
Open work orders, today's inspection routes, equipment under repair and crews assigned.
Improving MTTR without rushing repairs
- Break MTTR into waiting for diagnosis, waiting for parts, waiting for access or isolation, active repair and restart checks. The largest slice is rarely the repair itself.
- Prepare job plans for repeat repairs on kiln, mill and fan equipment, with steps, tools, parts and safety requirements listed in advance.
- Stock critical spares such as bearings, seals, couplings and drive components based on criticality and lead time, not on habit.
- Use mobile work orders so technicians can view manuals, history and photos at the equipment.
Improving MTBF through prevention
- Review the top repeat failures each month and decide whether each needs a design change, a lubrication change, a tighter inspection or a different spare.
- Build condition-based tasks on critical rotating equipment so alerts trigger inspection before failure.
- Reduce deferred preventive tasks on high-criticality equipment, especially lubrication, alignment and filter changes.
- Track whether failures happen soon after maintenance, which can reveal procedure or workmanship gaps.
Using the dashboard for shutdown planning
- Collect deferred corrective work, condition findings and inspection results into one shutdown scope instead of separate lists.
- Check readiness of parts, permits and contractor resources before the stop begins.
- Record actual duration and findings per job, so the next shutdown plan is based on real data.
- Compare post-shutdown MTBF and OEE trends with the previous campaign to see whether the scope addressed the right problems.
Rolling out the KPI dashboard step by step
- Month one: build the asset hierarchy for critical lines and agree failure and downtime definitions.
- Month two: move work orders and inspections to mobile and enforce cause code entry at closure.
- Month three: publish MTBF, MTTR and backlog views, and start the weekly reliability review.
- Month four onwards: add OEE inputs, condition-based triggers and cost reporting, then refine targets by asset class.
Data quality: the foundation under every KPI
- Incomplete work orders produce misleading MTTR. Make start time, finish time, cause code and parts used required fields at closure.
- Duplicate assets split failure history across several records, which hides repeat problems. Use one controlled naming standard for kilns, mills, fans and conveyors.
- Back-filled data is usually rounded. Encourage entry at the equipment on mobile devices, even when it adds a minute to the job.
- Audit a sample of closed work orders each month and feed the findings back to crews and supervisors.
- Agree who owns each KPI definition, so a number means the same thing in every meeting.
Cement equipment and the failure modes behind the numbers
Kiln drive and rollersGear wear, lubrication issues, alignment and thermal movement affect availability for the whole line.
Vertical roller millsRoller and table wear, hydraulic system faults and vibration limit availability and throughput.
Large fansImbalance, bearing wear and buildup on blades commonly drive stops and performance loss.
GearboxesOil condition, bearing wear and misalignment are common causes of long repair times.
Conveying and elevatorsChain, belt, bucket and idler wear create frequent, short stops that cut OEE.
Packing and loadingMechanical wear and sensor faults hurt dispatch speed even when production is steady.
Questions the dashboard should help you answer
- Which ten assets caused the most unplanned downtime this quarter, and what were the main failure modes?
- Is MTBF improving on critical rotating equipment after lubrication and condition monitoring changes?
- Where is MTTR driven by waiting for parts or access rather than repair work?
- How much maintenance effort goes to planned work versus emergency response, and is that ratio improving?
- Which preventive tasks are overdue on equipment that has recently failed?
- Do OEE losses concentrate in one line, shift or product type?
Cost and risk views that complement reliability KPIs
- Maintenance cost per tonne of clinker or cement helps compare periods, though it should be read with production volume and shutdown timing.
- Criticality ranking links asset importance to downtime impact, safety risk and spare lead time, so improvement effort goes where it matters.
- Spare part inventory value and stock-out incidents show whether critical parts are balanced against cost.
- Contractor and overtime hours can reveal whether planning is keeping up with workload.
How AI and analytics fit into cement KPI reporting
- Trend analysis can highlight assets whose failure intervals are shortening, so engineers review them before the next major stop.
- Pattern detection across work orders can group similar failures, such as repeated bearing replacements on the same fan, for root cause review.
- Condition data from vibration, temperature and motor current adds early warning, but each alert should link to an inspection task and an owner.
- Analytics output supports engineering judgement. Validate it against inspection findings and plant knowledge before changing maintenance strategy.
- Keep the quality of source data high. Any analysis built on incomplete cause codes or missing downtime entries will mislead.
What good looks like after six months
- Critical asset records are complete, with failure history, spares and inspection plans attached.
- Most corrective work orders include cause codes, and the weekly review uses the same numbers across departments.
- Planned work takes a growing share of maintenance effort, and emergency work is reviewed for lessons.
- Shutdown scopes are built from recorded findings, not memory.
Make reliability visible across your cement plant
Track MTBF, MTTR, OEE and PM compliance from the same work orders your teams already close.