Lubrication is one of the cheapest reliability levers in a cement plant and one of the least measured. Kilns, mills, fans, gearboxes and crushers all depend on the right lubricant, in the right amount, applied at the right time, yet many sites track little beyond a greasing round that was ticked off. This guide sets out the lubrication KPIs reliability teams can use to see whether the program is working, how to calculate each one, and which decision it should drive. It also covers how a CMMS such as Oxmaint can hold routes, tasks and results in one record.
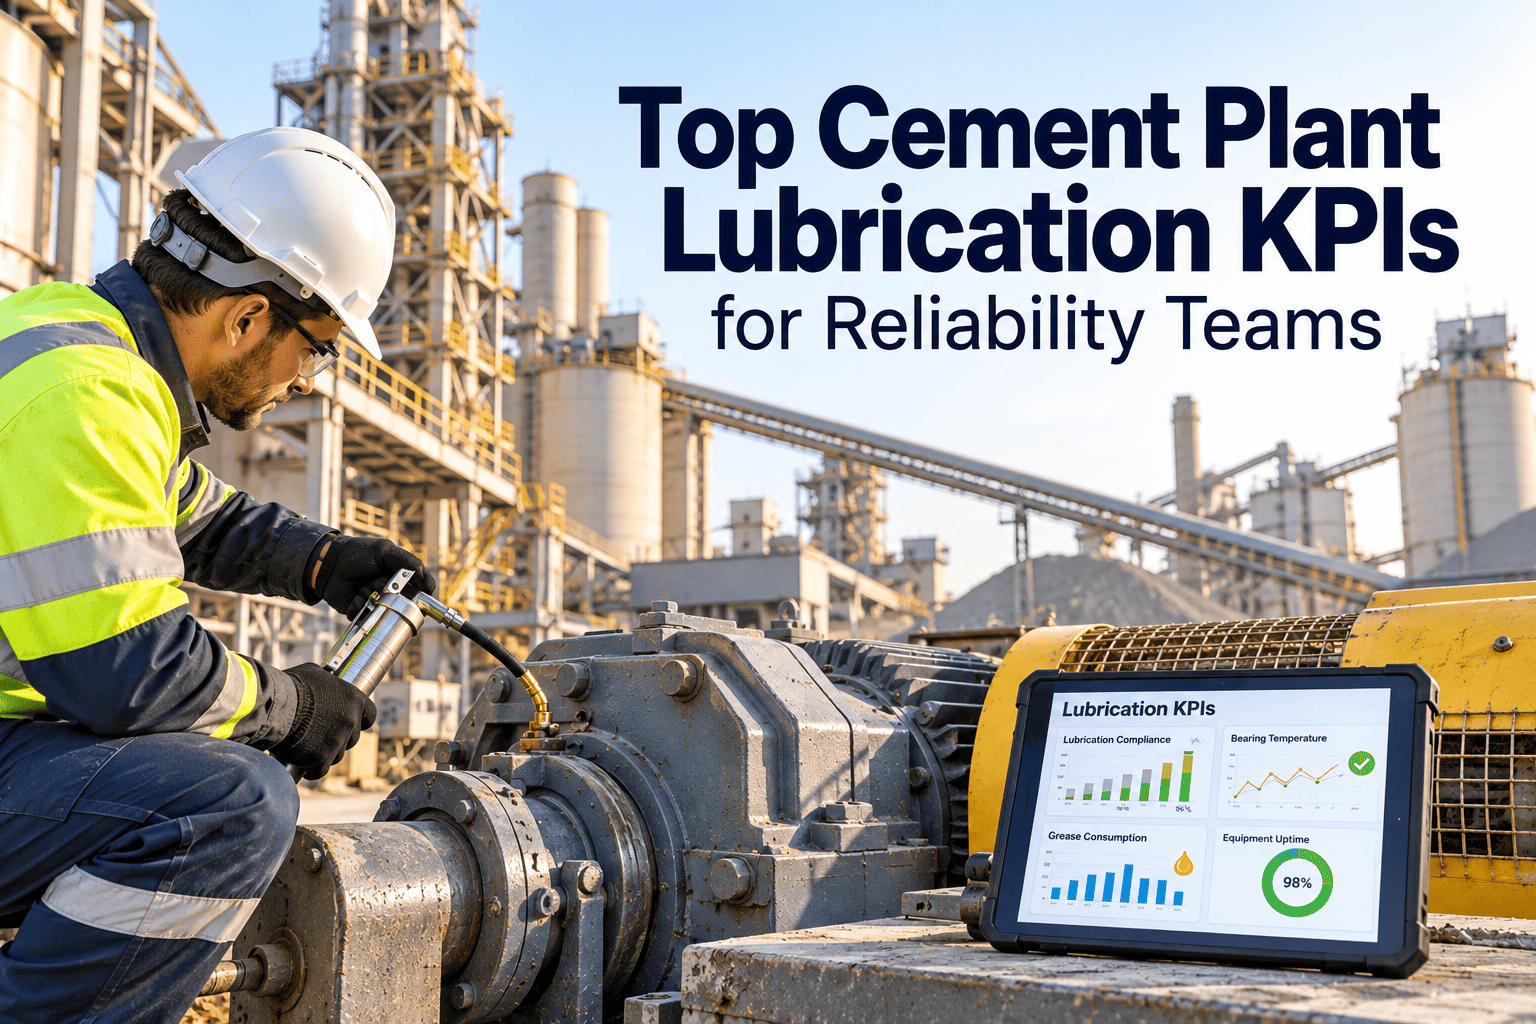
Top Cement Plant Lubrication KPIs for Reliability Teams
A scorecard that links lubrication effort to bearing and gearbox health
Measure compliance, condition and cost together, so lubrication moves from routine chore to managed reliability program.
DoRoute compliance
CheckOil and grease condition
ProveFailures and cost
Three KPI families, one picture
Activity KPIs
Show whether the planned lubrication work is being done on time and correctly.
Condition KPIs
Show whether lubricants and the machines they protect are healthy.
Outcome KPIs
Show failures, downtime and spend that lubrication should influence.
The KPI list, with formulas and decisions
| KPI | How to calculate | Decision it supports |
|---|---|---|
| Lubrication route compliance | Routes completed in their window divided by routes scheduled | Staffing and route design |
| Points lubricated on schedule | Lubrication points serviced on time divided by total points | Finding missed or hard-to-reach points |
| Lubricant contamination level | Cleanliness code or particle count trend from oil samples | Filtration and sealing upgrades |
| Oil analysis alert rate | Samples beyond limits divided by samples taken | Oil change timing and root cause work |
| Overdue lubrication tasks | Count and age of tasks past due | Weekly priorities |
| Lubrication-related failures | Failures with lubrication coded as cause, per period | Program effectiveness |
| Lubricant consumption per asset | Volume added against expected volume | Leaks and over-greasing |
| Lubricant types in use | Number of distinct products stocked | Rationalization and mix-up risk |
Maturity ladder: where is your program today?
Level 1
Reactive
Grease is added when someone notices a problem. No route data.
Level 2
Scheduled
Routes exist and compliance is tracked, but amounts are not verified.
Level 3
Controlled
Quantities, lubricant types and contamination are measured and reviewed.
Level 4
Condition-driven
Oil analysis and sensor data trigger tasks, and results feed design changes.
Common traps when reading lubrication KPIs
High compliance, poor results
Routes can be ticked without correct volume or grease type. Pair compliance with condition data.
Counting only planned tasks
Add emergency top-ups to see how much lubrication happens outside the plan.
Ignoring cause codes
Without a consistent failure code, lubrication-related failures stay hidden in general bearing faults.
Put lubrication routes and results in one place
Oxmaint helps teams schedule lubrication tasks, record findings and report compliance by asset and area.
Which assets to score first
- Kiln support rollers and drive gearboxes, where lubricant failure is costly.
- Raw and cement mill drives and trunnion bearings.
- Large fans handling hot or dusty gas.
- Crushers, conveyors and other dust-exposed equipment.
Weekly lubrication review
Overdue tasks by area and age
Samples beyond limits and actions taken
Unplanned top-ups and their reasons
Lubrication-coded failures this period
Data you need before the KPIs mean anything
1
Every lubrication point registered against an asset with lubricant type and quantity.
2
Tasks closed with the amount applied and any observation.
3
Oil sample results stored against the asset, not in a separate file.
4
Failure codes that separate lubrication causes from other bearing causes.
How to read each KPI without fooling yourself
| KPI | If it improves | If it worsens | First question to ask |
|---|---|---|---|
| Route compliance | Crew is completing planned rounds | Routes too long, access blocked or staffing short | Are tasks closed with real readings or just ticked? |
| Contamination level | Seals, breathers and filtration are working | Dust or water is entering the system | Which seal, breather or transfer container is the entry point? |
| Oil analysis alert rate | Fewer machines running outside limits | Wear, overheating or oil degradation is spreading | Is the sampling method consistent between samples? |
| Lubricant consumption | Leaks have been fixed or over-greasing reduced | Leaks, seal failure or excess greasing | Does usage match the expected quantity per point? |
| Lubrication-related failures | Program is protecting the machines | Gaps in method, quantity or lubricant choice | Was the cause confirmed by inspection or assumed? |
Designing an oil analysis program that produces decisions
Sampling discipline
- Take samples from the same point, at the same operating condition, with clean sampling equipment, so trends reflect the machine and not the method.
- Label samples with the asset tag, sample date, running hours and last oil change, so the laboratory can interpret the result in context.
- Set sampling frequency by criticality. Kiln drive and mill gearboxes justify closer intervals than a lightly loaded auxiliary drive.
Typical tests and what they reveal
- Viscosity shows whether the oil still has the right film strength, and whether the wrong product was added.
- Wear metals suggest which components are losing material, such as gears or bearings.
- Particle count and water content show contamination before it becomes visible.
- Acid number and oxidation indicators show remaining oil life.
From result to action
Normal result: log it and keep the schedule
Marginal result: resample sooner and check seals, breathers and filters
Alert result: raise a work order, inspect the machine, and decide on oil change or filtration
Repeat alert: investigate root cause and review design, such as sealing or cooling
Grease quantity control for bearings and open gears
Define the amount per point
Use the bearing supplier guidance and your own experience to set a quantity and an interval for each point. Record it on the task so the technician does not guess.
Control the delivery method
Hand grease guns deliver different volumes per stroke. Calibrate guns, mark them by grease type and consider automatic lubricators on points that are hard to reach or run continuously.
Check the purge
Clean grease at the purge point suggests healthy relubrication. Dark, hard or gritty grease suggests contamination or overheating and deserves a work order.
Storage and handling KPIs that are easy to forget
Track these in the store
Containers labeled by lubricant type and asset group
Dedicated, sealed transfer containers for each product
Oldest stock used first and shelf life monitored
Contamination checks on new oil before use
Why this matters
Clean oil can be contaminated in a drum, a funnel or an open container before it reaches the machine. A plant can have a perfect lubrication route and still lose bearing life because new lubricant is handled carelessly. Treat the store as the first step of the lubrication system, and measure it with simple audit checks each month.
Who owns which KPI
| Role | KPIs they own | Review rhythm |
|---|---|---|
| Lubrication technician | Route completion, points serviced, observations logged | Daily and weekly |
| Maintenance planner | Overdue tasks, route design, task backlog | Weekly |
| Reliability engineer | Oil analysis alerts, contamination trends, lubrication-related failures | Weekly and monthly |
| Maintenance manager | Program cost, consumption and compliance targets | Monthly |
| Stores supervisor | Lubricant stock, labeling, storage condition | Monthly |
A 90-day plan to lift the lubrication program
1
Days 1 to 30: baseline
Register lubrication points on critical assets, list current lubricants and quantities, and measure route compliance and overdue tasks without changing anything yet.
2
Days 31 to 60: control
Standardize quantities, label containers, calibrate guns and start oil sampling on the highest-criticality gearboxes and drives.
3
Days 61 to 90: act
Link oil results to work orders, review lubrication-coded failures and set targets from the baseline you now have.
4
After 90 days: extend
Add medium-criticality assets, consider automatic lubricators for hard points and review KPI targets every quarter.
Reporting lubrication to management
For the plant manager
Show lubrication-related failures, avoided stoppages and the trend in compliance. Keep it to a few lines and one chart.
For finance
Show consumption per asset group, leak reduction and the cost of lubricant-related repairs compared with last period.
For the reliability team
Show oil analysis trends, repeat alerts and actions, so root cause work is visible and tracked to closure.
Data entry habits that quietly break lubrication KPIs
- Closing a route in one click at the end of the shift, which hides skipped points and inflates compliance.
- Recording volume as a round number every time, which makes consumption analysis meaningless.
- Storing oil results in laboratory portals that are not linked to the asset in the maintenance system.
- Using several names for the same lubricant, which makes it impossible to count products in use or trace a mix-up.
- Failing to code lubrication as a cause when closing a bearing or gearbox failure, so the program never gets credit or blame.
How Oxmaint helps keep records clean
A CMMS can require fields on lubrication tasks, such as quantity applied and condition observed, so incomplete records are visible. It can also keep route compliance, overdue tasks and failure history against the same asset, which makes weekly reviews faster and more reliable.
Lubrication priorities by equipment group
| Equipment group | Main lubrication risk | KPI to emphasize | Practical control |
|---|---|---|---|
| Kiln drive and support rollers | Heat, load and slow rotation reduce film strength | Oil analysis alert rate and temperature trend | Defined sampling points and quick response to alerts |
| Raw and cement mill gearboxes | Contamination, oil degradation and filter blockage | Cleanliness code and filter change compliance | Breathers, offline filtration and sealed top-up |
| Fans and blowers | Over-greasing, dust and vibration | Quantity compliance and bearing temperature | Measured grease shots and routine purge checks |
| Crushers | Shock loads and heavy dust ingress | Overdue tasks and grease condition | Seal checks and short route intervals |
| Conveyors and elevators | Many points, easily missed | Points serviced on schedule | Clear route maps and automatic lubricators where practical |
Using KPIs to make better purchasing and design decisions
Reduce product variety
If the count of lubricant types is high, review whether equivalent products can replace several of them. Fewer products mean fewer mix-ups, simpler storage and easier training.
Justify sealing upgrades
Repeated contamination alerts on the same gearbox are evidence for better seals or breathers. Use the alert history and repair cost to support the request.
Justify automatic lubricators
Points with frequent missed tasks or unsafe access are strong candidates. Track compliance before and after to show the effect.
Keep the KPI set short
Eight KPIs are enough for most plants. Start with three or four, make sure each one has an owner and a decision attached, and add the others as data quality improves. A long dashboard that nobody acts on is worse than a short one that is reviewed every week.
A simple monthly lubrication scorecard
What to include
- Route compliance and points serviced on schedule, by area
- Overdue tasks with the age of the oldest item
- Samples beyond limits, actions raised and actions closed
- Lubrication-coded failures and their repair hours
How to use it
Review it in the same meeting every month
Assign one owner to every red item
Compare against last quarter, not a generic target
Retire KPIs that no longer drive a decision
Before you set targets
Collect at least one full quarter of data before you fix targets. Early numbers often look worse than reality because tasks were never recorded, and early targets set too high create pressure to close tasks without doing them. Share the baseline openly with the crew, explain what each KPI is for, and agree improvements together so the numbers stay honest and useful.
Frequently asked questions
What is the most important lubrication KPI in a cement plant?
No single KPI is enough. Combine route compliance, contamination or oil analysis, and lubrication-related failures.
What compliance target should we use?
Set targets from your baseline and criticality, then raise them gradually. Generic numbers rarely fit every site.
Can a CMMS track lubrication?
Yes. Oxmaint can schedule routes, record results and report overdue tasks.
How do we link lubrication to failures?
Use consistent failure codes on work orders and review them monthly against route and oil data.
Where should we begin?
Start with critical drives and gearboxes. You can book a demo to plan the first routes.
Measure lubrication like the reliability lever it is
Track routes, condition and failures together with Oxmaint.