University CFOs are facing a forecasting crisis that spreadsheets cannot solve. Across American higher education, 70–80% of facilities maintenance spending is reactive — responding to failures after they occur — which means the single largest line item in most institutional operating budgets is essentially unpredictable. When a $180,000 chiller compressor fails in August or a $400,000 boiler tube rupture forces emergency repairs in January, the variance hits the operating budget with zero warning, forcing mid-year reallocation from academic programs, hiring plans, and strategic initiatives. The $200 billion national deferred maintenance backlog is not just a facilities problem — it is a financial forecasting problem that erodes budget credibility with boards, rating agencies, and accreditors every time another "unexpected" capital emergency appears. AI-powered predictive maintenance changes this equation by converting reactive uncertainty into forecastable expenditure — giving CFOs the data to predict which systems will fail, when they will fail, how much the repair will cost, and whether replacement delivers better TCO than continued maintenance. The result is not just lower maintenance costs. It is a fundamentally more accurate institutional budget. Schedule a campus budget forecasting assessment to see how predictive maintenance data transforms your capital and operating projections.
Reactive Spend Ratio
70–80%
Of campus maintenance dollars are reactive — unplanned, unbudgeted, and invisible to financial forecasting models until the invoice arrives
Budget Variance Impact
$1.2M+
Average annual budget overrun from unplanned facility failures at mid-size universities (3–5M GSF), forcing mid-year reallocation
Forecasting Accuracy Gain
3–5×
Improvement in maintenance budget accuracy when AI-driven predictive data replaces calendar-based estimates and historical averages
Why Traditional Campus Budget Forecasting Fails
Most university CFOs build maintenance budgets using the same method: take last year's actual spend, add 3–5% for inflation, and hope the number holds. This approach fails because it treats maintenance as a stable, predictable cost category — when in reality, campus maintenance spending is dominated by low-probability, high-cost failure events that follow equipment degradation curves, not calendar cycles. AI-powered maintenance analytics replaces hope with data by tracking every asset's condition trajectory and projecting failure probability into the budget cycle.
1
Historical Averaging Ignores Asset Aging
Backlog grows $15–$20B/yr nationally
Why This Breaks Your Budget:
• Averaging 5 years of spend assumes the building portfolio is static — but systems age nonlinearly, with failure rates accelerating after 75% of useful life
• A chiller that cost $8,000/yr to maintain at age 15 may cost $45,000/yr at age 22 — and $180,000 to replace at age 25
• Historical averages mask the "failure cliff" where multiple systems in the same building reach end-of-life simultaneously
• Deferred maintenance compounds — every $1 deferred today becomes $4–$5 in emergency repair cost within 3–5 years
AI Fix: Predictive models track remaining useful life for every major asset and project year-by-year maintenance costs based on actual degradation curves — not historical averages. Your 5-year capital forecast reflects what will happen, not what happened.
2
Emergency Spend Is Invisible Until It Hits
3–5× cost premium per reactive event
Why This Breaks Your Budget:
• Emergency repairs carry expedited labor, overnight parts shipping, temporary system rental, and overtime premiums — 3–5× planned cost
• Consequential costs (housing displacement, class cancellation, research loss) never appear in the facilities budget but hit the institutional P&L
• Insurance premiums rise after claims, but the increase is delayed 1–2 fiscal years — invisible in the budget cycle that caused it
• Mid-year budget reallocations from academic to facilities destroy departmental trust in the budgeting process
AI Fix: Predictive failure alerts identify systems trending toward failure 2–6 months in advance — converting emergency events into planned repairs at 1/3 to 1/5 the cost, within the current budget cycle.
3
Capital vs. Operating Misclassification
Distorts both budgets simultaneously
Why This Breaks Your Budget:
• Without asset condition data, institutions cannot determine whether a system needs repair (operating) or replacement (capital)
• Repeated operating repairs on end-of-life equipment often exceed replacement cost — but the decision is never modeled
• Capital project requests compete on political urgency rather than financial merit because no standardized condition data exists
• Bond-funded capital plans lack the facility condition documentation that rating agencies and accreditors require
AI Fix: Total Cost of Ownership modeling compares continued-repair vs. replacement scenarios for every major asset — giving CFOs defensible capital vs. operating allocation recommendations backed by condition data.
4
Energy Costs Float Without Maintenance Data
15–30% energy waste from aging HVAC
Why This Breaks Your Budget:
• HVAC systems operating past useful life consume 15–30% more energy than maintained or modern equivalents
• Energy budgets are built from utility rate projections — but equipment efficiency degradation is the larger variable on aging campuses
• Maintenance-driven energy waste is invisible without per-building, per-system consumption analysis tied to equipment condition
• Decarbonization targets require energy reduction — but you cannot forecast the path without knowing which systems are degrading fastest
AI Fix: Energy consumption is correlated with maintenance condition data per building and per system — revealing exactly which equipment upgrades deliver the highest energy ROI and forecasting savings with precision.
See AI-Powered Budget Forecasting for Campus Maintenance
Oxmaint gives CFOs and CBOs the predictive maintenance analytics that convert reactive spending into forecastable capital and operating projections — with board-ready reports generated from actual asset condition data, not historical estimates.
The Five Budget Lines AI Predictive Maintenance Transforms
AI-powered maintenance analytics does not just reduce maintenance costs — it restructures how five interconnected budget lines behave, converting each from a reactive estimate into a data-driven projection. For university CFOs managing $50M–$300M operating budgets, the compound effect across all five lines represents the difference between a budget that holds and one that requires mid-year emergency reallocation.
Budget Line Transformation: Before vs. After Predictive Analytics
Impact modeling based on mid-size university (3–5M GSF) • 2024–2026 deployment data
Maintenance Operating Budget
±8% → ±2%
Variance reduced 4× with predictive scheduling
Capital Repair & Replacement
±25% → ±6%
Asset condition data replaces guesswork
Energy & Utilities
±12% → ±4%
Equipment efficiency linked to maintenance state
Emergency Contingency Reserve
8–12% → 3–5%
Lower reserve needed when surprises are predicted
Net Budget Reallocation to Strategic Priorities
$800K–$3.2M
Freed from over-reserved contingency + avoided emergencies
How AI Converts Maintenance Data into Financial Intelligence
The CFO does not need a maintenance dashboard — they need a financial forecasting tool that happens to be powered by maintenance data. AI-powered maintenance analytics bridges this gap by translating asset condition, work order patterns, and failure probabilities into the financial language that budget planning, bond underwriting, and board reporting require. Here are the five analytical capabilities that matter most to the finance office.
Remaining Useful Life Projection
Know exactly when every major system will need replacement — and what it will cost
✓ AI models calculate remaining useful life for every chiller, boiler, AHU, roof, and electrical system based on age, condition, maintenance history, and utilization
✓ Year-by-year replacement cost projections feed directly into 5-year and 10-year capital planning models
✓ "Failure cliff" detection alerts when multiple systems in the same building approach end-of-life simultaneously — preventing budget surprises
CFO Output: 10-year capital expenditure forecast by building, by system, with confidence intervals — not flat-rate estimates
Total Cost of Ownership Modeling
Repair vs. replace decisions backed by data instead of intuition
✓ TCO analysis compares continued-maintenance cost trajectory against replacement cost + efficiency gains for every major asset
✓ Includes energy efficiency differential — replacing a 25-year-old chiller may save $80,000/yr in energy alone
✓ Breakeven year calculation shows CFO exactly when replacement becomes cheaper than continued repair
CFO Output: Defensible repair vs. replace recommendations for every asset above $50K replacement cost — with payback period
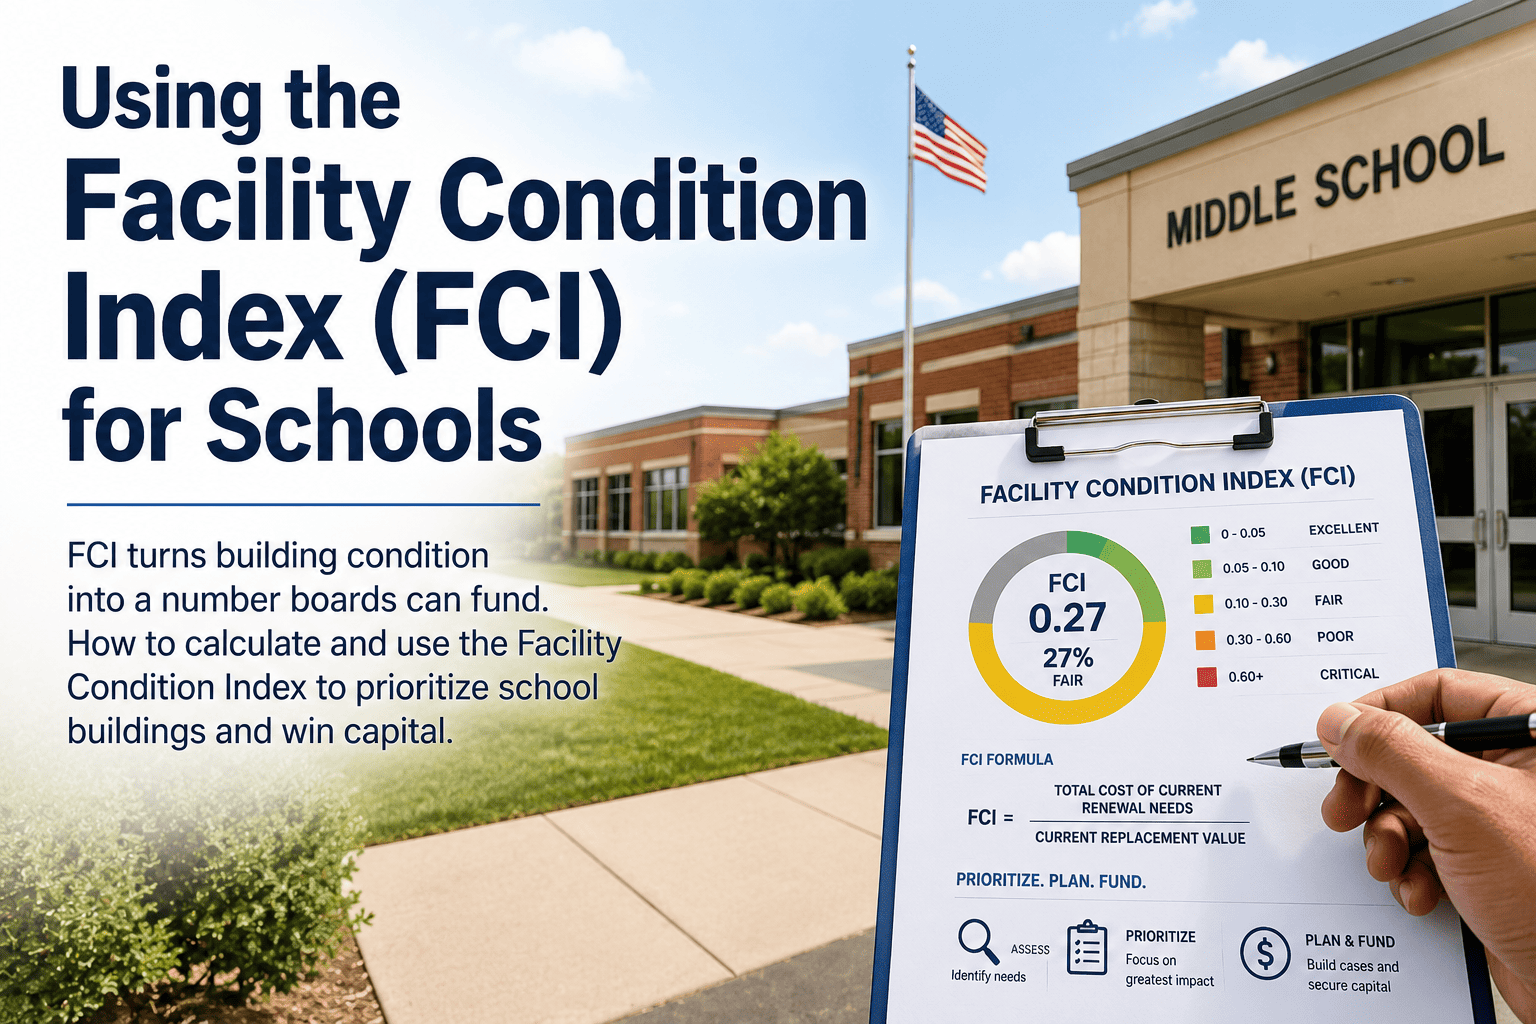
Facility Condition Index by Building
Standardized portfolio health metric that boards and rating agencies understand
✓ FCI calculated per building: current deferred maintenance ÷ current replacement value. Industry benchmark: below 0.05 = good, above 0.10 = poor
✓ FCI trending shows whether each building is improving or deteriorating over time — and at what rate
✓ Portfolio-level FCI gives rating agencies (Moody's, S&P) the standardized metric they use to evaluate institutional infrastructure health
CFO Output: Board-ready FCI dashboard that demonstrates fiduciary stewardship — and supports credit rating conversations
Predictive Budget Variance Modeling
Forecast next quarter's maintenance spend before the quarter starts
✓ AI analyzes seasonal failure patterns, upcoming PM costs, asset condition trajectories, and weather forecasts to project quarterly spend
✓ Confidence intervals show best-case, expected, and worst-case scenarios for each budget period
✓ Variance alerts trigger when actual spend deviates from projection — enabling mid-quarter correction instead of year-end surprises
CFO Output: Quarterly maintenance budget forecast with ±2–4% accuracy — vs. ±15–25% under traditional methods
Capital Prioritization by Risk-Adjusted ROI
Rank every capital project by financial return — not political urgency
✓ Every deferred capital project scored by: failure probability × consequence cost × energy savings × enrollment impact
✓ Portfolio optimization model allocates limited capital dollars to projects that deliver the highest risk-adjusted return per dollar invested
✓ "Cost of deferral" calculation shows exactly how much each year of delay adds to the eventual project cost
CFO Output: Prioritized capital project list ranked by ROI — the defensible, data-driven framework boards need to approve investment
The Board Reporting Package AI Builds Automatically
CFOs spend significant staff time assembling board presentations that attempt to communicate facility condition, maintenance spending, and capital needs. AI-powered maintenance platforms generate these reports automatically from operational data — eliminating the manual assembly process and, more importantly, replacing estimated narratives with documented metrics. Every number traces back to a work order, an asset record, or a condition assessment.
AI-Generated Board Reporting: What Your Trustees See
Auto-generated from Oxmaint operational data • No manual assembly required
Portfolio Facility Condition Index
0.067
Trending: improved from 0.089 (18 months prior)
Deferred Maintenance Backlog
$47.2M
Reduced from $58.6M — first decline in 8 years
Emergency vs. Planned Work Order Ratio
18:82
Down from 68:32 — 3.7× improvement in 12 months
Maintenance Budget Variance (YTD)
+1.8%
vs. +14.3% average variance prior 3 years
Capital Freed for Strategic Reallocation
$2.1M
From avoided emergencies + reduced contingency reserve
Your Board Deserves Data — Not Estimates
Oxmaint generates board-ready facility reporting automatically from your operational data — FCI by building, deferred maintenance trending, budget variance tracking, and capital prioritization by ROI. No manual assembly. Every number traces to a documented source.
Credit Rating and Bond Implications
For universities that issue bonds to fund capital projects, the connection between maintenance data and credit ratings is direct and consequential. Moody's and S&P both evaluate deferred maintenance ratios as part of their higher education credit assessments. Institutions that can demonstrate a credible, data-backed plan to address their infrastructure backlog receive more favorable borrowing terms. Institutions that cannot face higher interest rates on every future bond issuance — a cost that compounds for decades.
Moody's: Deferred Maintenance as Credit Risk Factor
Rating agencies now evaluate institutional infrastructure management as a credit indicator
✓ Moody's higher education methodology includes "physical plant condition" as a factor in assessing long-term financial sustainability
✓ Institutions with deferred maintenance ratios above 0.10 face negative credit pressure — potentially increasing borrowing costs 25–75 basis points
✓ A 50-basis-point increase on a $100M bond issuance adds $500,000 annually in debt service — $15M over a 30-year bond life
AI provides the documented FCI trending and capital investment plan that rating agencies require to assess infrastructure management credibility
Bond Underwriting: Demonstrable Asset Stewardship
Data-backed facility condition reporting strengthens bond issuance narratives
✓ Bond offering documents supported by system-level condition assessments, not building-level estimates
✓ Capital project prioritization ranked by risk-adjusted ROI demonstrates fiscal discipline to underwriters
✓ Predictive maintenance trending shows backlog reduction trajectory — evidence that the institution is actively managing its infrastructure risk
CFO delivers a bond issuance narrative backed by operational data — the strongest possible positioning for favorable terms
Accreditation: Facility Adequacy Documentation
Regional accreditors evaluate whether facilities support the institutional mission
✓ Accreditation self-studies require evidence that facilities are "adequate to support the mission" — AI-generated FCI reports provide this documentation
✓ Condition trending demonstrates continuous improvement — the narrative accreditors want to see
✓ Compliance documentation (OSHA, NFPA, EPA, ADA) auto-generated from maintenance records supports accreditation standards for safety and accessibility
Accreditation facility documentation assembled in hours from CMMS data — not months of manual narrative writing
Implementation: From Spreadsheets to Predictive Analytics in 90 Days
The biggest misconception about AI-powered maintenance analytics is that it requires a multi-year, enterprise-wide technology project. Modern cloud platforms deploy in weeks, begin generating useful predictions within months, and reach full financial forecasting capability within two semesters. Here is the realistic implementation path for a university CFO's office. Book a demo to get a customized timeline for your institution.
Phase 1: Data Foundation (Weeks 1–3)
Import existing data and establish the asset registry that powers all analytics
✓ Import building inventory, equipment data, and historical work orders from existing CMMS, spreadsheets, or paper records
✓ Establish asset hierarchy: campus → building → system → component with replacement values and installation dates
✓ Configure financial coding: map every asset and work order type to your chart of accounts for automatic budget classification
Deliverable: Complete asset registry with financial coding — the foundation for every analytic that follows
Phase 2: Operational Launch (Weeks 3–6)
Facilities team begins using the platform for daily operations — generating the data AI needs
✓ Activate PM scheduling, mobile work orders, and spare parts tracking across highest-priority buildings
✓ Every work order captures: asset, labor hours, parts cost, failure mode, root cause — feeding the predictive model
✓ Real-time spending dashboard gives CFO immediate visibility into maintenance expenditure by building, system, and work order type
Deliverable: Live operational spending dashboard — CFO sees actual vs. budget daily, not quarterly
Phase 3: Analytics Activation (Weeks 6–10)
AI begins generating the predictive insights that transform budget forecasting
✓ FCI calculated per building from accumulated condition data and deferred maintenance inventory
✓ Remaining useful life projections generated for major systems based on age, condition, and work order patterns
✓ Emergency vs. planned ratio tracking shows immediate improvement as PM compliance increases
Deliverable: First AI-generated budget variance report — the CFO sees predictive accuracy improvement in real time
Phase 4: Financial Forecasting (Weeks 10–13+)
Full predictive financial intelligence powering budget cycles and board reporting
✓ 5-year capital forecast generated from asset condition data with year-by-year replacement cost projections
✓ TCO modeling active for all major assets — repair vs. replace recommendations with payback analysis
✓ Board reporting package auto-generated: FCI trending, backlog reduction, budget variance, capital prioritization by ROI
Deliverable: Board-ready financial reporting powered by operational data — the CFO's maintenance budget is now predictive, not reactive
Free Campus Budget Forecasting Assessment
Your spreadsheets cannot predict which chiller will fail next semester. Your historical averages cannot tell the board whether Building C needs $4.2M before Building D gets $1.8M. Your contingency reserves are either too large (wasting capital) or too small (forcing mid-year reallocation). Oxmaint's Campus Budget Forecasting Assessment analyzes your building portfolio, models your deferred maintenance exposure, and delivers a 5-year predictive capital and operating forecast — within 15 business days. No commitment. No cost. Just the financial intelligence your board needs to approve defensible infrastructure investment.
Frequently Asked Questions
How quickly does AI-powered maintenance analytics improve budget forecast accuracy?
Most universities see measurable improvement within the first two quarters. The initial gains come from automated PM scheduling reducing emergency events (which are the primary source of budget variance), and real-time spending dashboards eliminating the 60–90 day lag between expenditure and visibility. Predictive accuracy improves continuously as the platform accumulates more work order data, asset condition records, and failure pattern history. Institutions that have operated the platform for 12+ months typically achieve ±2–4% maintenance budget variance — compared to ±15–25% under traditional methods.
Sign up free to start building your predictive data foundation.
Does this require replacing our existing ERP or financial system?
No. Oxmaint integrates with existing ERPs (Banner, Workday, PeopleSoft) and financial systems through standard APIs. Work orders, asset data, parts procurement, and cost tracking sync bidirectionally so maintenance spending flows into institutional financial reporting without manual reconciliation. The platform adds a predictive analytics layer on top of your existing financial infrastructure — it does not replace it. Most universities maintain their ERP for procurement approvals and general ledger while using Oxmaint for facilities operations and predictive analytics.
What data do we need to get started if we currently use spreadsheets or paper work orders?
At minimum, you need a building inventory with approximate square footage and a list of major mechanical systems with installation dates or approximate ages. Historical work orders add value but are not required — the platform begins generating useful data from Day 1 of operation. Most institutions import whatever data they have (even partial spreadsheets), then enrich it through normal operations as technicians complete work orders that capture asset condition, failure modes, and parts consumption. The AI models improve with every data point. Start with what you have — perfection is not required to begin.
How does this help with the enrollment cliff specifically?
The 2026 enrollment cliff compresses revenue at the exact moment infrastructure costs are accelerating. AI-powered maintenance analytics helps CFOs navigate this squeeze in three ways: reducing total maintenance spend 25–40% by eliminating emergency cost premiums, freeing contingency reserves for strategic reallocation (enrollment marketing, academic programs, financial aid), and improving facility quality — which is a top-3 factor in student enrollment decisions. The institutions that maintain competitive physical environments without increasing facilities budgets will be the ones that survive the enrollment cliff with margins intact.
Book a demo to model the financial impact for your institution.
What does this cost, and how do I justify the investment to my board?
Oxmaint offers a free tier that lets your team run a real pilot on your highest-priority buildings with no credit card required. For full campus deployment, pricing scales with portfolio size. The business case centers on three quantifiable ROI streams: emergency cost avoidance (40–65% reduction in reactive spend), energy optimization (15–25% savings from maintenance-driven HVAC efficiency), and contingency reserve liberation ($400K–$1.5M freed annually when budget variance drops from ±15% to ±3%). Most institutions demonstrate positive ROI within two semesters. The platform generates the board-ready ROI report from your own operational data — the CFO's strongest possible justification.