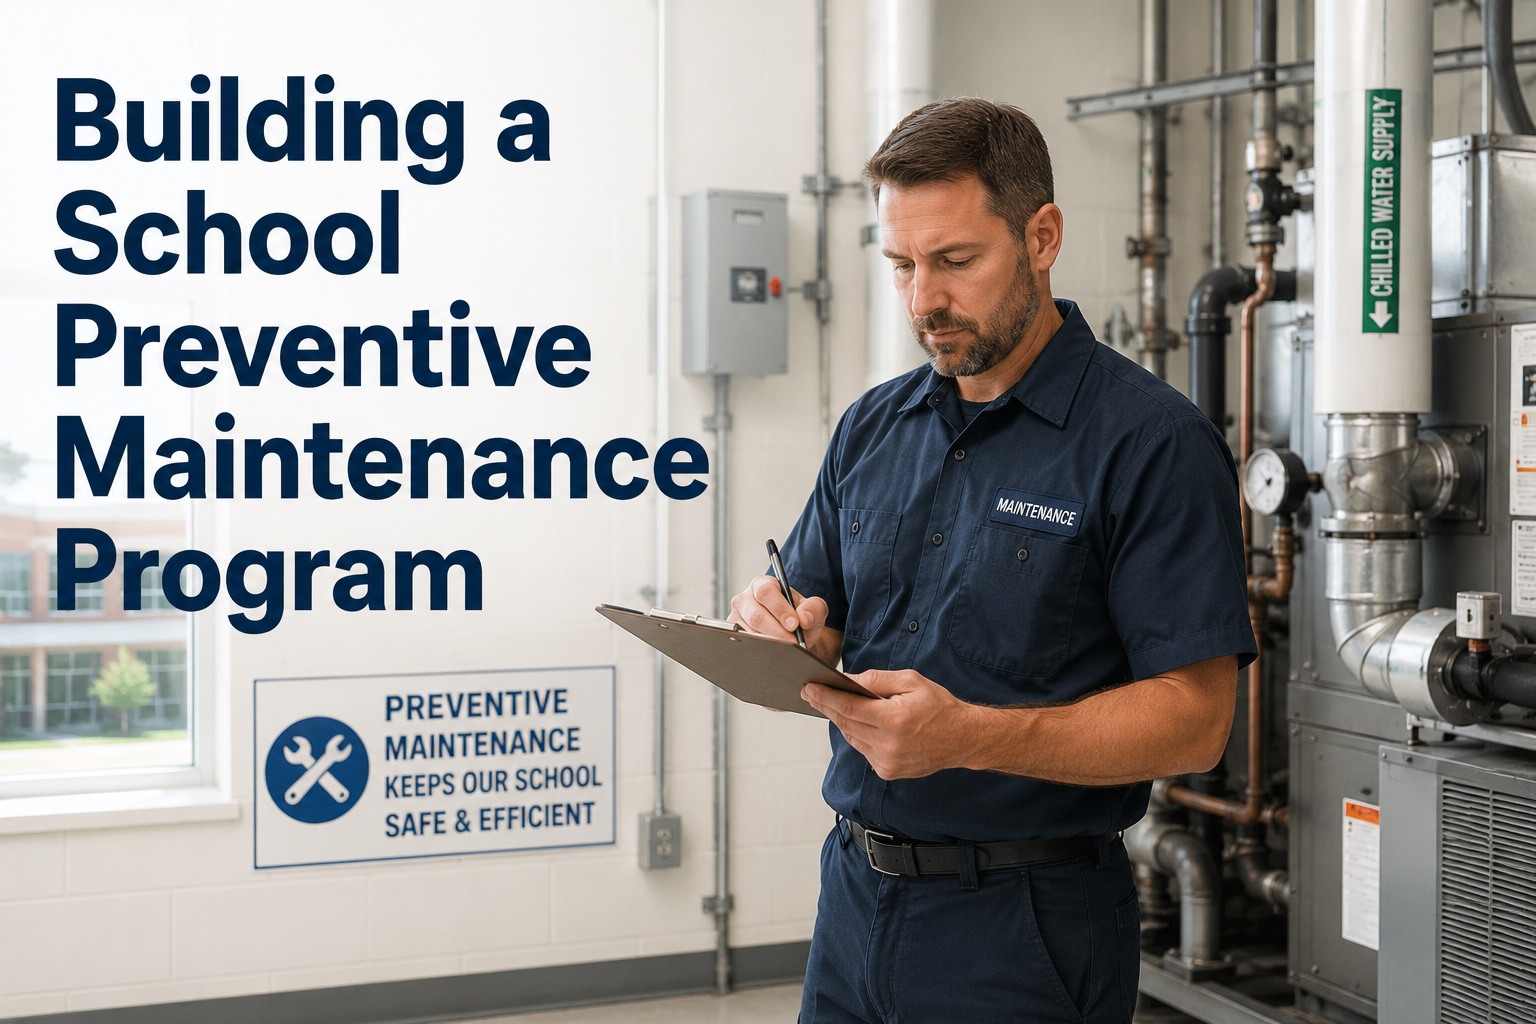
A well-run school preventive maintenance program is the difference between a campus that quietly makes it through the academic year and one that burns through emergency budgets by winter break. Studies across education facilities consistently show that structured PM extends equipment life 30–40% and cuts unplanned failures by 60–75% — gains that translate directly into fewer disrupted classrooms, safer students, and budget you actually control. The framework below walks through PM library design, frequency setting, resource planning, compliance tracking, and the CMMS backbone that keeps PM compliance above 90% across every campus in a district. If you want to put it into practice this term, you can Start Free Trial and stand up a working PM schedule in a single afternoon.
Is your district limping from one emergency call to the next?
Six in ten K–12 facility teams report that more than half of their work orders are reactive. A structured preventive maintenance program flips that ratio — extending asset life 30–40% and cutting emergency failures by 60–75% — so your crew spends the year ahead of breakdowns, not chasing them.
Reactive maintenance costs 3–9× more than preventive work
Every breakdown carries a cascade of costs the work order never captures — overtime premiums, expedited parts shipping, displaced classes, and accelerated wear on connected equipment. The math is unforgiving, and it compounds across a 180-asset campus portfolio.
Consider a 6-school district running roughly 1,200 maintained assets — rooftop units, boilers, kitchen refrigeration, bus fleet, elevators, and access controls. At a typical reactive posture the district logs about 1,400 emergency work orders a year at an average all-in cost of $480 each, totaling $672,000 in unplanned spend. After standing up a tiered PM program and pushing compliance to 92% over two semesters, emergency work orders fall to roughly 380/year and average cost drops to $390 (fewer after-hours calls, fewer expedited parts). That is a $524K swing — enough to fund two additional technicians and still bank reserves for the next capital replacement cycle.
Five phases to stand up a school PM program that sticks
Building the program is not a single kickoff meeting — it is a sequenced rollout that moves from inventory to compliance over 90–120 days. Each phase below has a defined deliverable, an owner, and an exit criterion.
Asset Inventory & Criticality Ranking
Days 0–20 · Owner: Facilities Director
Walk every building and catalog each maintained asset with a unique ID, location, install date, manufacturer, model, and serial. Tag criticality A/B/C — A being life-safety or instructional-critical (boilers, fire pumps, kitchen refrigeration, elevators), C being cosmetic. A typical 1,000-student campus lands between 180 and 260 maintained assets; a six-school district lands near 1,200. Exit criterion: 100% of A- and B-class assets in the CMMS with a criticality score and a warranty end date.
PM Library Design
Days 15–40 · Owner: Maintenance Supervisor
For every A- and B-class asset, draft a PM task list pulled from OEM manuals, ASHRAE Guideline 32 for HVAC, NFPA 25 for fire systems, and local code. Each PM template carries a task checklist, estimated labor minutes, required parts, and a safety lockout/tagout step. Target a library of 60–90 templates covering 90%+ of asset types — the long tail of one-off equipment can be added later. Exit criterion: every A-class asset has at least one PM template assigned.
Frequency Setting & Calendar Loading
Days 30–55 · Owner: Maintenance Planner
Translate OEM intervals and code requirements into a rolling calendar — monthly, quarterly, semi-annual, annual, and 3-year cycles. Stagger heavy annual PMs (boiler overhauls, chiller tube cleaning) across summer break and lighter quarterly tasks across the academic year so no week exceeds 85% of available technician hours. Exit criterion: a 12-month forward schedule with no week flagged red for overload and no A-class asset missing its next PM date.
Resource & Parts Planning
Days 45–75 · Owner: Operations Manager
Map labor demand against current headcount and identify the gap — most districts discover they need to reallocate 20–30% of technician time from reactive to planned work, not hire net-new. Set min/max stock levels for the top 50 fast-moving parts (filters, belts, seals, contactors) so PMs are never delayed waiting on a supply run. Exit criterion: critical spares on hand for every A-class PM due in the next 90 days.
Compliance Tracking & Continuous Tuning
Days 60–120 · Owner: Facilities Director
Publish a weekly PM compliance dashboard — completed PMs divided by scheduled PMs, broken down by campus, asset class, and technician. Anything below 90% triggers a root-cause review: was the interval too aggressive, was the part unavailable, was the time blocked by an emergency? Tune frequencies quarterly for the first year. Exit criterion: 12 consecutive weeks at or above 90% compliance across all campuses.
What belongs in a school PM library — and how often it runs
The library is the heart of the program. Below is the core set of PM tasks education facilities run, the governing standard, and a defensible frequency range. Use the upper end of each range for older equipment and high-occupancy buildings.
| Asset Class | Core PM Tasks | Governing Standard | Frequency Range |
|---|---|---|---|
| Boilers & Hydronic Heat | Flue gas analysis, burner tune, relief valve test, low-water cutoff blowdown, waterside inspection | ASME CSD-1 / NFPA 85 | Monthly + annual overhaul |
| Rooftop Units & AHUs | Filter change, belt tension, coil cleaning, condensate drain clear, economizer check | ASHRAE Guideline 32 | Quarterly (filters monthly in peak season) |
| Kitchen Refrigeration | Coil cleaning, door gasket seal, temperature log review, defrost cycle check, refrigerant leak survey | FDA Food Code / local health code | Quarterly |
| Fire Suppression & Pumps | Full flow test, churn pressure test, jockey pump cycle, valve tamper switch check | NFPA 25 | Weekly churn · annual full flow |
| Elevators | Machine room inspection, lubrication, door operator test, emergency lighting, phone test | ASME A17.1 | Monthly (categorization) · annual (certification) |
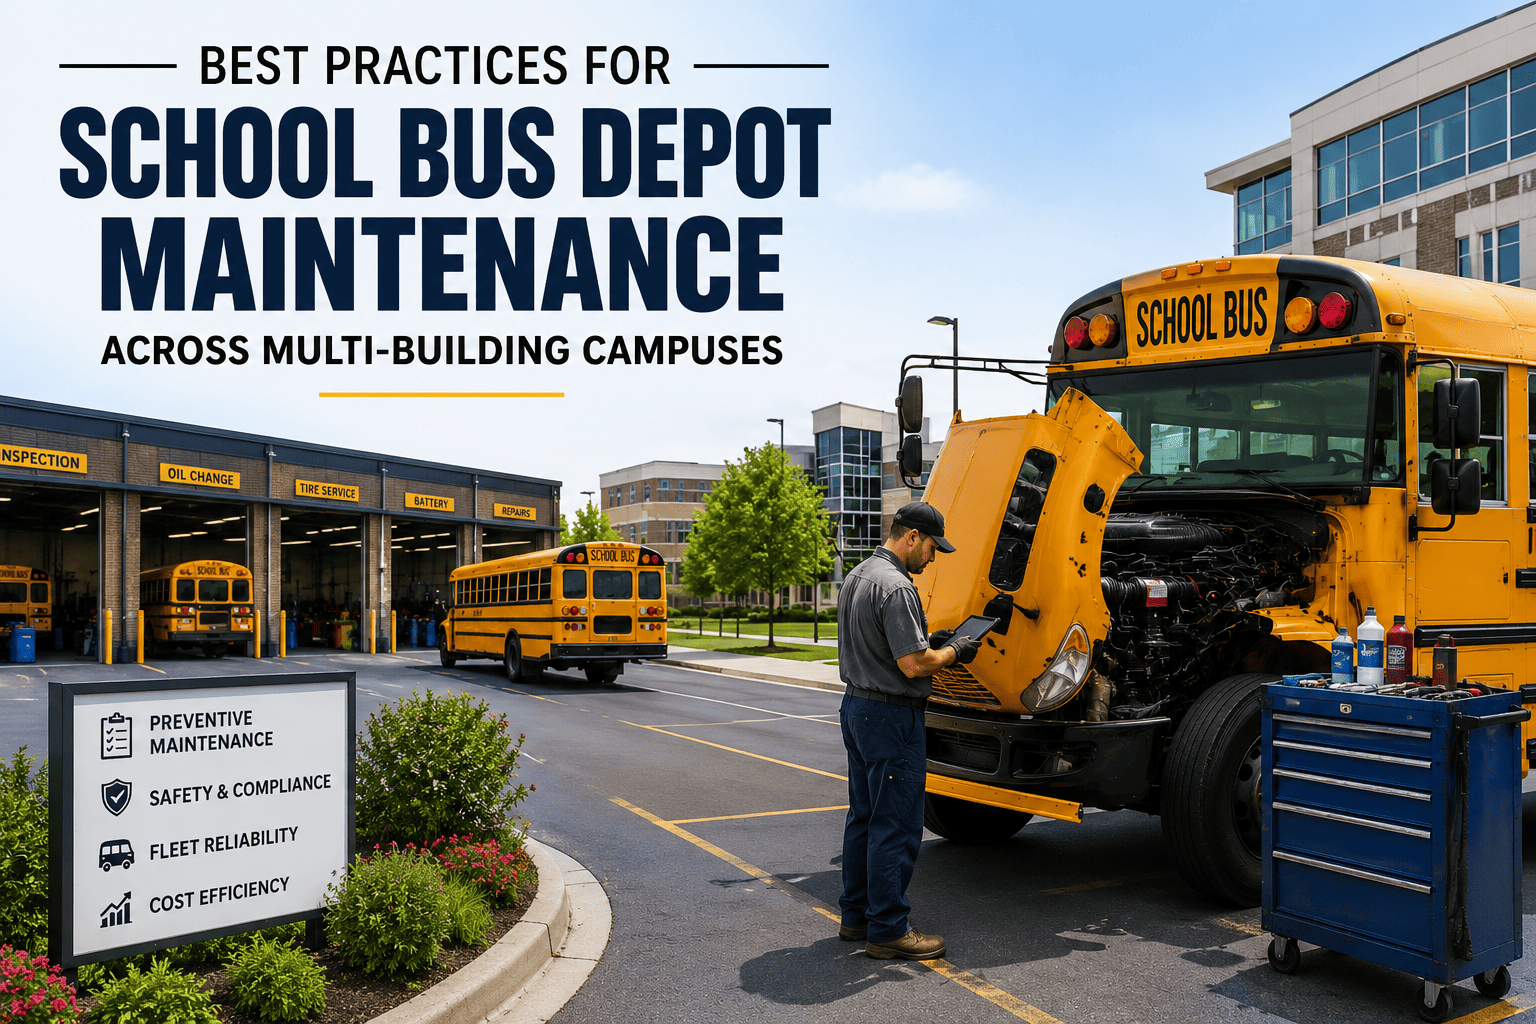
| Bus Fleet & Grounds Equipment | DOT inspection, fluid levels, brake adjustment, tire depth, DEF/DPF regeneration check | FMCSA / state DOT | Every 3,000–6,000 miles or quarterly |
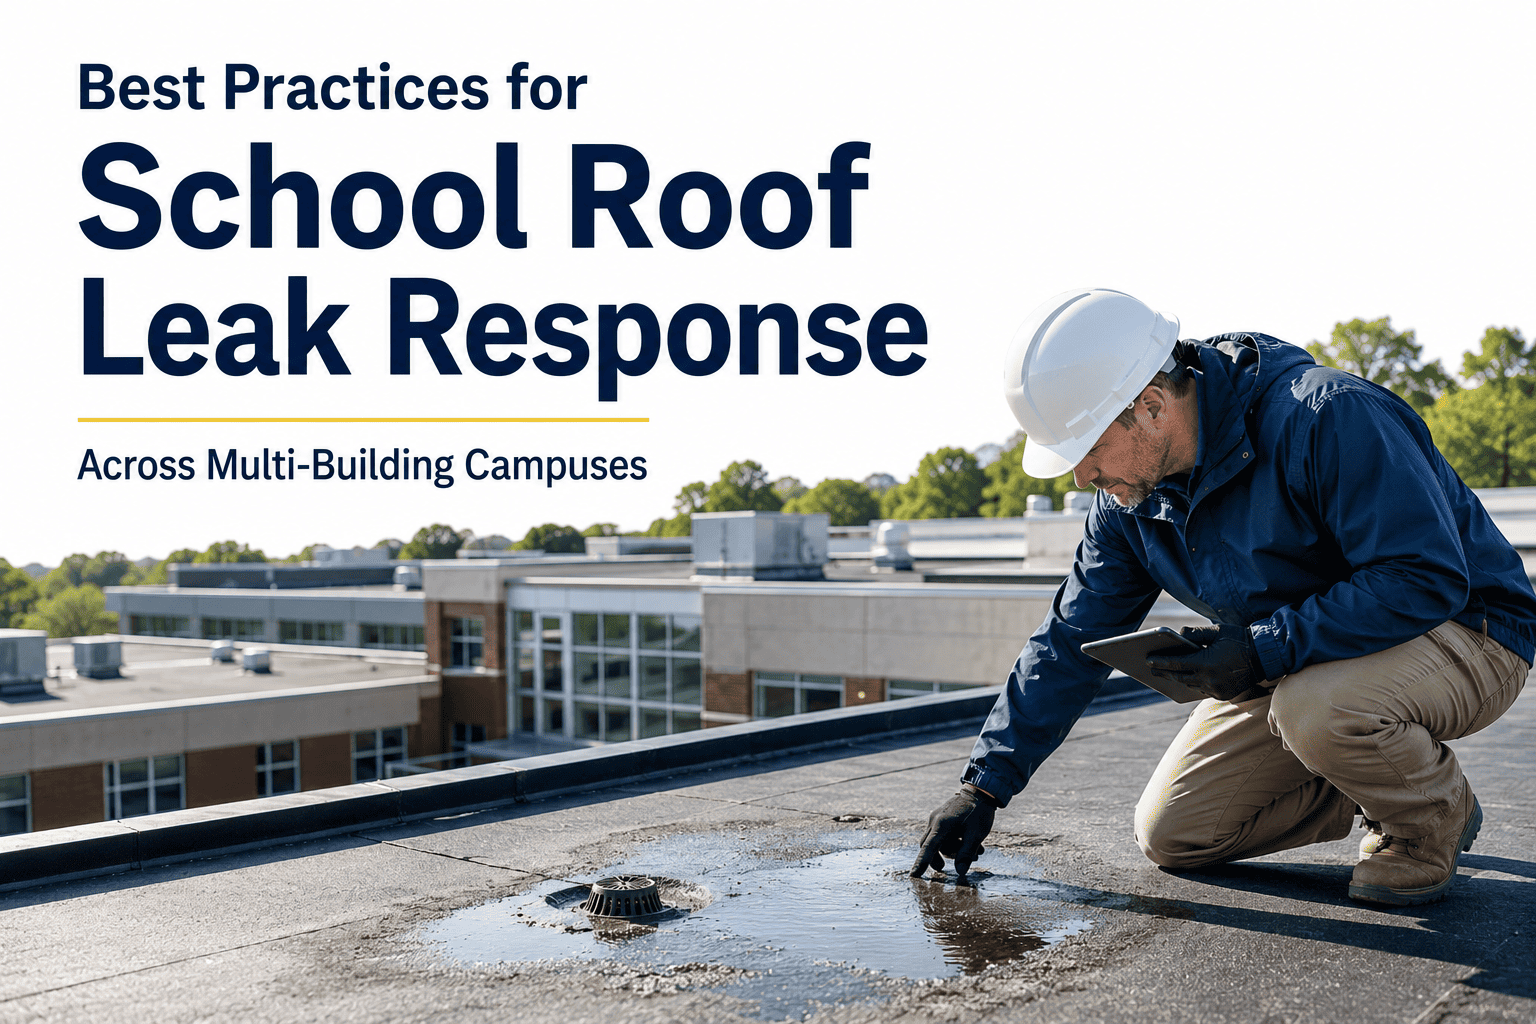
| Roofing Systems | Drain clear, flashing inspection, membrane scan, penetrations seal check, debris removal | NRCA / manufacturer warranty | Semi-annual + post-storm |
The one number that predicts whether your program is working
PM compliance is the single leading indicator of facility health — it tells you whether the schedule you designed is the schedule you actually execute. Track it weekly, by campus, and post it where technicians and principals can both see it.
The system architecture that keeps compliance above 90%
A CMMS is not a digital filing cabinet — it is the operating system for the program. The structure below is what top-quartile education facilities use to make PM execution the path of least resistance for every technician on every campus.
Asset Hierarchy by Campus
Organize assets as Campus → Building → Floor → Room → Asset so any technician can drill from district-level dashboards to a single rooftop unit in three taps. Each asset record carries its PM templates, history, warranty, and criticality on one screen.
Auto-Generated PM Work Orders
PMs generate automatically on their interval — no planner has to remember to schedule them. Each work order arrives with the task checklist, required parts, estimated labor, LOTO steps, and the asset's last-five history so the technician walks in informed.
Mobile Execution in the Field
Technicians close PMs from a phone or tablet — checklist sign-off, photo attachment, parts consumed, time stamp, and a failure flag that converts the PM into a corrective work order on the spot. No paperwork, no data entry back at the shop.
Live Compliance Dashboard
A single dashboard shows PM compliance by campus, asset class, and technician — updated in real time as work orders close. Drill into any cell to see which PMs slipped and why, so the weekly review meeting starts with data, not anecdotes.
Stand up your school PM program this term
Upload your asset list, apply 60+ pre-built education PM templates, and watch your compliance dashboard climb past 90% in a single semester.
School preventive maintenance program — the questions that come up first
How long does it realistically take to stand up a school PM program?
A focused district with a CMMS in place can inventory A- and B-class assets, build a 60–90 template PM library, and load a 12-month calendar in 90–120 days. The compliance climb to 90% typically takes another two semesters as the team shifts from reactive to planned work and frequencies are tuned. You can shorten the setup phase significantly — Start Free Trial and import an existing asset spreadsheet to have a working schedule the same afternoon.
What PM compliance rate should a school district target?
The industry benchmark for top-quartile education facilities is 90% or higher, measured weekly as PMs completed on time divided by PMs scheduled. Below 70% the operation is still reactive; 70–89% is a transitional band where the schedule exists but slips on parts or labor. Holding 90%+ is where emergency work orders drop 60–75% and asset life extends 30–40%.
Do we need to hire more technicians to make PM work?
Usually not. Most districts find that 20–30% of technician time is trapped in reactive work that PM eliminates. As compliance climbs past 80%, that time is freed for planned tasks — the labor rebalances itself. The real investment is in parts stocking (so PMs are not delayed waiting on supplies) and in the CMMS that automates scheduling and tracking.
Which assets should be in the PM program first?
Start with A-class assets — anything life-safety (fire pumps, suppression, elevators), instructional-critical (boilers, chillers, kitchen refrigeration), or regulated by code (NFPA 25, ASHRAE 32, ASME CSD-1). These represent roughly 20–30% of the asset count but 70%+ of the risk. Layer in B-class assets (unit ventilators, plumbing, access controls) in the second quarter, and C-class last.
How does a CMMS prove ROI to the school board?
Track three numbers over a full academic year: emergency work order count, average emergency repair cost, and deferred maintenance backlog. A district moving from 55% to 92% compliance typically sees emergency work orders cut by two-thirds, average repair cost drop 15–20% (fewer after-hours and expedited parts), and the deferred backlog stabilize instead of growing. Translate that into dollars and compare against the CMMS subscription cost — the payback is usually under 90 days. To see the dashboard structure your board would receive, Book a Demo and we will walk through a live education facility instance.
Stop chasing breakdowns. Start preventing them.
Join the education facilities running at 90%+ PM compliance — fewer emergencies, longer asset life, calmer school years. Set up your PM library in an afternoon and watch your dashboard climb.
Free 14-day trial · No credit card