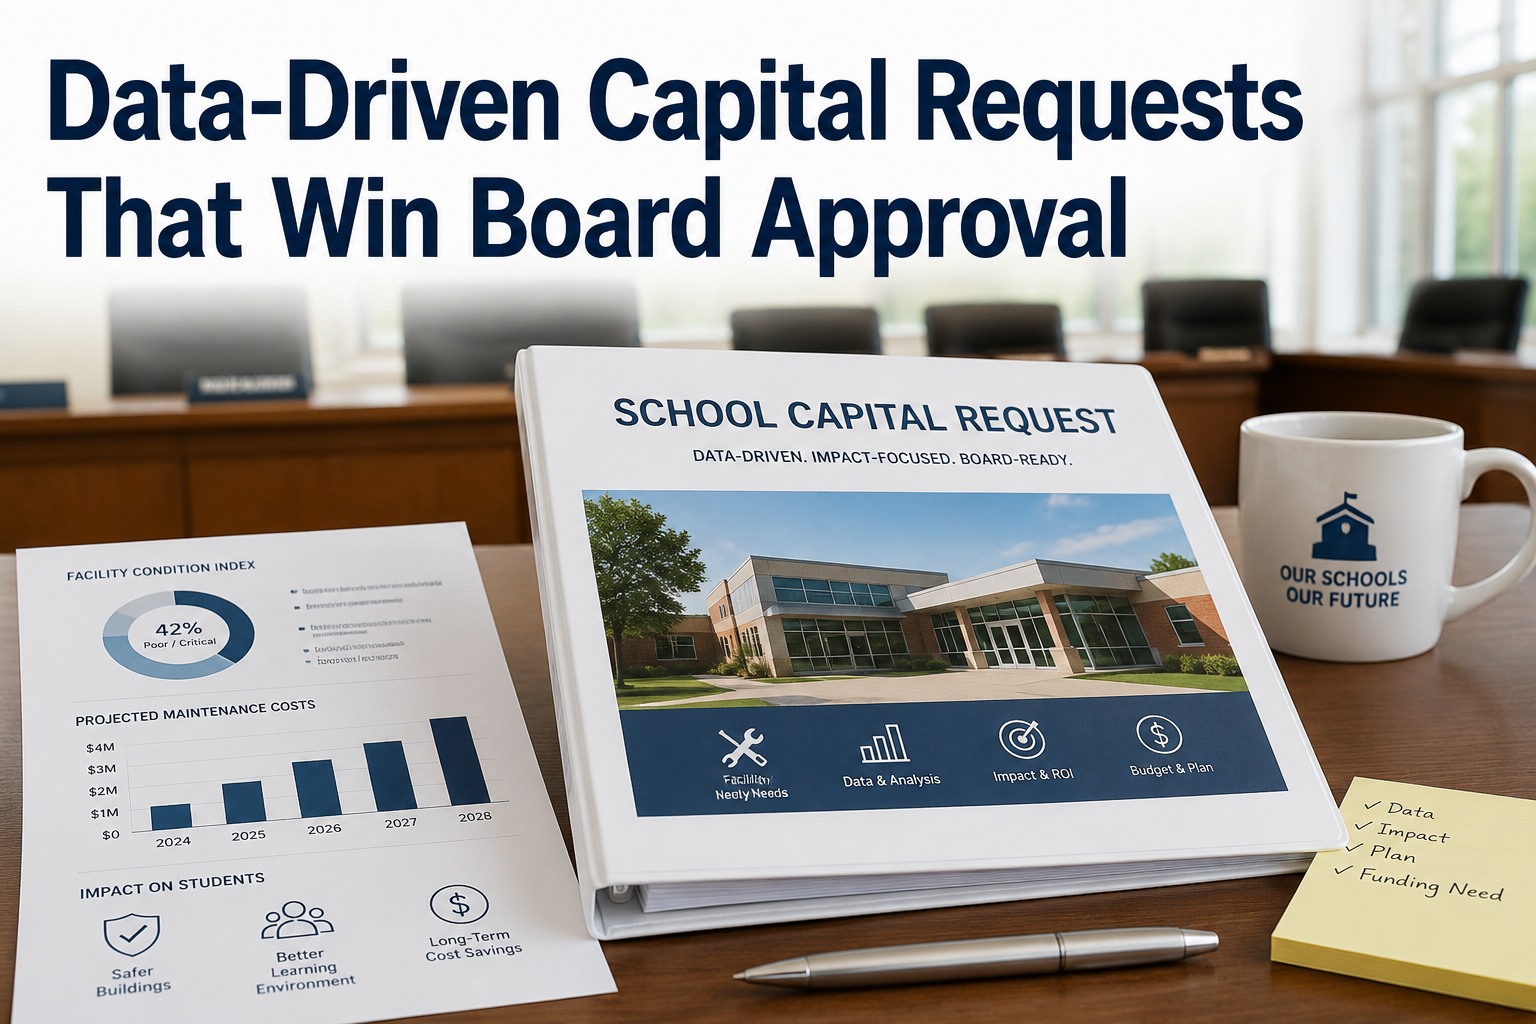
School boards approve capital requests backed by hard data 40–60% more often than submissions that read like wish lists. When a facilities director replaces "we need a new boiler" with a documented risk profile, life-cycle cost model, and a defensible return-on-investment calculation, the conversation shifts from whether to fund the request to how soon. The framework below walks through condition-assessment data, risk framing, ROI modeling, and the presentation structure that moves capital asks from deferred to approved. You can put it into practice today when you Start Free Trial and build your next board package on evidence instead of anecdotes.
Can your next capital request survive a line-item challenge from the board?
Most school capital submissions get deferred not because the need is disputed, but because the evidence is thin. A data-driven package — condition scores, risk tiers, lifecycle comparisons — closes that gap and shortens the path from request to funded project.
Why boards reject wish lists and fund evidence
A school board's fiduciary duty is to allocate limited dollars where risk and return are clearest. When a capital request arrives without condition data, failure-history, or lifecycle math, board members default to deferral — the safest vote when the evidence is ambiguous.
A 1,200-student high school submitted a $310,000 boiler-replacement request with a single paragraph of justification. The board deferred it. The following cycle, facilities staff returned with a condition assessment (FCI 0.18), ten years of repair invoices totaling $46,000, a risk tier showing 22% probability of mid-winter failure, and a 15-year lifecycle comparison showing replacement at $26K/yr vs. repair-and-defer at $41K/yr. The request was approved 7–0 in the same fiscal year.
The five data points every capital request must open with
Boards trust quantified asset condition far more than narrative descriptions. Open every request with these five standard data points, drawn from a current facilities condition assessment aligned to ASTM E2018.
Facility Condition Index (FCI)
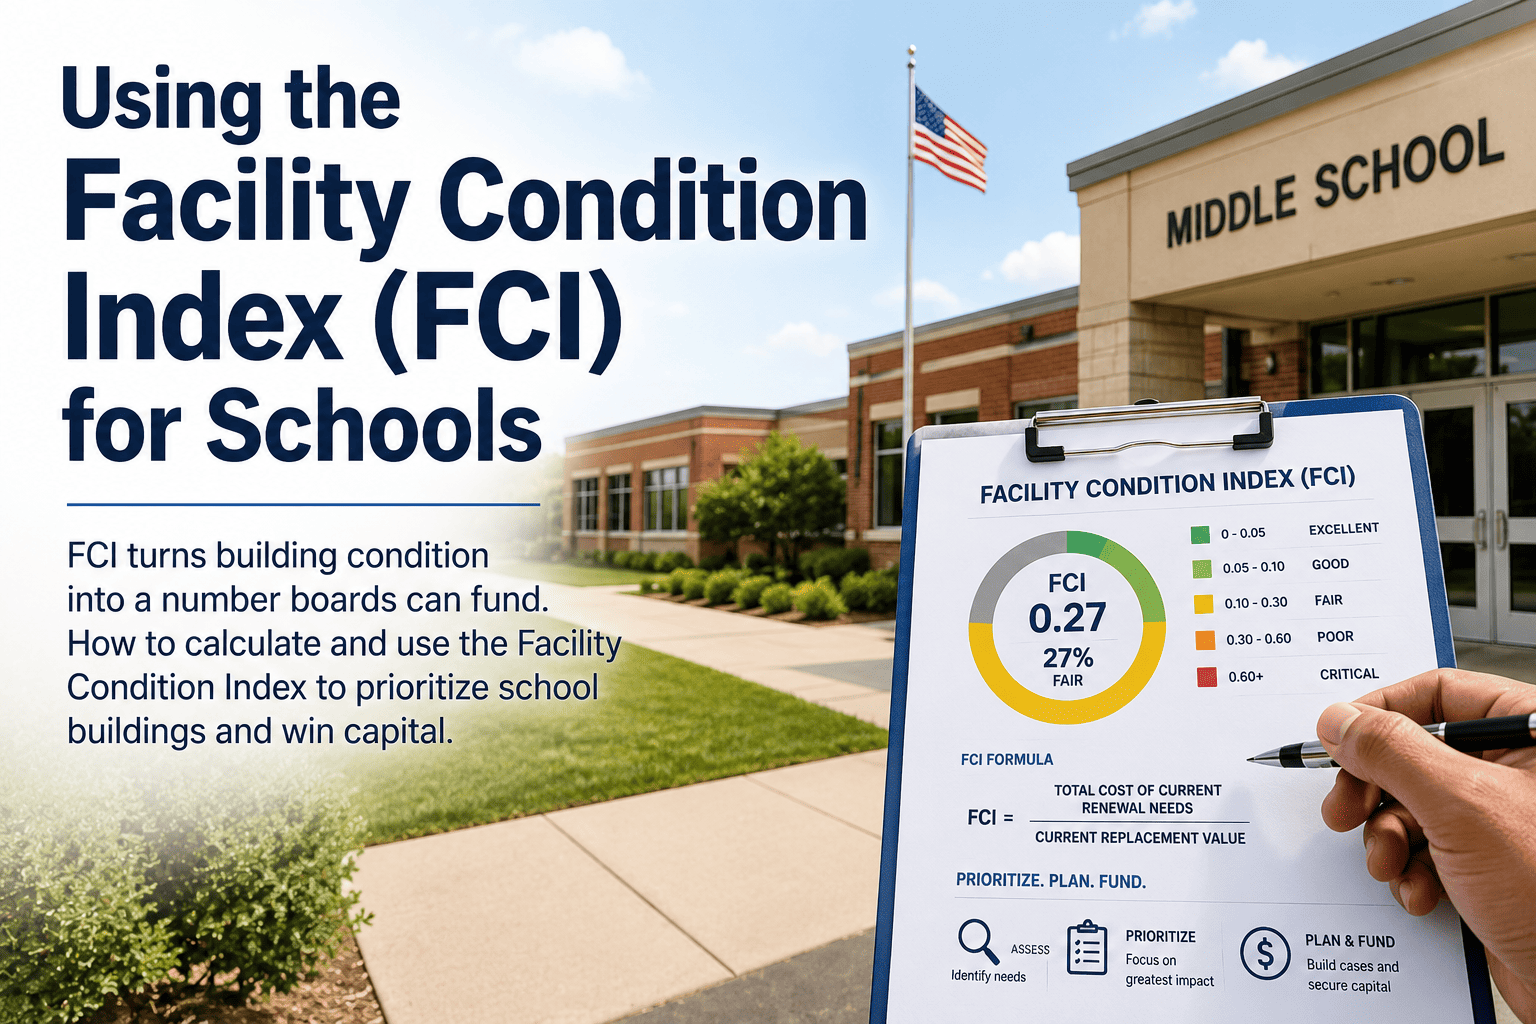
Ratio of deferred-maintenance cost to current replacement value. An FCI above 0.15 signals a "poor" condition rating and justifies capital intervention over continued repair spend.
Remaining Useful Life (RUL)
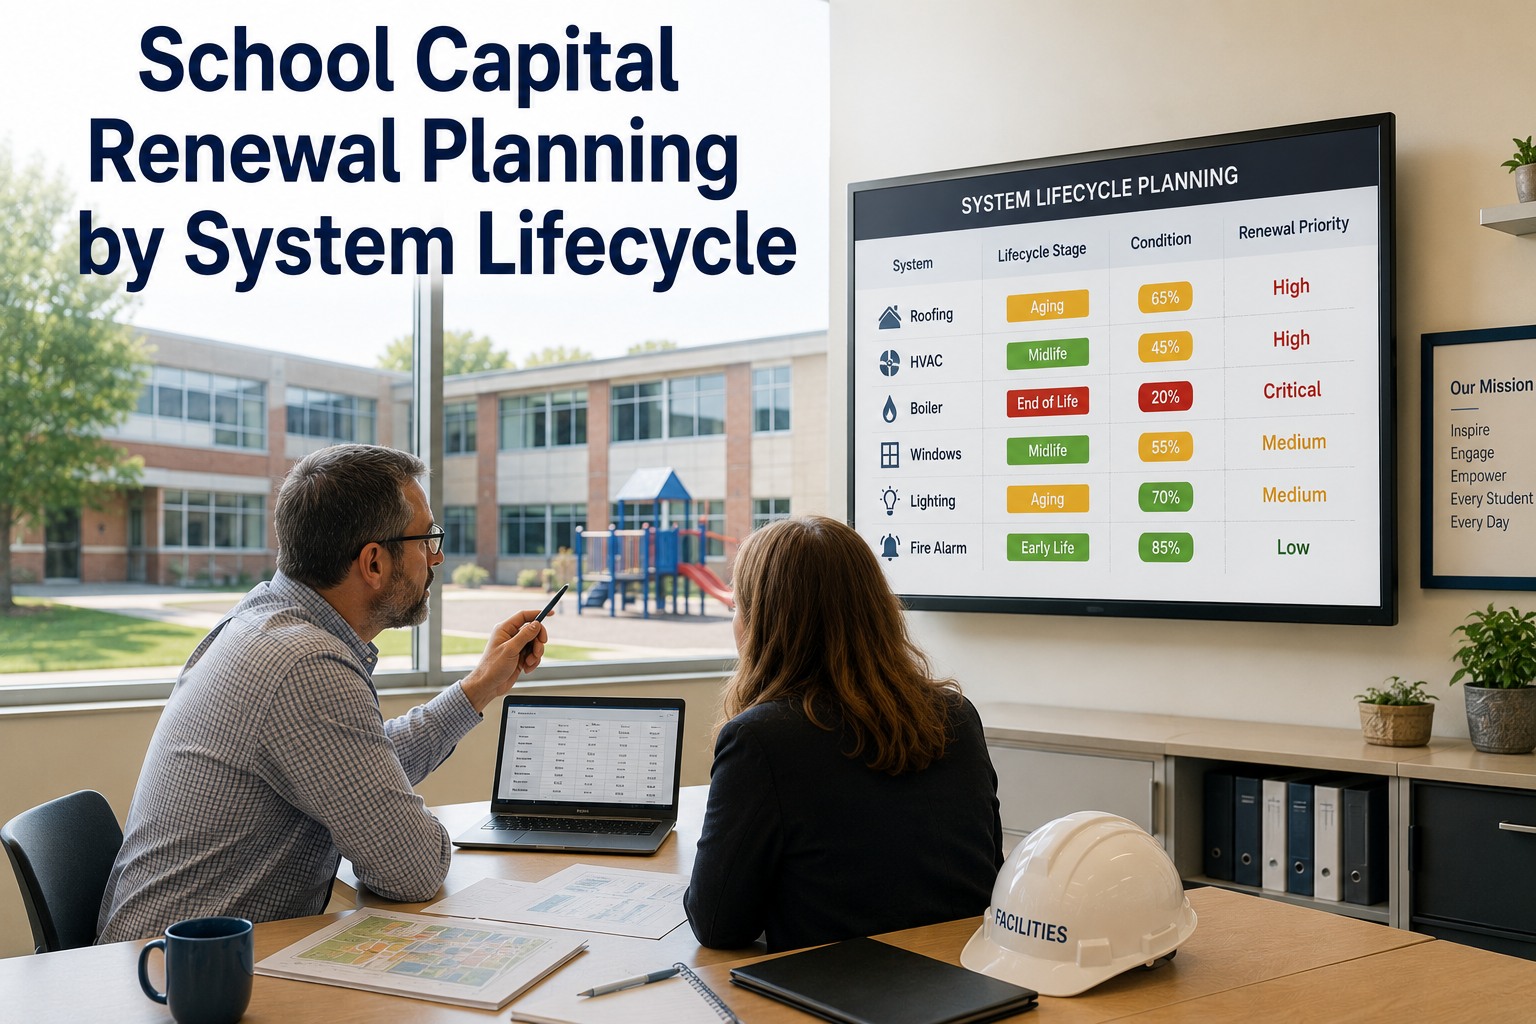
Years left before the asset reaches end-of-service based on age, usage cycles, and manufacturer specs. Assets below 20% RUL should appear in the capital queue, not the operating budget.
Repair History & Cost Trend
Three-to-five-year rolling repair spend per asset. A rising trend line is the single most persuasive chart in a board deck — it visualizes the cost of doing nothing.
Failure Probability & Impact
A risk-matrix score combining likelihood of failure (percentage) with severity (safety, uptime, code compliance). High-impact assets get funded first, regardless of age.
Code & Compliance Status
Open violations, ADA gaps, life-safety deficiencies, and ASHRAE 90.1 energy-code exposures. Compliance risk converts a "nice to have" into a "must fund" in a single board meeting.
Turn "we need a new boiler" into a defensible capital ask
The math that wins board approval is rarely the sticker price — it's the lifecycle comparison. Show the board what happens if they approve the request versus what happens if they defer, over a 10-to-20-year horizon.
A positive number means replacement is cheaper than continued deferral. Boards fund positive-NPV requests.
Sub-7-year payback on energy-related upgrades typically clears the board without objection.
| Scenario (15-year horizon) | Upfront Cost | Annual Operating Cost | Risk-Adjusted Failure Cost | 15-Yr Total Cost of Ownership |
|---|---|---|---|---|
| Defer & Repair (status quo) | $46,000 | $38,400/yr | $95,000 | $714,000 |
| Replace with high-efficiency unit | $310,000 | $21,600/yr | $8,000 | $642,000 |
| Replace + Building Automation System | $372,000 | $17,200/yr | $5,000 | $635,000 |
In the worked example above, replacement saves $72,000 over 15 years on a pure cash basis — and that excludes the avoided cost of a mid-winter shutdown, which independent actuaries price at $18,000–$45,000 per incident for a 1,200-student building. The board saw the math and approved the upgrade tier.
The risk matrix that shifts deferral into urgency
Boards understand risk matrices from insurance and safety contexts. Presenting assets on a 4×4 likelihood-vs-impact grid gives non-technical members an immediate visual cue: anything in the upper-right quadrant is a "fund now" item.
"We stopped bringing wish lists to the board. Every capital request now opens with an FCI, a risk tier, and a 15-year TCO comparison. Our approval rate went from 45% to 81% in two cycles."
— Director of Facilities, 8-school suburban districtThe seven-slide structure boards approve
A capital request deck longer than 12 slides loses the room. Use this seven-slide blueprint — every slide answers one question a board member will ask.
The Ask & The Why Now
One slide: dollar amount, asset, and the triggering condition (failure event, code deadline, efficiency threshold crossed).
Condition Assessment Snapshot
FCI, RUL, and the most recent inspection photos. Let the data speak — keep narrative to two sentences.
Repair History & Trend
Three-year rolling repair cost chart. A rising line is the most persuasive graphic in capital planning.
Risk Tier & Failure Impact
Risk-matrix placement plus dollarized failure cost. Translate "it might fail" into "a mid-winter shutdown costs $32,000."
Lifecycle Cost Comparison
The TCO table from Section 03. Three scenarios: defer, replace-standard, replace-upgraded.
Funding Source & Payback
Identify the budget line, grant, or bond capacity. Show simple payback and net lifecycle savings.
Timeline & Risk of Delay
Procurement-to-commissioning schedule. Close with the cost of a one-year deferral — the number that makes "not now" feel expensive.
Build your next capital request on data, not anecdotes
Oxmaint centralizes condition assessments, repair history, and lifecycle cost models so your board package assembles itself.
Capital request approval — what boards ask
How much condition data is enough for a board submission?
At minimum: a current FCI score, RUL percentage, three years of repair spend, and a risk-tier rating. If any of those four are missing, board members typically defer — not because the need is questioned, but because the evidence is. You can generate all four from a single facilities condition assessment in Oxmaint when you Start Free Trial.
What lifecycle horizon should the TCO comparison use?
Match the horizon to the asset class: 15 years for HVAC and boilers, 20–30 years for roofing and building envelope, 7–10 years for technology infrastructure. Boards respond best when the horizon equals or exceeds the manufacturer's stated useful life, because it captures at least one replacement cycle.
How do we quantify "risk of failure" without an engineering study?
Use a 4×4 likelihood-impact matrix. Estimate probability from age-vs-RUL benchmarks and repair-frequency trends; estimate impact from downtime cost per day (lost instruction hours, alternative space rental, code penalties). The product gives a dollarized risk figure that boards can compare directly against the capital cost.
Should we present multiple replacement tiers or a single recommendation?
Present three: status-quo/defer, standard replacement, and upgraded/high-efficiency. Boards like choices, but the TCO table should make the middle or upper tier the clear winner on a 15-year basis. A single recommendation with no alternative reads as inflexible and invites deferral.
What if the board still defers a data-backed request?
Document the deferral cost — the difference between the TCO of defer and the TCO of replace, plus any escalation in the risk tier — and bring it back next cycle. Deferred-but-documented requests have a roughly 70% approval rate on resubmission, because the cost of inaction is now on the record. Book a walkthrough at calendly.com/oxmaintapp/30min to set up a deferral-tracking dashboard.
Turn your next capital request into an approved line item
Condition data, risk tiers, lifecycle models, and a board-ready deck — assembled in one platform.
Free 14-day trial · No credit card