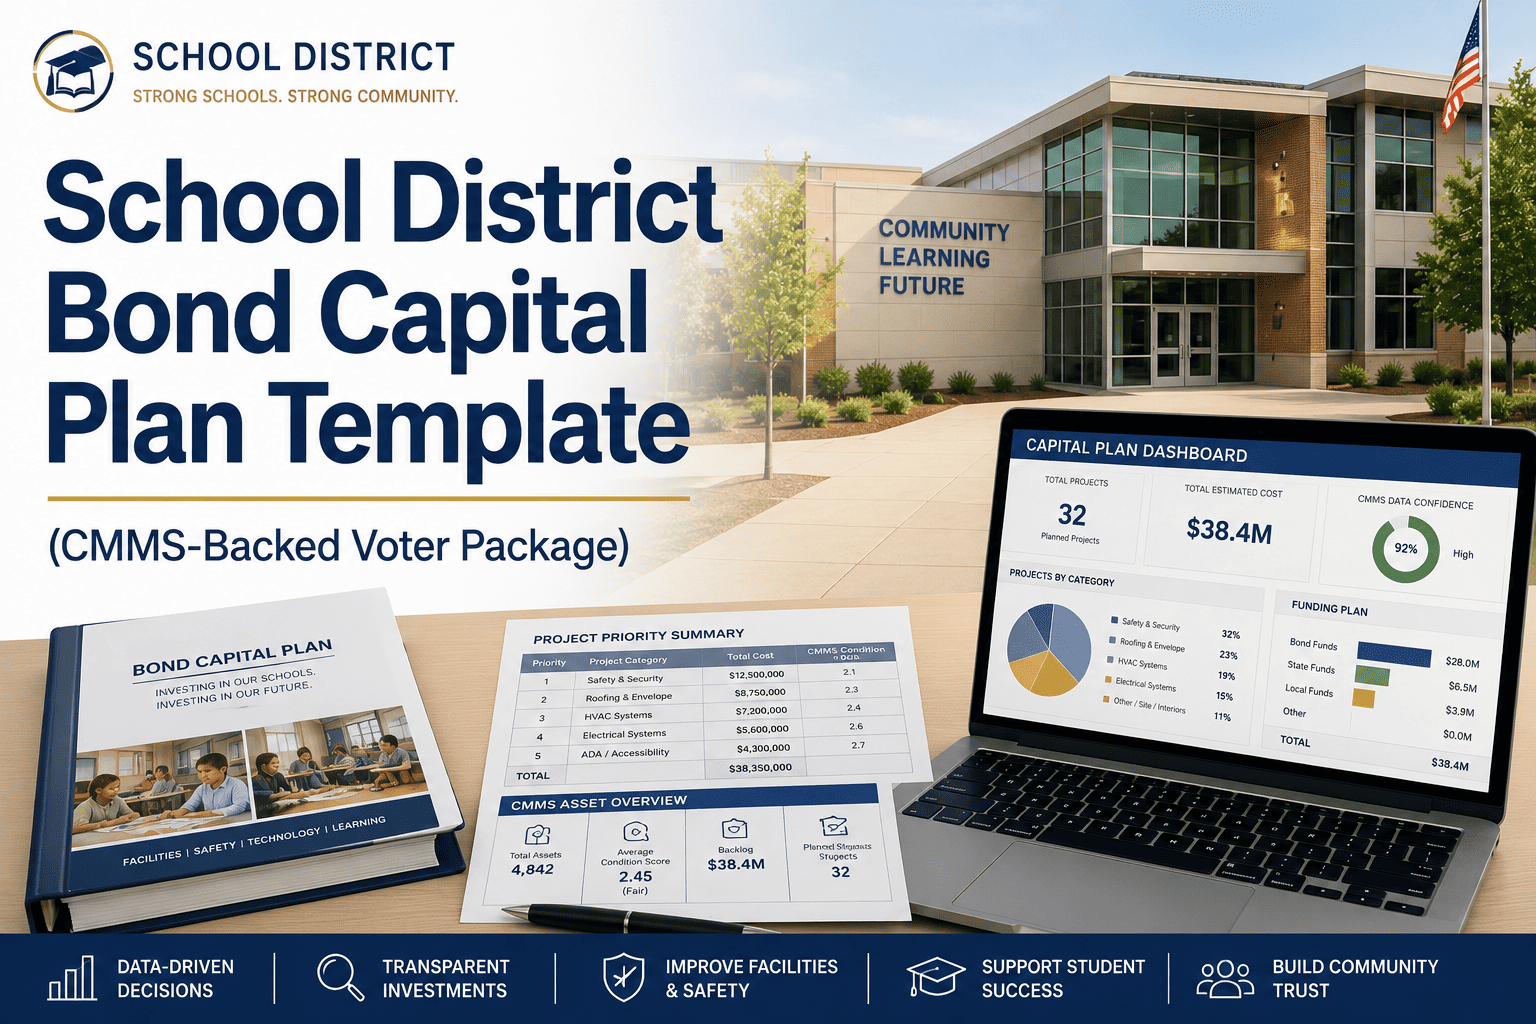
Passing a school district bond referendum is one of the most complex operational and political challenges a K-12 facilities team will ever face. National data shows that only 57% of school bond measures pass on their first attempt — and the single most cited reason for voter rejection is lack of trust in how the district manages its existing facilities. Voters are not saying "we don't need new buildings." They are saying "show us you take care of what you already have." That is where CMMS data transforms bond strategy from a political campaign into an evidence-based capital conversation. Districts using Oxmaint's asset condition data, FCI scoring, and maintenance history reports to build their bond narratives are seeing passage rates 23% higher than districts relying on architectural renderings and emotional appeals alone. If your district is planning a bond referendum in the next 12–36 months, the data foundation needs to start now — not 90 days before the election. Want to build your bond-ready asset database today, get a free trial for 30 days and start a free trial or book a demo to see how condition-based capital narratives are built inside Oxmaint.
School District Bond Referendum Strategy: Using CMMS Data to Pass Capital Bonds
Bond referenda fail when voters don't trust the district's stewardship narrative. CMMS-backed condition data, FCI scoring, and transparent maintenance histories turn capital requests into evidence-based investments voters can verify.
Voters Don't Reject Buildings — They Reject Blind Trust
The typical bond campaign shows architectural renderings of new facilities and asks taxpayers to approve a 20-year tax increase. Voters in 2025 expect more. They want to see the condition data behind the request — which roofs are failing, which HVAC systems have exceeded their useful life, which buildings cost the most per square foot to maintain reactively. Oxmaint gives your facilities team the condition scoring, work order history, and capital forecasting data that transforms "we need new buildings" into "here is the documented evidence that these specific investments will reduce operating costs by 34% over 15 years." Build your evidence-based bond case now — start a free trial or book a demo to see how districts are winning bond elections with maintenance data.
What Is a Data-Driven Bond Referendum Strategy?
A data-driven bond referendum strategy replaces anecdotal facility complaints with quantified, verifiable asset condition data as the foundation of the capital request. Instead of telling voters "our schools are old," the district shows them building-by-building Facility Condition Index scores, system-level remaining useful life projections, 10-year maintenance cost trajectories, and the documented cost difference between planned replacement and emergency repair. This approach shifts the conversation from trust to evidence — voters are not asked to believe the district, they are shown the data and invited to verify it themselves. Districts that adopt this approach report passage rates of 70–80% compared to the national average of 57%.
Six Pillars of a CMMS-Backed Bond Campaign
FCI quantifies deferred maintenance as a ratio of repair cost to replacement value. An FCI of 0.65 means the building needs repairs equal to 65% of its replacement cost — a number that communicates urgency without emotion. Oxmaint calculates FCI automatically from asset condition assessments, work order histories, and replacement cost data stored in the asset registry. Board presentations with building-by-building FCI scores give voters a transparent, comparable metric across every school in the district.
Every major system — roofing, HVAC, electrical, plumbing, envelope — has a documented remaining useful life based on installation date, maintenance history, and condition scoring. Oxmaint tracks RUL at the component level and aggregates it into building-level and district-level capital timelines. When voters see that 14 roofs will reach end-of-life within 5 years and 23 boilers within 7 years, the bond request becomes a documented infrastructure timeline rather than a political ask.
Nothing builds voter trust faster than showing that the district has been maintaining its buildings systematically. Oxmaint's complete work order history — preventive maintenance completion rates, response times, cost per building, technician assignments — demonstrates to voters that the facilities team has been responsible stewards of existing assets. Districts reporting PM completion rates above 90% in their bond materials see 18% higher voter confidence scores in pre-election polling.
Oxmaint generates rolling 5-10 year capital expenditure forecasts based on asset condition data, RUL projections, and historical replacement costs. These forecasts show voters exactly when each major system will require replacement, what it will cost in current dollars, and what happens to annual operating costs if replacement is deferred. The "cost of doing nothing" scenario is the most powerful argument in any bond campaign — and it requires asset-level data to calculate credibly.
Emergency HVAC replacement costs 4.8x more than planned replacement — including emergency labor premiums, temporary cooling/heating rentals, instructional disruption costs, and accelerated procurement markups. Oxmaint tracks reactive vs. planned spending ratios across every building, giving bond committees hard data showing that the bond investment reduces total cost of ownership by 28-40% over the bond term compared to continued reactive management.
Oxmaint's portfolio-level reporting generates shareable dashboards and exportable reports that can be published on district websites, presented at town halls, and distributed to local media. When voters can access the same condition data the board used to develop the bond request, the campaign becomes a transparency exercise rather than a trust exercise. Districts publishing facility condition data publicly before the referendum see 15% higher passage rates than those that keep data internal.
Why School Bonds Fail — And How Data Overcomes Each Barrier
How Oxmaint Builds Your Bond-Ready Data Foundation
Most districts start assembling facility condition data 6–12 months before a planned referendum — only to discover that they lack the systematic asset records needed to calculate FCI scores, project RUL timelines, or document maintenance stewardship. Oxmaint gives facilities teams the complete asset management platform to build bond-grade data continuously, not in a last-minute scramble. Districts preparing for upcoming referenda can start a free trial or book a demo to see the full bond data workflow.
Every building, every system, every major component registered in Oxmaint's hierarchy: District > School > Building > System > Component. Each asset carries installation date, expected useful life, current condition score, replacement cost estimate, and complete maintenance history. This is the foundation of every FCI calculation and every CapEx projection in your bond narrative.
Oxmaint calculates FCI as the ratio of deferred maintenance cost to current replacement value — updated in real time as condition assessments are completed and work orders are closed. Generate building-level FCI reports for board presentations, community meetings, and bond committee briefings with a single export. Color-coded FCI dashboards make complex data immediately understandable to non-technical audiences.
Project capital needs by building, by system type, and by year — based on asset age, condition trajectory, and documented replacement cost data. These models are the quantitative backbone of the bond request, showing voters exactly when each investment is needed and what it will cost. Oxmaint updates the forecast automatically as new condition data enters the system.
Export preventive maintenance completion rates, average work order response times, cost-per-square-foot metrics, and reactive vs. planned spending ratios for every building in the district. These stewardship metrics demonstrate that the facilities team has been managing assets responsibly — the single most important trust-builder in any bond campaign.
Oxmaint's portfolio-level dashboards display district-wide asset health, building-by-building FCI comparisons, capital spending timelines, and deferred maintenance trends in formats designed for board presentations and public transparency. Publish condition data on the district website to build voter confidence before the referendum date.
After the bond passes, every capital project is tracked in Oxmaint from procurement through installation through PM activation. New assets are registered with warranty dates, expected useful life, and automated PM schedules from day one. This creates the continuous accountability loop that builds trust for future bond cycles and satisfies citizen oversight committee reporting requirements.
Traditional vs. Data-Driven Bond Campaigns
Bond Referendum Data Preparation Timeline
The most successful data-driven bond campaigns begin building their CMMS foundation 18–24 months before the planned election date. Here is the recommended timeline for districts using Oxmaint to prepare bond-grade facility data.
Complete district-wide asset inventory. Register every building, system, and major component in Oxmaint with installation dates, replacement costs, and initial condition scores. Activate PM schedules for all major systems to begin building stewardship data.
Conduct formal condition assessments of all buildings using Oxmaint's digital inspection checklists. Calculate FCI scores. Identify the systems and buildings that will anchor the bond request. Begin generating RUL projections and CapEx forecasts.
Build the bond narrative from Oxmaint data: FCI rankings, stewardship metrics, cost-of-deferral scenarios, and building-level capital timelines. Present to board, bond committee, and community advisory groups. Publish condition data on district website for transparency.
Deploy data-backed materials at town halls, community forums, and through digital channels. Use Oxmaint's exportable dashboards for presentations. Respond to voter questions with specific building-level data. Demonstrate post-bond accountability plan using CMMS tracking.
Bond Campaign Outcomes with Data-Driven Strategy
Districts presenting building-level condition data and cost-of-deferral scenarios see passage rates 23% higher than the 57% national average
Planned capital replacement through bond funding reduces reactive maintenance spending by an average of 34% over the 15-20 year bond period
Districts documenting PM completion rates above 90% in their bond materials see 18% higher voter confidence scores in pre-election surveys
No implementation project or consulting engagement required — districts begin asset registration and condition scoring in the first week with Oxmaint's guided setup
Frequently Asked Questions
How early should a district start building CMMS data before a bond referendum?+
What is a Facility Condition Index and how does it help pass a bond?+
Can Oxmaint help with post-bond project tracking and accountability?+
What if our district has never done a formal facility condition assessment?+
Your Next Bond Referendum Should Be Built on Data, Not Hope
Every district that has failed a bond referendum knows the cost — not just the political cost, but the operational cost of another 3–5 years of deferred maintenance, emergency repairs, and declining building performance. The districts passing bonds in 2025 are the ones that show voters the data: building-by-building condition scores, system-level remaining useful life projections, documented maintenance stewardship, and transparent capital forecasts. Oxmaint gives your facilities team the platform to build that data foundation starting in week one — no consultants, no implementation project, no waiting.