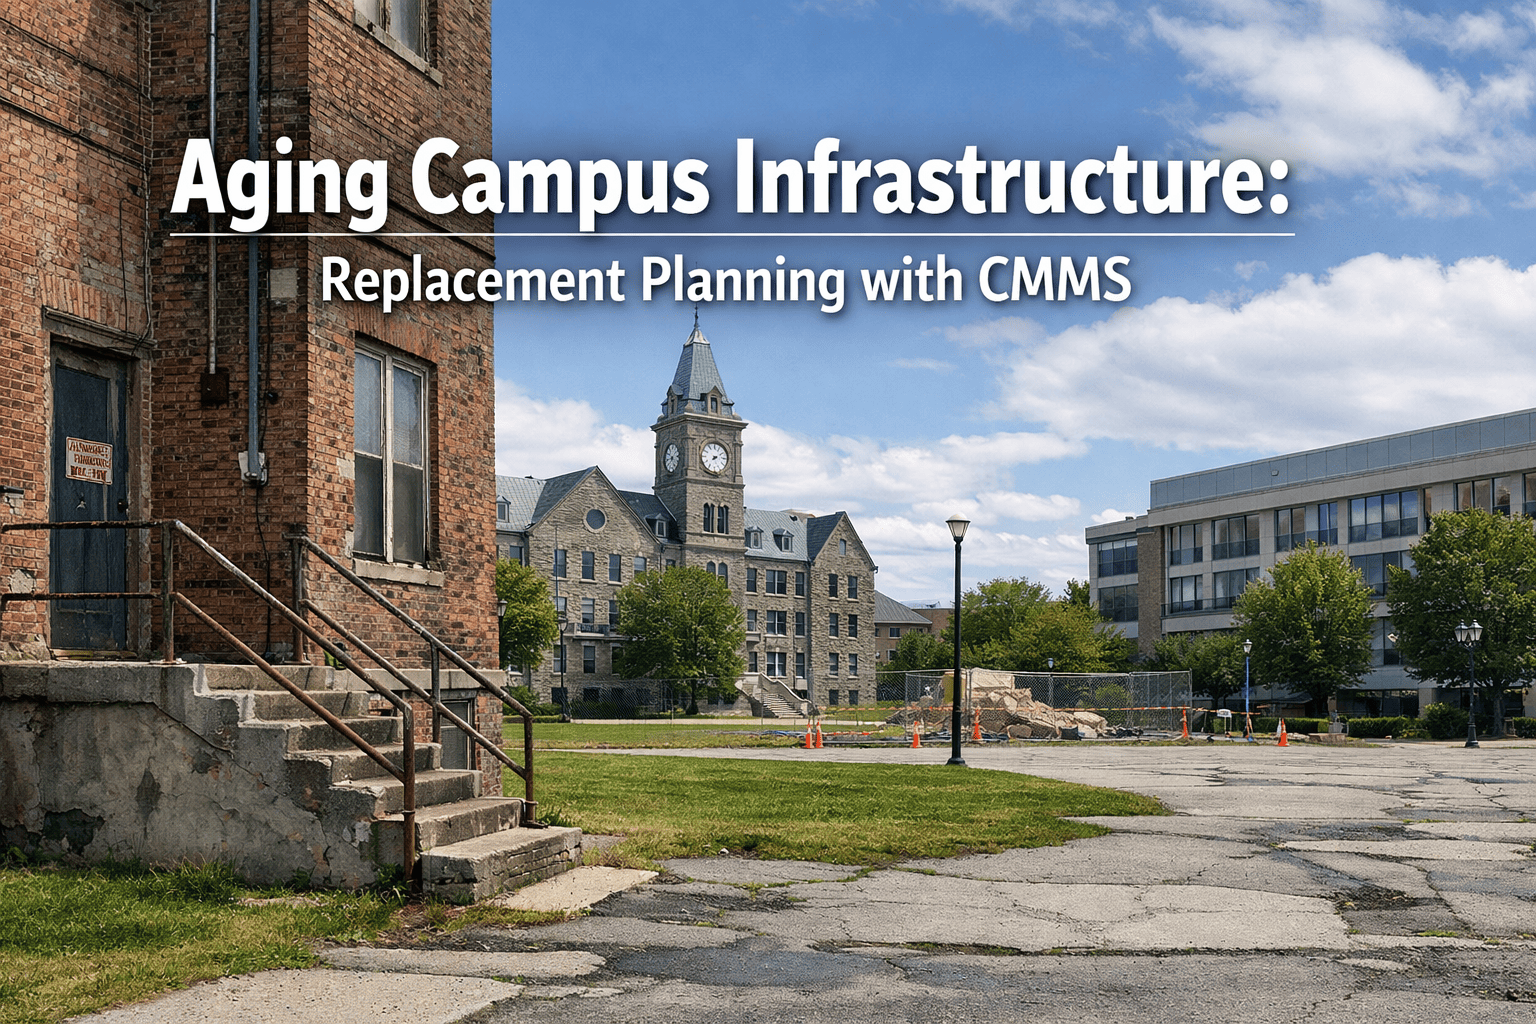
The HVAC failure happens at 2:14 PM on a Tuesday in mid-September—right as afternoon heat peaks and 1,200 students occupy the main academic building. By 3:00 PM, classroom temperatures exceed 82°F. By 4:00 PM, faculty are dismissing classes early. The emergency HVAC contractor arrives at 5:30 PM with a diagnosis: a worn compressor belt that should have been replaced during scheduled preventive maintenance. That maintenance was scheduled for June but postponed due to "budget constraints." The emergency repair costs $8,400—six times the preventive replacement cost—plus three days of disrupted classes, 47 parent complaints, and a facilities director explaining to the board why a preventable failure shut down operations.
Educational facilities operate under unique maintenance pressures that make preventive maintenance scheduling essential rather than optional. Limited budgets, deferred maintenance backlogs averaging $38 billion nationally, aging infrastructure (average school building age: 44 years), and the absolute requirement to minimize disruption during instructional hours create an environment where reactive maintenance isn't just expensive—it's operationally catastrophic. Unlike commercial buildings that can schedule repairs flexibly, campus maintenance must align with academic calendars, coordinate around class schedules, and maintain 100% uptime during peak occupancy periods.
This PM scheduling framework transforms campus maintenance from reactive firefighting into predictive reliability management. Educational institutions implementing structured preventive maintenance scheduling reduce emergency breakdowns by 78% while cutting annual maintenance costs by 35-45%. Teams ready to eliminate preventable failures can sign up free to build automated PM schedules and track completion rates.
What if every piece of campus equipment was maintained on an optimized schedule that prevents failures before they disrupt learning—automatically?
The Cost of Reactive vs. Preventive Maintenance
Campus facilities operating reactively spend 3-5x more on maintenance annually while experiencing 4x more equipment downtime. Understanding the true cost differential drives executive support for systematic PM programs. Institutions using Oxmaint's free trial to track reactive vs. preventive costs demonstrate ROI within the first semester.
Campus Equipment PM Frequency Matrix
Different asset categories require distinct PM schedules based on criticality, manufacturer recommendations, and regulatory requirements. This matrix establishes baseline frequencies for campus equipment. Organizations that create a free account to configure PM schedules by equipment type ensure nothing falls through the cracks.
| Equipment Category | Critical Assets | PM Frequency | Optimal Timing |
|---|---|---|---|
| HVAC Systems | Chillers, boilers, air handlers, rooftop units | Monthly (filters) + Quarterly (comprehensive) + Annual (certification) | Summer/Winter breaks |
| Electrical Infrastructure | Switchgear, transformers, emergency generators, panels | Quarterly (visual/testing) + Annual (comprehensive) + 3-Year (detailed) | Scheduled outage windows |
| Plumbing Systems | Pumps, water heaters, backflow preventers, fixtures | Semi-annual (inspection) + Annual (testing/certification) | Summer maintenance window |
| Fire/Life Safety | Alarms, suppression, emergency lighting, extinguishers | Monthly (testing) + Annual (inspection) + Multi-year (certification) | Non-occupancy hours |
| Building Envelope | Roofs, windows, doors, weatherproofing | Semi-annual (inspection) + Annual (maintenance) + 5-Year (comprehensive) | Spring/Fall transitions |
| Elevators & Accessibility | Elevators, lifts, automatic doors, ramps | Monthly (inspection) + Annual (certification) + 5-Year (modernization review) | Low-traffic periods |
Academic Calendar-Aligned PM Scheduling
Campus maintenance must synchronize with the academic calendar to minimize disruption while maximizing access to equipment. Strategic scheduling aligns intensive PM work with breaks and minimizes impact during peak academic periods. Teams that sign up free to map PM schedules to academic calendars eliminate scheduling conflicts entirely.
PM Scheduling Decision Framework
Not all maintenance tasks warrant the same scheduling rigor. This decision framework helps facilities teams prioritize PM investments based on equipment criticality, failure consequences, and resource availability. Institutions implementing AI-powered PM optimization through Oxmaint's free platform automatically apply these prioritization rules.
Rate equipment on 3-tier scale: Critical (life safety, mission-critical HVAC), Important (affects operations but has backup), Routine (convenience systems). Critical assets get guaranteed PM; routine assets use condition-based scheduling.
Identify how equipment fails: catastrophic sudden failure vs. gradual degradation. Sudden-failure assets (electrical panels, fire alarms) require time-based PM. Gradual degradation (belts, filters) can use condition monitoring.
Balance PM workload across calendar year using maintenance windows. Assign 60-70% of annual PM hours to summer, 15-20% to winter break, 5-10% to spring break, remainder to academic year evenings/weekends.
Configure CMMS to auto-generate work orders based on calendar triggers, operating hours (every 2,000 hours), or condition thresholds (temperature variance >5%). Technicians receive assignments automatically with checklists, parts lists, and access requirements.
Track PM effectiveness through KPIs: schedule compliance rate, emergency breakdown frequency, PM-to-reactive work ratio. Adjust frequencies quarterly based on actual failure data and emerging patterns.
PM Completion Tracking & KPIs
Measuring PM program effectiveness requires tracking completion rates, downstream reliability improvements, and cost avoidance. These KPIs demonstrate program value while identifying optimization opportunities. Organizations tracking these metrics with Oxmaint's free KPI dashboards prove ROI to leadership consistently.
Percentage of scheduled PM tasks completed on time
Hours spent on preventive vs. reactive maintenance
Decrease in emergency breakdowns year-over-year
Critical systems availability during occupancy hours
Total maintenance cost savings vs. reactive baseline
Equipment lifespan increase through proper maintenance
Ready to transform campus maintenance from reactive chaos into predictable reliability? Join educational institutions achieving 95%+ PM compliance.
Expert Perspective
"In my nearly three decades managing campus facilities, I've learned that the difference between good and great maintenance programs isn't budget—it's scheduling discipline. We inherited a $4.2M deferred maintenance backlog and a reactive culture where 75% of our work orders were emergencies. By implementing systematic PM scheduling aligned with the academic calendar, we reversed that ratio: now 72% of our work is planned preventive maintenance. The transformation wasn't expensive technology or massive staffing increases—it was committing to a schedule, tracking compliance religiously, and using a CMMS like Oxmaint to automate the entire workflow. Our emergency breakdowns dropped 81% in two years, and we're actually reducing the deferred maintenance backlog by $400K annually instead of watching it grow."
Implementation Timeline
Transitioning from reactive maintenance to systematic PM scheduling follows a structured implementation path. This timeline reflects typical campus deployments achieving measurable reliability improvements within one academic year.
Complete equipment inventory with criticality ratings. Document current maintenance practices, failure history, and manufacturer PM recommendations. Establish baseline metrics for emergency work orders, equipment downtime, and maintenance costs. Want to accelerate this phase? Sign up free to import your asset data and auto-generate PM schedules.
Create PM task libraries with frequencies, checklists, estimated durations, and required skills. Map tasks to academic calendar windows. Configure CMMS with automated work order generation rules. Develop training materials for technicians on new PM procedures and mobile inspection apps.
Deploy PM program on 2-3 critical systems (HVAC, electrical, fire safety). Track completion rates, identify scheduling conflicts, and refine procedures. Train technicians on mobile tools, documentation requirements, and escalation protocols. Use pilot results to optimize before full rollout.
Expand PM program to all equipment categories. Achieve 90%+ schedule compliance through disciplined execution and CMMS automation. Conduct quarterly reviews to adjust frequencies based on failure data. Demonstrate measurable reduction in emergency work orders and maintenance costs to secure ongoing support. Schedule a consultation to map this timeline to your campus.
Conclusion
Preventive maintenance scheduling transforms educational facilities management from costly reactive firefighting into predictable reliability engineering. By aligning PM work with academic calendars, prioritizing critical equipment, and automating schedule generation through CMMS technology, campuses achieve 78% reduction in emergency breakdowns while cutting annual maintenance costs 35-45%. The investment in systematic PM scheduling pays for itself within 6-12 months through avoided emergency repairs, extended equipment life, and operational continuity.
Start building your PM program today. Sign up free to create automated PM schedules and track completion metrics that prove program effectiveness to leadership.