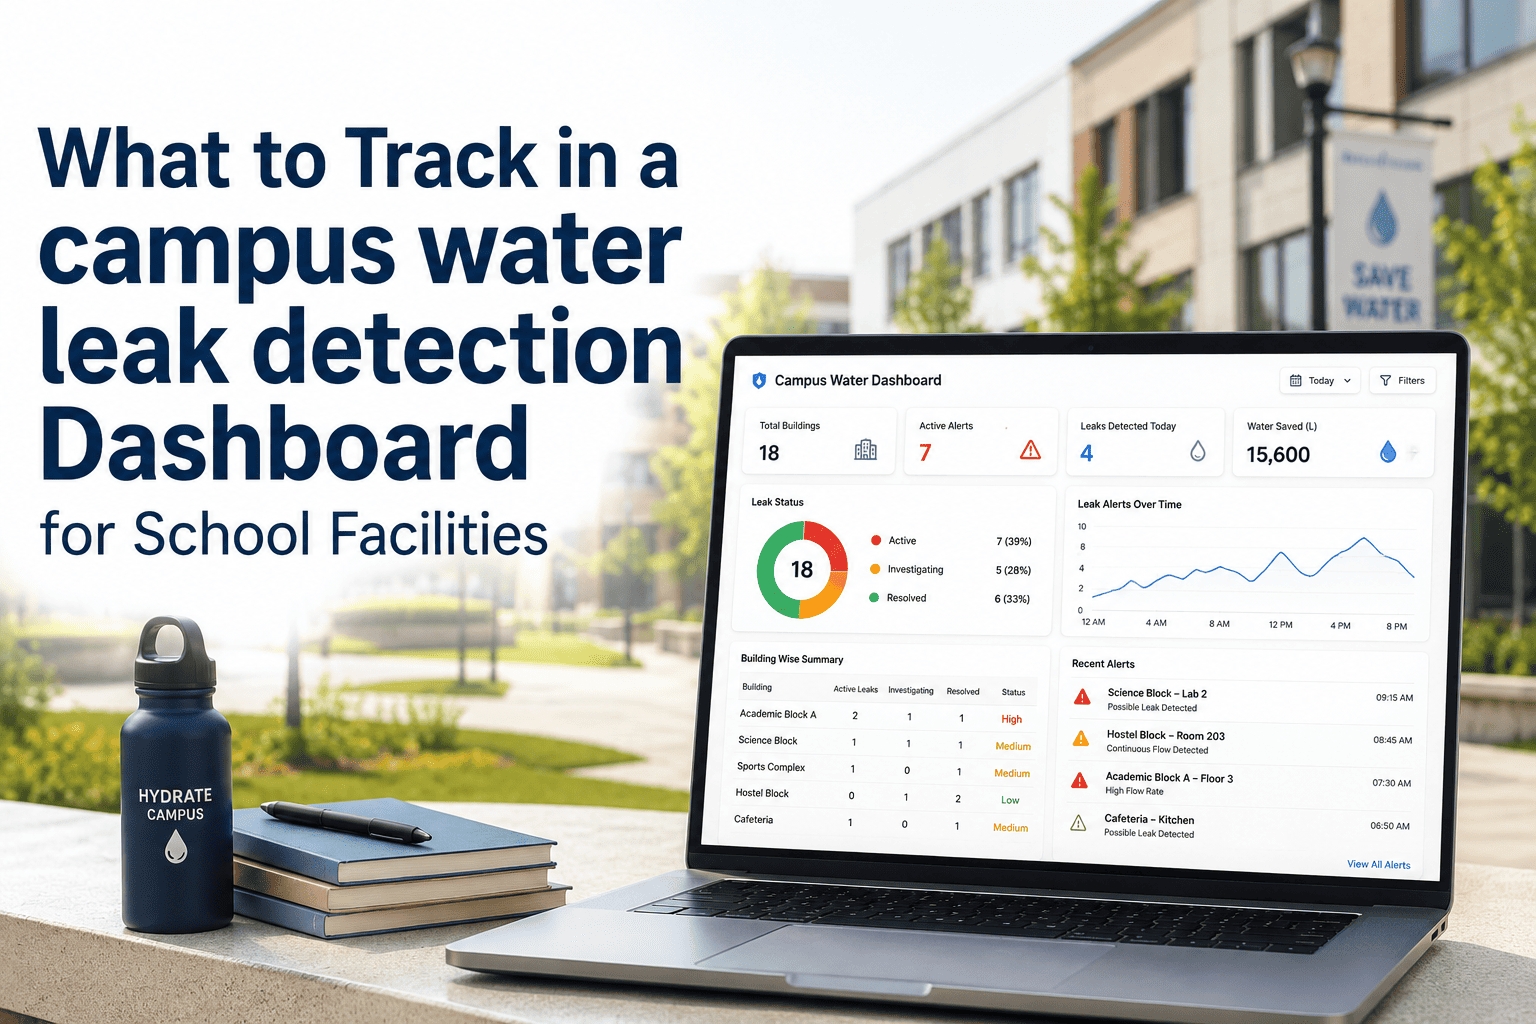
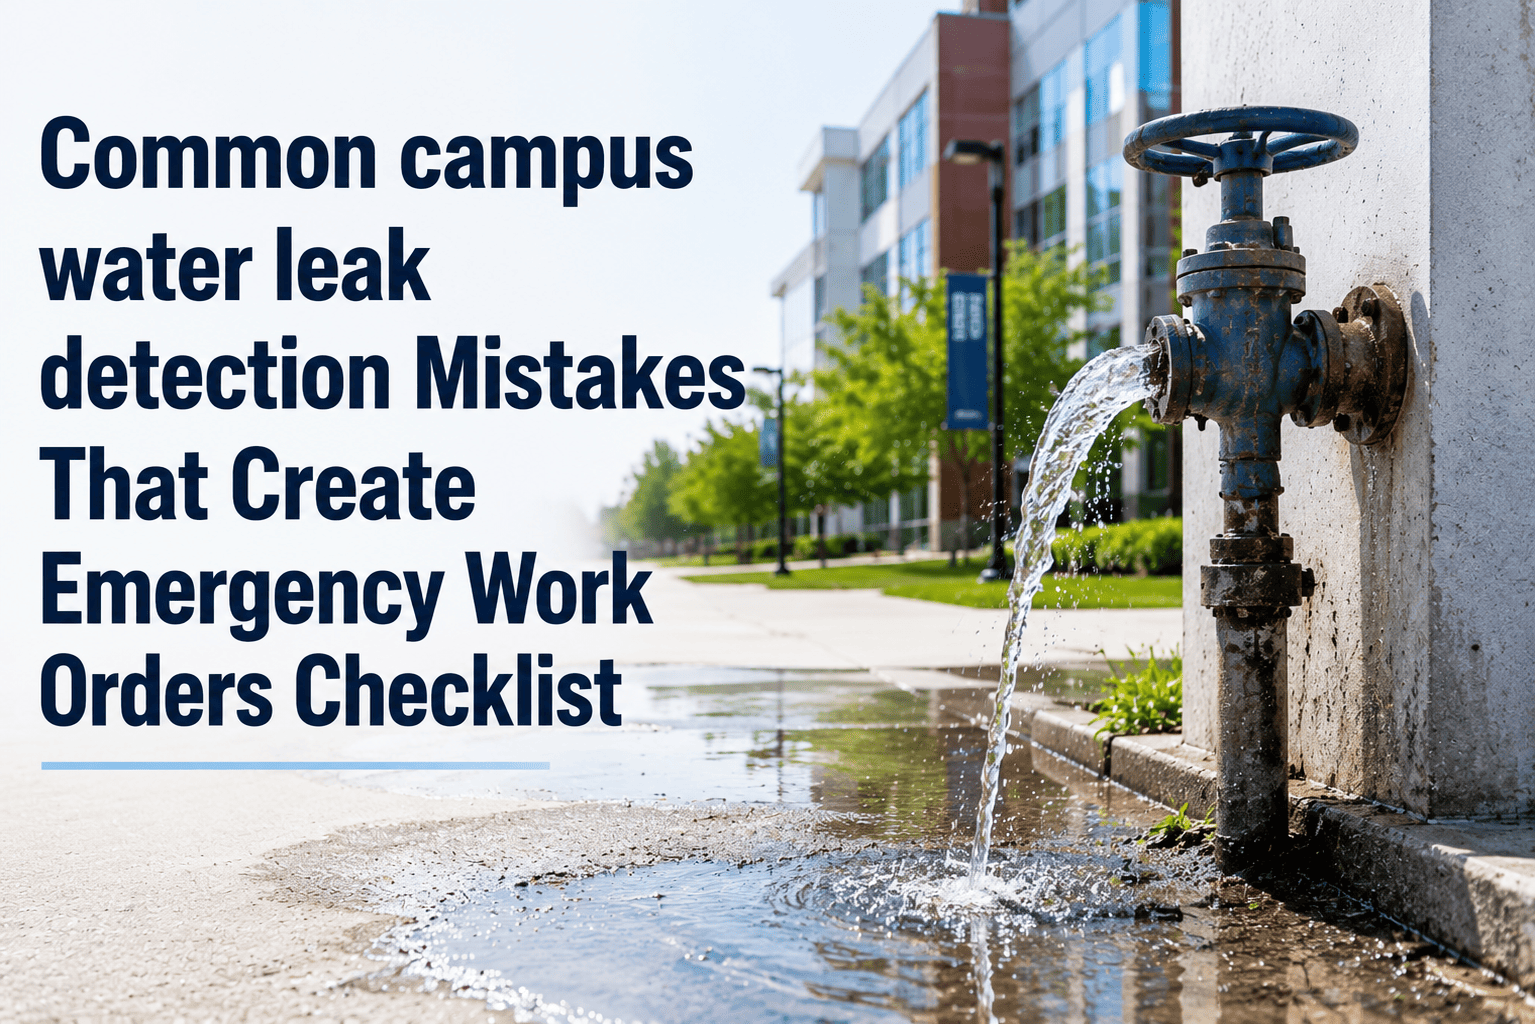
A second-floor restroom line can burst on a Friday night and run undetected until Monday morning — by then the damage bill often lands between $50,000 and $100,000, and three classrooms can stay closed for weeks. Most districts only discover a leak after the ceiling stain shows up, not when the pipe first fails. A campus water leak detection dashboard changes that window from days to minutes by turning sensor data into a work order before water ever reaches a hallway. The question districts ask next isn't whether to monitor — it's exactly what the dashboard should be tracking. OxMaint's facilities dashboard is built around the metrics that actually predict and prevent campus flooding.
$50K–$100K
Average institutional water damage claim
9 Days
A real middle school flood ran undetected over a break
5–15%
Insurance premium discount for monitored buildings
60 Sec
Typical sensor-to-alert detection time
Why Schools Are the Highest-Risk Water Damage Environment
Campus buildings sit empty for long, predictable stretches — weekends, holidays, and entire summers — which means a failure can run unchecked far longer than in an occupied office. Distributed restrooms on every floor, aging supply lines in 1960s-era buildings, and specialized spaces like kitchens, labs, and server rooms multiply the number of places a leak can start. Add a vulnerable population breathing the air after mold sets in, and a maintenance issue becomes a health and safety issue fast.
Empty-Building Windows
Winter break, spring break, and weekends create multi-day gaps where nobody is around to notice a running line.
Distributed Restrooms
Multiple supply lines per floor across every wing means more potential failure points than a typical commercial building.
Specialized Wet Areas
Kitchens, science labs, and locker rooms run heat and moisture loads that ordinary classroom monitoring misses.
Irreplaceable Assets Nearby
Libraries, computer labs, and server rooms sit close to plumbing runs, turning a small leak into a six-figure loss.
See What's Happening on Your Campus Right Now
Turn Sensor Data Into a Work Order Before Anyone Notices a Drip
OxMaint connects moisture and flow sensors straight into your CMMS, so a leak detected at 2 a.m. on a holiday weekend already has a technician dispatched by morning.
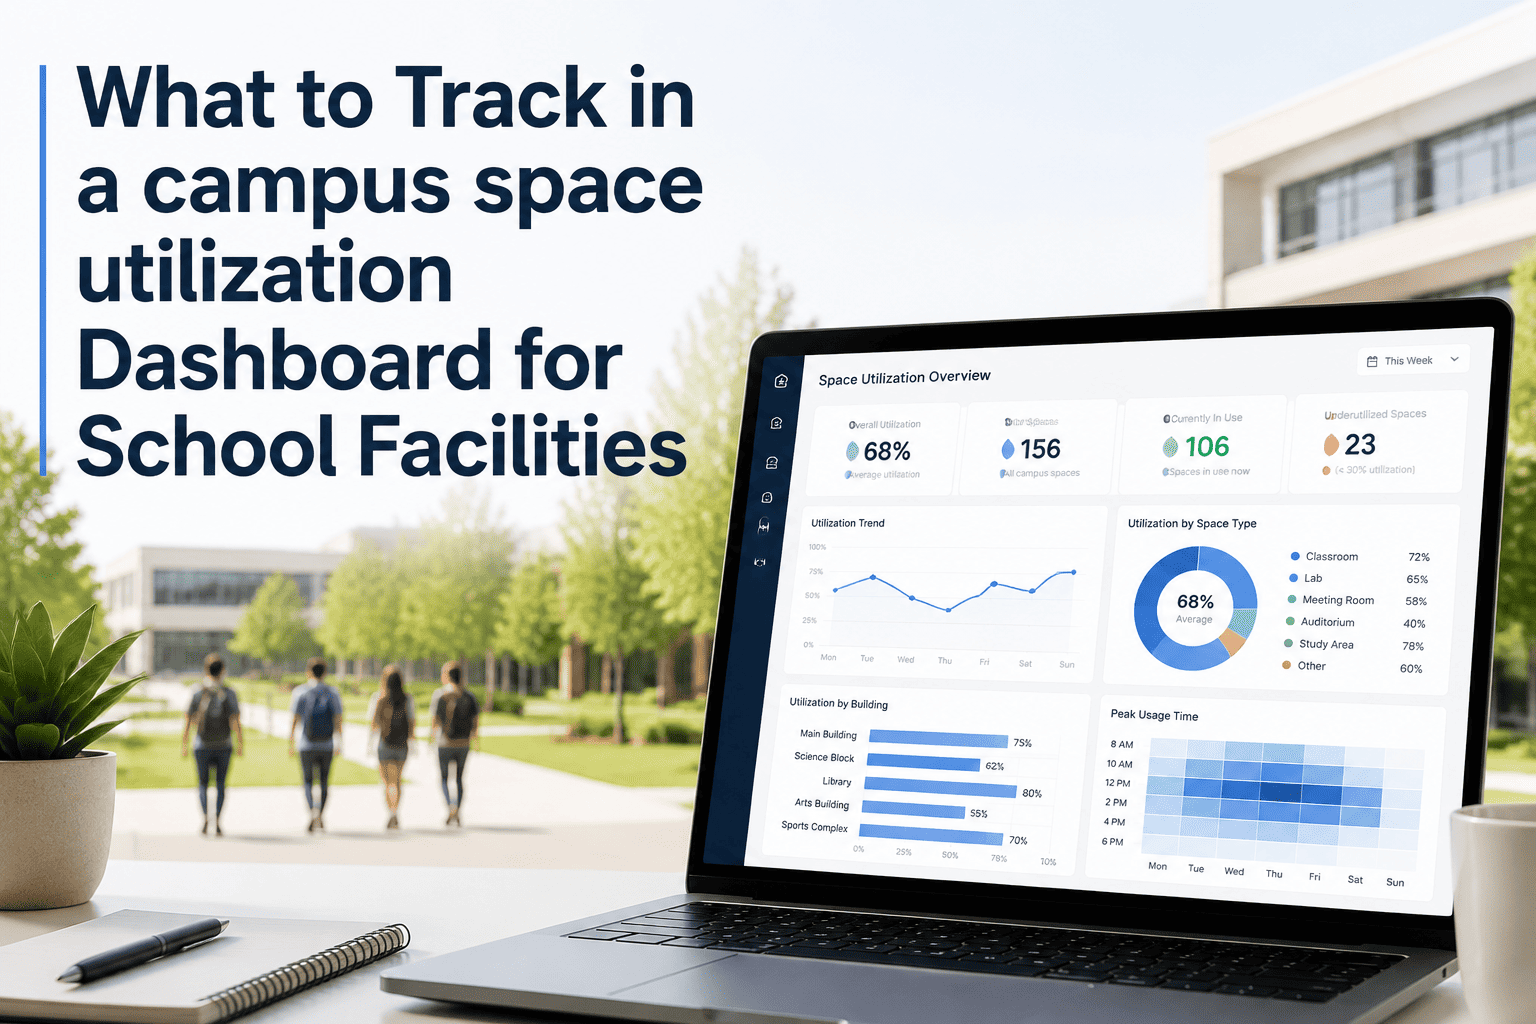
The Six Metrics Your Dashboard Should Never Be Missing
A dashboard that only shows "leak detected, yes or no" is barely more useful than a wet floor sign. The metrics below are what separate a reactive alert system from a genuine prevention tool — each one answers a question a facilities director actually needs answered before, during, or after an event.
01
Time From Leak Start to Detection
The single number that determines damage cost. A dashboard should show this per sensor zone, not just as a campus-wide average.
02
Sensor Coverage by Building and Zone
Which restrooms, mechanical rooms, and risk areas are monitored versus still blind — gaps are where the next flood happens.
03
Flow Anomaly Trends
Unusual continuous flow often shows up hours before a visible flood — tracking this trend catches slow failures early.
04
Work Order Response Time
How fast an alert becomes an assigned, in-progress work order — the step that actually stops water from spreading.
05
After-Hours Alert Volume
Tracking what happens nights, weekends, and breaks shows whether your escalation path actually works when no one is on site.
06
Avoided Damage Cost Estimate
A running tally of what each caught leak likely saved — the figure that justifies the program to a school board.
Detection Speed: Manual Checks vs. Dashboard-Driven Monitoring
The gap between finding a leak by chance and finding it by sensor is the entire reason this matters. Below is what that gap typically looks like across common campus scenarios.
| Leak Scenario |
Manual Discovery Time |
Dashboard-Driven Detection |
| Restroom supply line, over a break |
Days to over a week |
Under 60 seconds |
| Slow roof membrane failure |
Months, until ceiling stains |
Hours, via moisture trend |
| Irrigation valve stuck open |
One full weekend |
Minutes, via flow anomaly |
| Server room condensate leak |
Until equipment fails |
Immediate, raised-floor sensor |
Where Sensors Belong on a Multi-Building Campus
Coverage decisions matter as much as the dashboard itself. Districts that prioritize the right zones first see the fastest return, even before full campus rollout is complete.
Restrooms & Supply Lines
Highest leak frequency across any campus building — prioritize floor-level sensors near every fixture group.
Mechanical & Boiler Rooms
Pipe manifolds and PRV discharge points carry the highest flow volume when something fails.
Server & IT Closets
Raised-floor sensors catch condensate or pipe leaks before they reach irreplaceable equipment.
Kitchens & Cafeterias
Dishwasher and ice machine failures are common, frequent, and easy to miss without dedicated sensors.
From Sensor to Solved
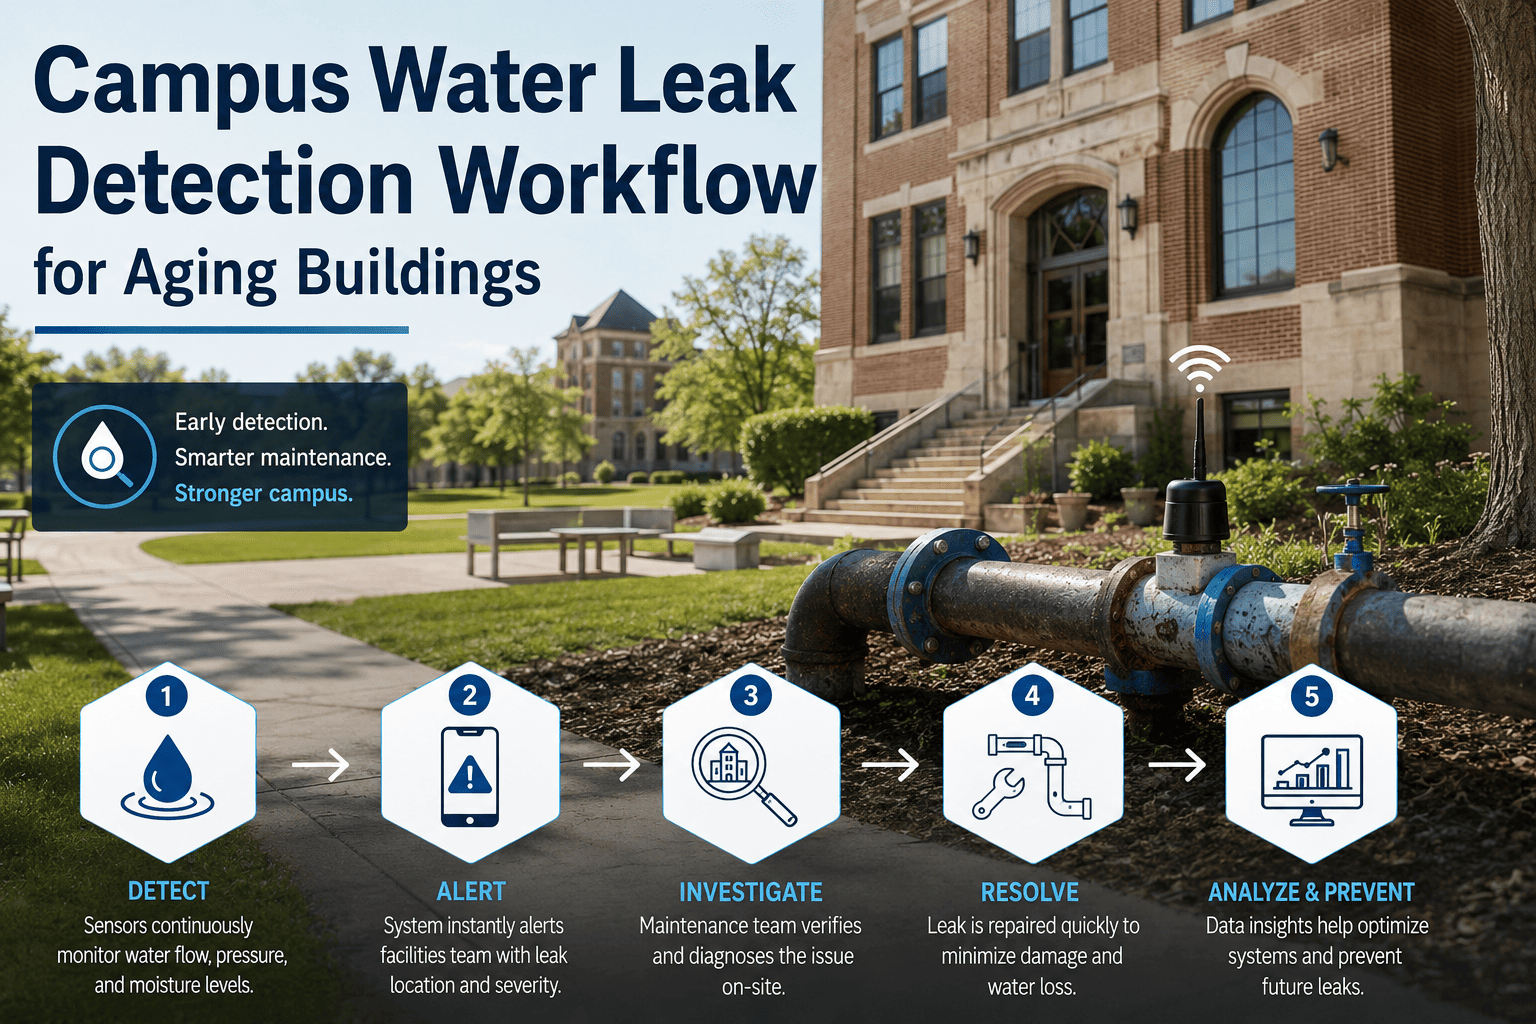
Watch a Leak Alert Become a Closed Work Order in One Workflow
OxMaint's dashboard doesn't just flag water — it routes the alert to the right technician, tracks resolution time, and builds the audit trail your board and insurer will ask for.
Frequently Asked Questions
What should a campus water leak detection dashboard actually track?
Detection-to-alert time, sensor coverage by zone, flow anomaly trends, work order response time, after-hours alert volume, and estimated avoided cost.
Sign in to see a live dashboard view.
How fast can sensors detect a leak compared to manual inspection?
Modern moisture and flow sensors typically alert within 60 seconds of detection, compared to days or weeks for manual discovery over a break or weekend.
Does leak detection lower school insurance premiums?
Many commercial property insurers offer discounts of roughly 5 to 15 percent for buildings with documented, monitored water detection systems in place.
Can OxMaint integrate with existing building automation systems?
Yes, OxMaint connects to common BAS platforms so flow anomalies trigger automatic work orders alongside point sensor alerts.
Book a demo to review your current integration options.
Where should a district start if it can't monitor every building at once?
Start with restrooms, mechanical rooms, and any space holding server or technology equipment, since these carry the highest frequency and highest cost risk.
Early Warning Signs Most Maintenance Teams Miss
Long before a ceiling stains or a hallway floods, a building is usually already telling you something is wrong. The signals are small and easy to dismiss individually, but a dashboard tracking them together turns a string of minor anomalies into an early warning instead of a Monday-morning surprise.
Unexplained Water Bill Increases
A slow, continuous drip can run for months without ever producing a visible puddle, showing up only as a rising utility bill.
Musty Odors in Closed Rooms
A smell with no visible source often means moisture is already trapped behind a wall or under flooring.
Pressure Drops on Old Lines
A sudden, unexplained drop in water pressure on an aging line frequently precedes a full pipe failure by days.
Recurring Minor Repairs
The same fixture needing repeated small fixes is usually a symptom of a larger upstream problem, not a string of bad luck.
Getting a Dashboard Live Without Disrupting the School Year
Districts don't need a summer-long construction project to get meaningful coverage. A phased rollout gets the highest-risk zones protected first, while the rest of the campus catches up over a semester without ever pulling a classroom out of use.
Week 1
Install sensors in restrooms and mechanical rooms across the highest-traffic building first.
Week 2–3
Connect sensor feeds to the CMMS dashboard and confirm work orders route to the right technician automatically.
Month 2
Expand coverage to remaining campus buildings, prioritizing kitchens, server rooms, and libraries.
Semester End
Review the first avoided-cost report with leadership and use it to justify full district-wide coverage.
Protect Every Building Before the Next Break
Give Your Facilities Team a Dashboard That Catches Leaks, Not Just Damage
OxMaint turns campus-wide sensor data into prioritized work orders, response tracking, and the documentation your district needs to justify the investment and qualify for insurance savings.