University trustees and board members make capital allocation decisions based on facilities data — and most receive reports that obscure rather than clarify the operational picture. A well-structured quarterly CMMS trustee reporting template translates maintenance KPIs, FCI movement, deferred backlog position, and capital cycle status into the governance-level view that boards need without requiring them to understand work order systems. When you Sign Up Free with Oxmaint, the data that populates this template generates automatically from daily maintenance operations — no manual report assembly, no spreadsheet consolidation, no end-of-quarter scramble to produce board-ready numbers. Book a Demo to see a live quarterly trustee report generated from an active university campus data set.
Trustees Make Better Capital Decisions When They See Real Data Every Quarter
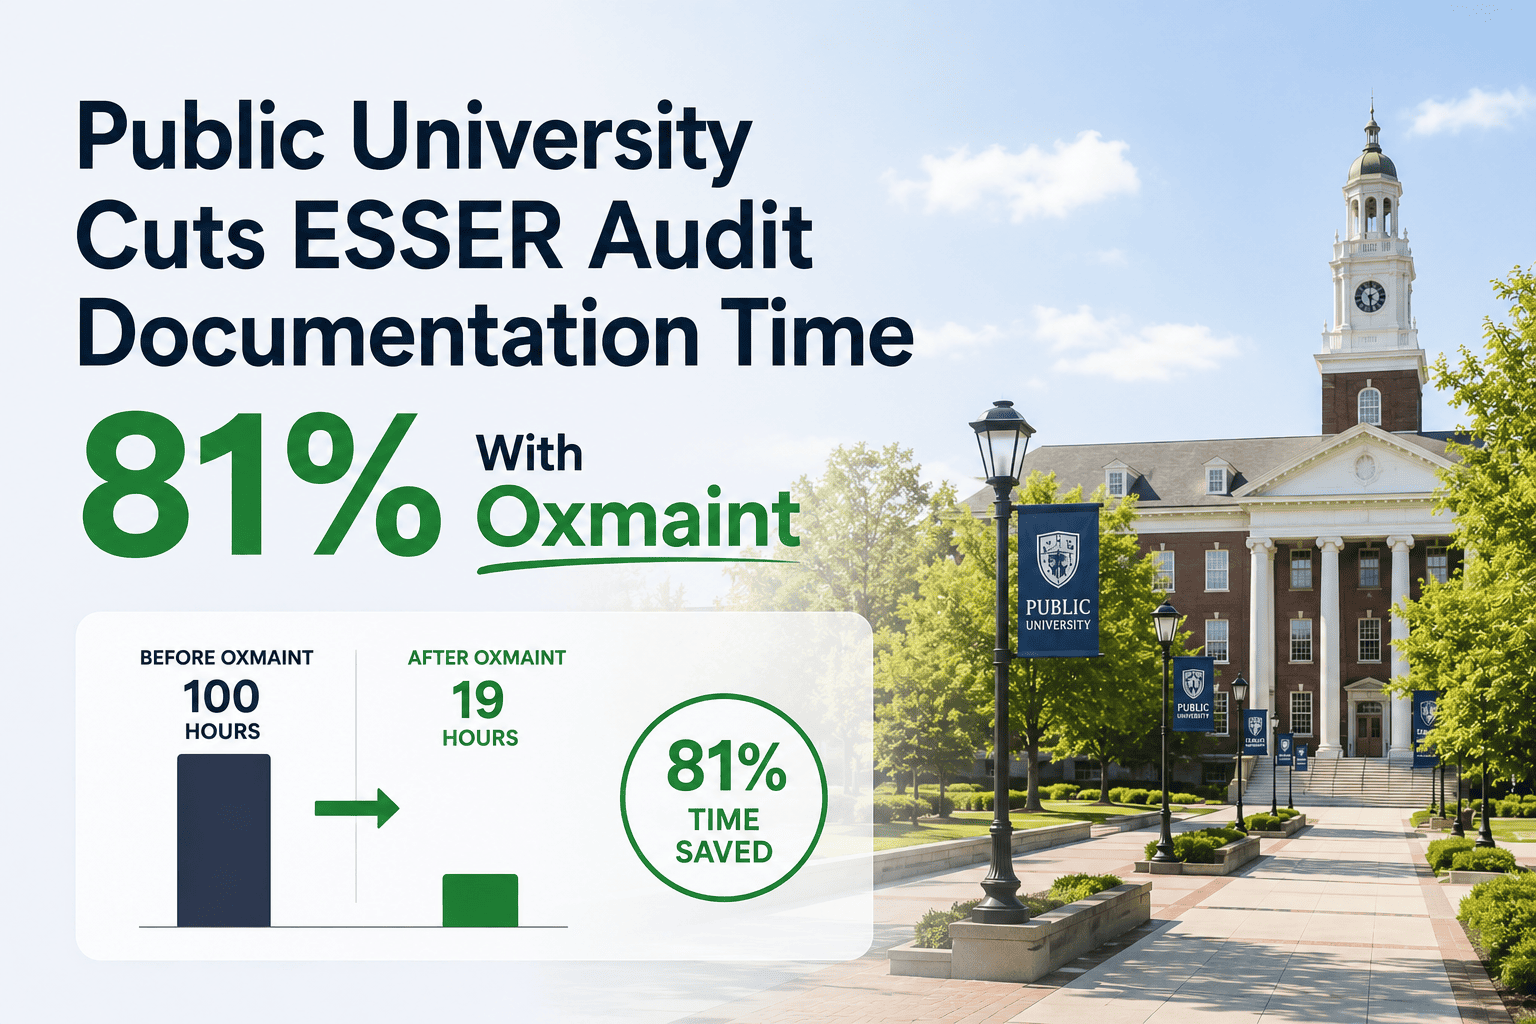
Most university board facilities reports are assembled manually over 40–60 hours, contain estimates rather than live data, and arrive too late to influence the decisions they were meant to inform. Oxmaint generates your quarterly trustee report automatically — FCI movement, deferred backlog in dollars, PM compliance trends, and capital cycle status — in a format boards actually understand, exported in under 10 minutes from the data your team already captures every day.
- Portfolio FCI movement calculated automatically — no manual condition scoring before each board cycle
- Deferred backlog expressed in dollars by building class, not work order counts that boards cannot interpret
- PM compliance rate trend across 8 rolling quarters — the governance metric that predicts capital need
- Capital cycle spend vs plan tracked in the same platform as daily maintenance operations
Quarterly Trustee Report Template — Section Structure
Each section addresses a specific governance question trustees consistently ask. The template sequence mirrors how board discussions progress — from high-level condition overview to specific capital decisions.
Quarter-over-quarter FCI change by building class — academic buildings, residence halls, athletics, utilities. Color-coded condition bands (good: FCI <0.10, fair: 0.10–0.30, poor: >0.30) give trustees an immediate visual read on portfolio health. Oxmaint calculates FCI from open backlog cost totals and current replacement cost benchmarks automatically. Sign Up Free to activate FCI tracking across your campus portfolio.
Total backlog in dollars, broken down by building, system type, and priority level — with quarter-over-quarter variance showing whether the backlog is growing, shrinking, or stable. Trustees making capital allocation decisions need the backlog expressed in dollars and by location, not work order counts. Oxmaint aggregates open work order estimated costs into live backlog dashboards exportable for board reports.
PM compliance rate, emergency vs planned work order ratio, mean time to complete, work order backlog age, and cost per square foot — each with prior quarter comparison and target variance. Trustees use these metrics to assess whether operations are improving or declining, independent of capital spending levels.
Projects in the current capital cycle tracked by planned spend vs actual spend, completion percentage, and schedule variance. Trustees approved the capital budget — they need to see how execution compares to plan each quarter, not just an end-of-year summary. Oxmaint links maintenance data to capital project tracking for continuous cycle reporting. Book a Demo to see capital cycle tracking in action.
Open compliance items by category — fire safety, ADA, EHS, and accreditation-related maintenance requirements — with resolution status and responsible owner. Trustees have fiduciary responsibility for compliance; the quarterly report gives them confirmation that known compliance items are actively managed, not accumulating.
FCI trend line by quarter (rolling 8 quarters), backlog dollar position trend, PM compliance rate trend, and emergency work ratio trend — all formatted for board presentation slides, not operational dashboards. Oxmaint exports chart-ready data that drops directly into PowerPoint or PDF board packages with no manual charting required. Sign Up Free to enable report export.
KPI Reference Guide — Trustee Report Metrics
| KPI | Target Range | Warning Threshold | Oxmaint Source |
|---|---|---|---|
| PM Compliance Rate | ≥88% | <75% — escalate | Scheduled vs completed PMs |
| Emergency / Planned Work Ratio | <20% emergency | >35% — reactive mode | Work order type classification |
| Portfolio FCI (Weighted Avg) | <0.15 | >0.25 — capital action needed | Backlog cost ÷ replacement cost |
| Deferred Backlog Growth Rate | Stable or declining | >10% quarter growth | Open WO cost totals, quarter delta |
| Mean Time to Complete (MTTC) | <4 days (non-emergency) | >8 days — staffing review | WO open-to-close date average |
| Maintenance Cost per Sq Ft | $4.50–$7.00 | >$9.00 — investigate | Total WO cost ÷ gross sq ft |
| Compliance PM Completion Rate | 100% | Any miss — immediate action | Mandatory PM completion flags |
How Oxmaint Automates Quarterly Trustee Report Generation
Manual board report assembly costs facilities directors 40–60 hours per quarter. Oxmaint reduces that to a one-click export and a formatting review.
Every open work order carries an estimated cost — aggregated in real time by building, system, priority, and age. The backlog dollar position that goes into the trustee report is the same number facilities directors see every day, not a quarter-end calculation.
Oxmaint stores historical KPI values by quarter — PM compliance rate, emergency ratio, MTTC, and cost per square foot — enabling 8-quarter trend charts to be generated automatically without manual data collection from prior reporting periods. Book a Demo to see rolling trend reporting live.
Asset hierarchy allows FCI roll-up by building type — academic, residential, athletics, utilities — giving trustees a class-level condition view that reflects portfolio composition, not just aggregate averages that obscure where condition risk is concentrated.
Approved capital projects tracked alongside maintenance data — planned vs actual spend, completion status, and schedule variance all in one platform. Trustees see capital execution performance in the same report as the operational metrics that justify future capital requests. Sign Up Free to connect capital and maintenance tracking.
Mandatory compliance PMs — fire safety, EHS, ADA-related maintenance — tracked with completion flags and overdue alerts. The trustee report compliance section pulls directly from Oxmaint's mandatory PM completion data, showing resolution status without manual status-gathering from department heads.
Quarterly trustee reports export from Oxmaint as PDF, Excel, or chart-ready data files — formatted for direct use in PowerPoint board presentations. The export sequence takes under 10 minutes from report generation to board package completion.
Trustee Report vs Operations Dashboard — Key Differences
Stop Spending 60 Hours Building a Report That Should Take 10 Minutes
Every quarter, facilities directors across higher education manually compile backlog estimates, chase department heads for compliance status, export spreadsheets from separate systems, and build charts by hand — just to produce a board report that trustees spend 20 minutes reviewing. Oxmaint collapses that process: the data your team captures every day through normal maintenance operations becomes the quarterly trustee report automatically, formatted for board presentation, not operational review.
Frequently Asked Questions
What KPIs should be included in a university CMMS trustee report?
How often should facilities directors present CMMS data to the board?
What is FCI and how should it be presented to trustees?
Can Oxmaint generate trustee reports in PDF or PowerPoint format?
How does the trustee report connect to capital budget requests?
The Quarterly Report That Gets Capital Approved — Built Automatically from Your CMMS
Boards approve capital requests from facilities directors who show up with consistent, credible, quarterly data — FCI trending up for three cycles, backlog growing faster than current capital allocation can address, PM compliance declining in a specific building class. Oxmaint builds that evidence trail automatically, quarter after quarter, from the operational data your team already captures. By the time you walk into the capital request meeting, the case is already made.