Facility quality inspection has historically been the least digitized function in operations management. Inspectors walk through spaces with paper forms, findings get transcribed hours later, defect patterns go undetected until failure rates become impossible to ignore, and first-pass yield data is never available to the leadership teams who need it for capital decisions. AI-powered quality inspection changes every one of those dynamics: automated defect detection, structured root cause logging, real-time dashboard visibility across every site, and a predictive quality model that identifies which assets are trending toward failure weeks before the failure occurs. Book a demo to see how Oxmaint's Quality Intelligence Hub transforms inspection outcomes across your facility portfolio.
Quality Management
10-12 min read
67%
of facility defects are identified reactively, after a complaint or service failure, rather than through structured inspection programs
4.8x
higher cost of defect correction after service delivery versus defects caught at inspection before occupant impact
91%
first-pass yield achievable with AI-assisted inspection programs versus 61% average for facilities using manual paper-based inspection
72%
reduction in repeat defects within 6 months of deploying structured AI root cause analysis at the asset and area level
What This Covers
AI-powered quality inspection in facility management is the use of machine learning, computer vision, and structured digital workflows to detect defects, score quality performance, identify root causes of recurring failures, and generate automated QC reporting across every area, asset, and service type in a multi-site portfolio. Unlike periodic manual walkthroughs, AI quality inspection runs continuously, produces structured data from every finding, and builds the predictive quality model that enables facility teams to prevent defects rather than respond to them.
Deploy AI Quality Inspection Across Your Portfolio
Oxmaint's Quality Intelligence Hub deploys across your entire facility portfolio in 14 days. First-pass yield tracking, defect root cause analysis, and automated QC reports from day one. Start free or book a demo to see the full quality module configured for your building types today.
Why Traditional Facility Inspection Programs Fail
Manual inspection programs are not failing because people are careless. They are failing because the tools being used produce unstructured data that cannot accumulate into a quality model, cannot surface patterns across sites, and cannot predict where the next defect will occur. Four structural gaps explain almost every quality management failure in commercial facilities.
01
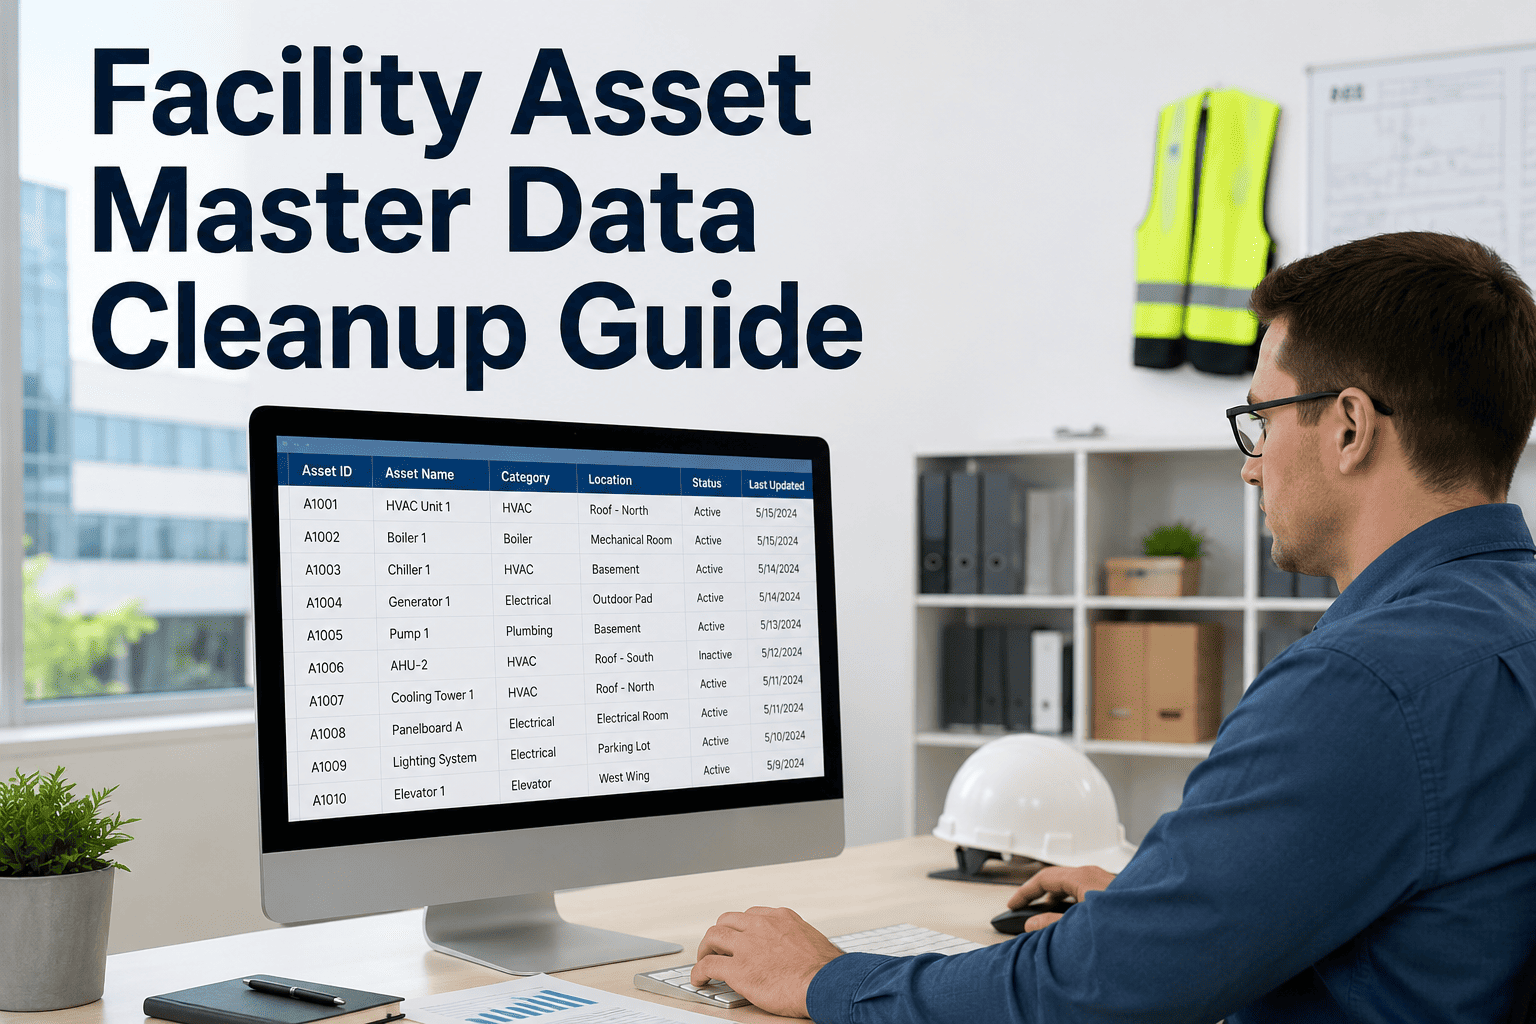
Paper Findings Never Become Data
A paper inspection form captures a finding on that day. It does not contribute to a defect frequency trend by area, asset type, or contractor. Facilities using paper inspection report an average of 0.3 structured data points per finding. Facilities using digital inspection with structured fields report 8.4 data points per finding. The gap between those numbers is the gap between pattern-blind and pattern-intelligent quality management.
02
No First-Pass Yield Measurement
First-pass yield is the percentage of work orders completed correctly on the first attempt without rework or callback. It is the single most predictive metric of maintenance quality and contractor performance. Yet 84% of facility management operations have never calculated their FPY rate because their work order system does not capture rework flags and their inspection program does not link findings to originating work orders.
03
Root Cause Analysis Is Never Performed
When a defect recurs three times in the same area, facilities with manual inspection programs escalate the service call frequency. Facilities with structured root cause analysis identify the root cause after the second occurrence and eliminate it. The difference in annual defect volume between these two approaches is 41% across comparable multi-site portfolios, entirely attributable to whether structured RCA was performed after each repeated finding.
04
No Portfolio-Level Quality Visibility
A portfolio manager with 12 facilities cannot compare quality performance across sites without compiling inspection reports from 12 separate sources, each in a different format, each completed on a different day. By the time the comparison is assembled, it reflects last month's conditions. AI quality inspection produces a real-time quality score for every area of every facility, ranked and filterable on one dashboard without manual compilation.
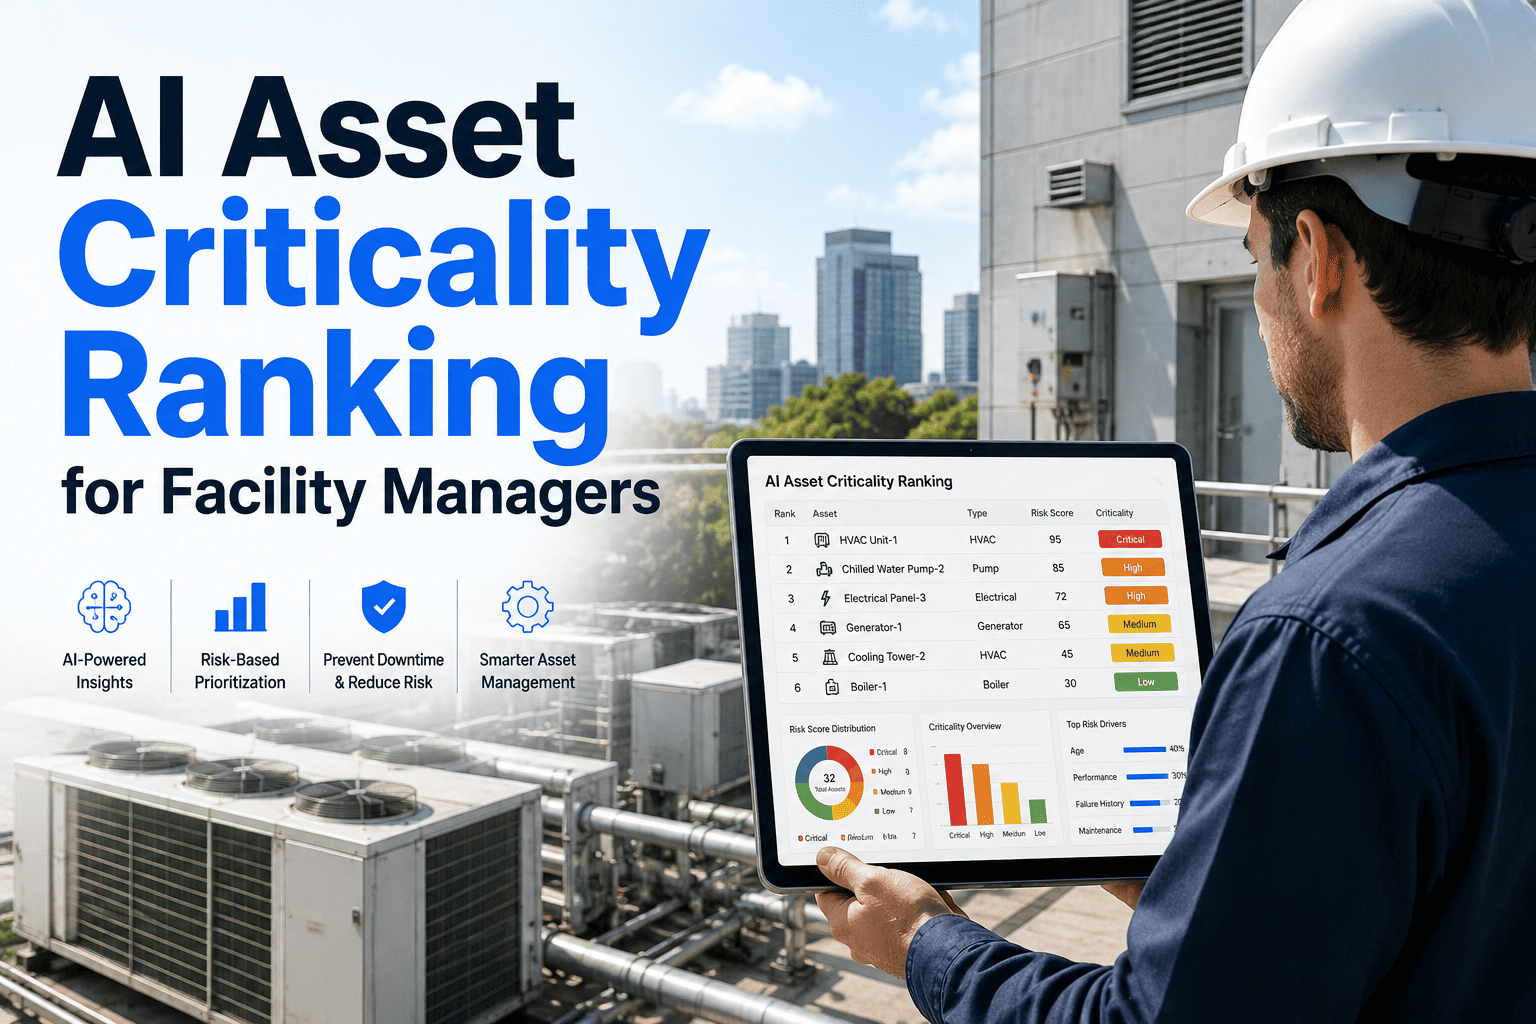
Quality Intelligence Hub: Core Capabilities
Oxmaint's Quality Intelligence Hub integrates inspection execution, defect analytics, root cause workflows, and QC reporting into one platform. Each capability is designed for the operational realities of multi-site facility management: diverse building types, multiple service contractors, and compliance requirements that vary by jurisdiction.
Capability 01
AI-Assisted Defect Detection
Photo-based inspection submissions are analyzed by computer vision models trained on facility defect categories: surface damage, cleanliness failures, equipment condition anomalies, and safety compliance gaps. The AI classifies the defect type, severity level, and recommended response before the inspector moves to the next area. Detection accuracy for trained defect categories reaches 94% across standard commercial facility types.
Capability 02
First-Pass Yield Tracking by Asset and Area
Oxmaint links every inspection finding to the originating work order. When a work order closes and the same finding recurs at the next inspection, the system flags the rework event and updates the FPY score for that work order type, technician, contractor, and building area. FPY dashboards update in real time and are filterable by service category, contractor, building, and date range with zero manual calculation.
Capability 03
Structured Root Cause Analysis Workflows
When a defect reaches a configured recurrence threshold, Oxmaint automatically opens a root cause analysis workflow linked to the defect record. The RCA workflow guides the responsible team through 5 Whys structured questioning, Fishbone diagram mapping, and corrective action assignment with due date and accountability tracking. AI pattern matching surfaces similar historical defects to inform the root cause hypothesis before the RCA begins.
Capability 04
Automated QC Report Generation
Quality control reports for tenant delivery, client review, regulatory audit, and internal operations generate automatically from inspection data with no manual compilation. Reports are configurable by date range, building, inspection zone, defect category, and contractor. Scheduled reports distribute to configured recipients at daily, weekly, or monthly intervals without any manual trigger.
Capability 05
Quality Scoring by Zone, Building, and Portfolio
Every inspected area receives a quality score from 0-100 based on defect frequency, severity weighting, and inspection compliance rate. Scores aggregate from zone level to building level to portfolio level on a single dashboard. Score trends over 30, 60, and 90-day windows identify which buildings are improving and which are degrading before scores reach the level that generates occupant complaints or compliance notices.
Capability 06
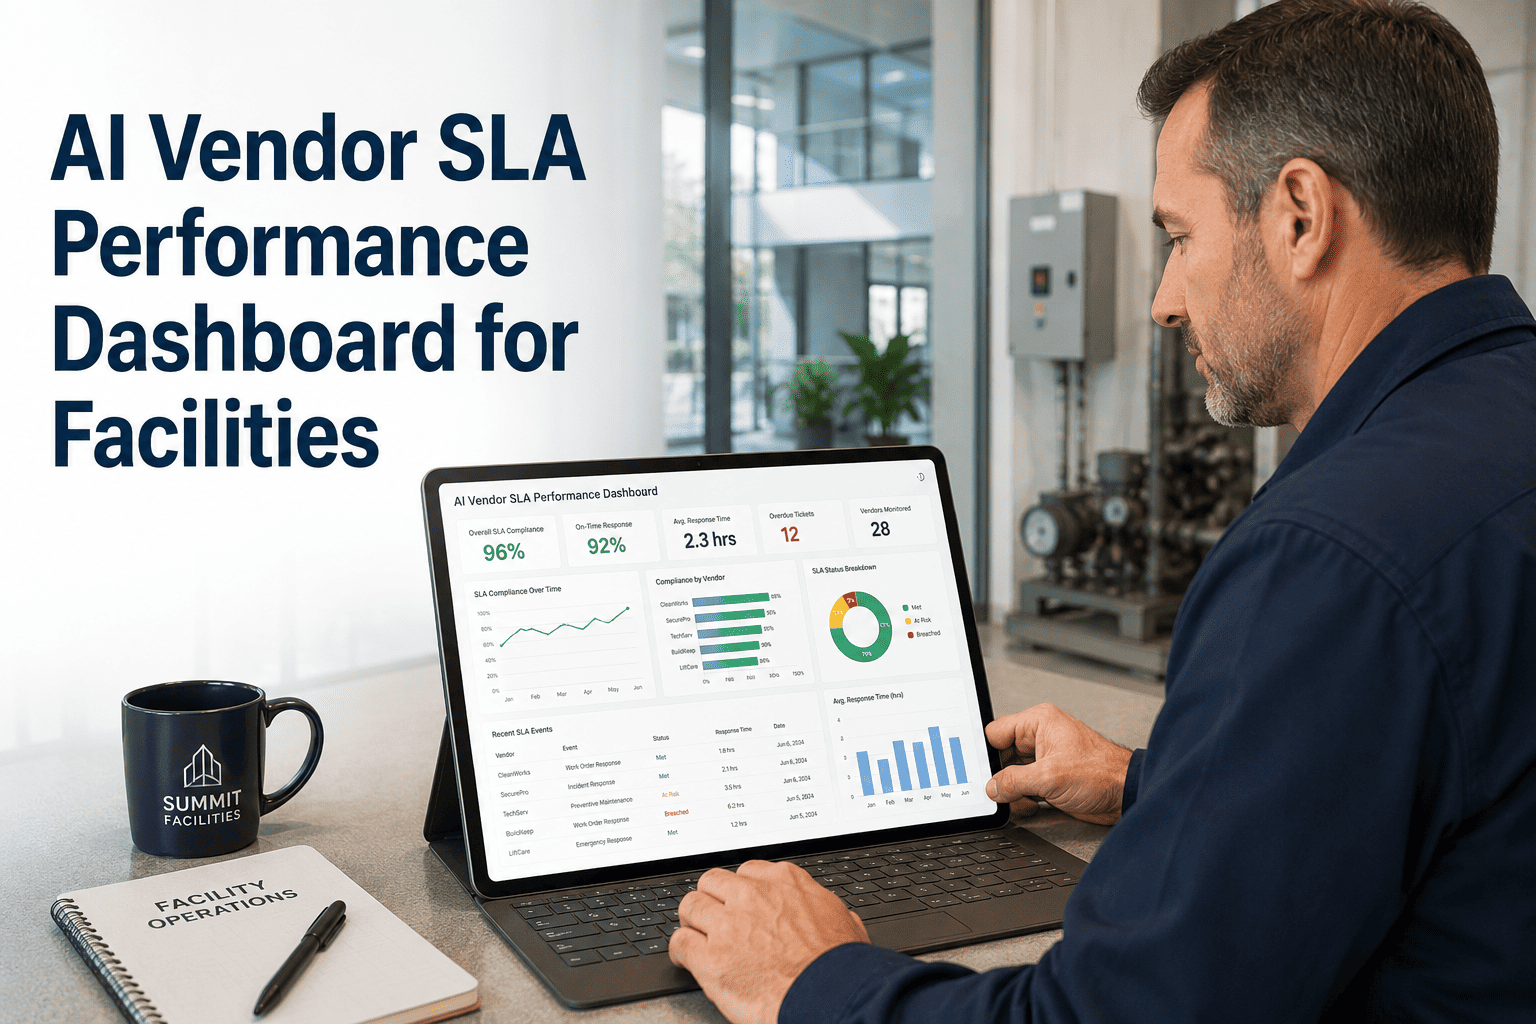
Contractor Performance Benchmarking
Contractor quality scores calculated from inspection findings, FPY rates, callback frequency, and defect severity are updated automatically with every completed work order and inspection cycle. Benchmark tables rank every contractor against portfolio averages by service category. Underperforming contractors are flagged for service review before contract renewal rather than after costly defect accumulation during the contract term.
Capability 07
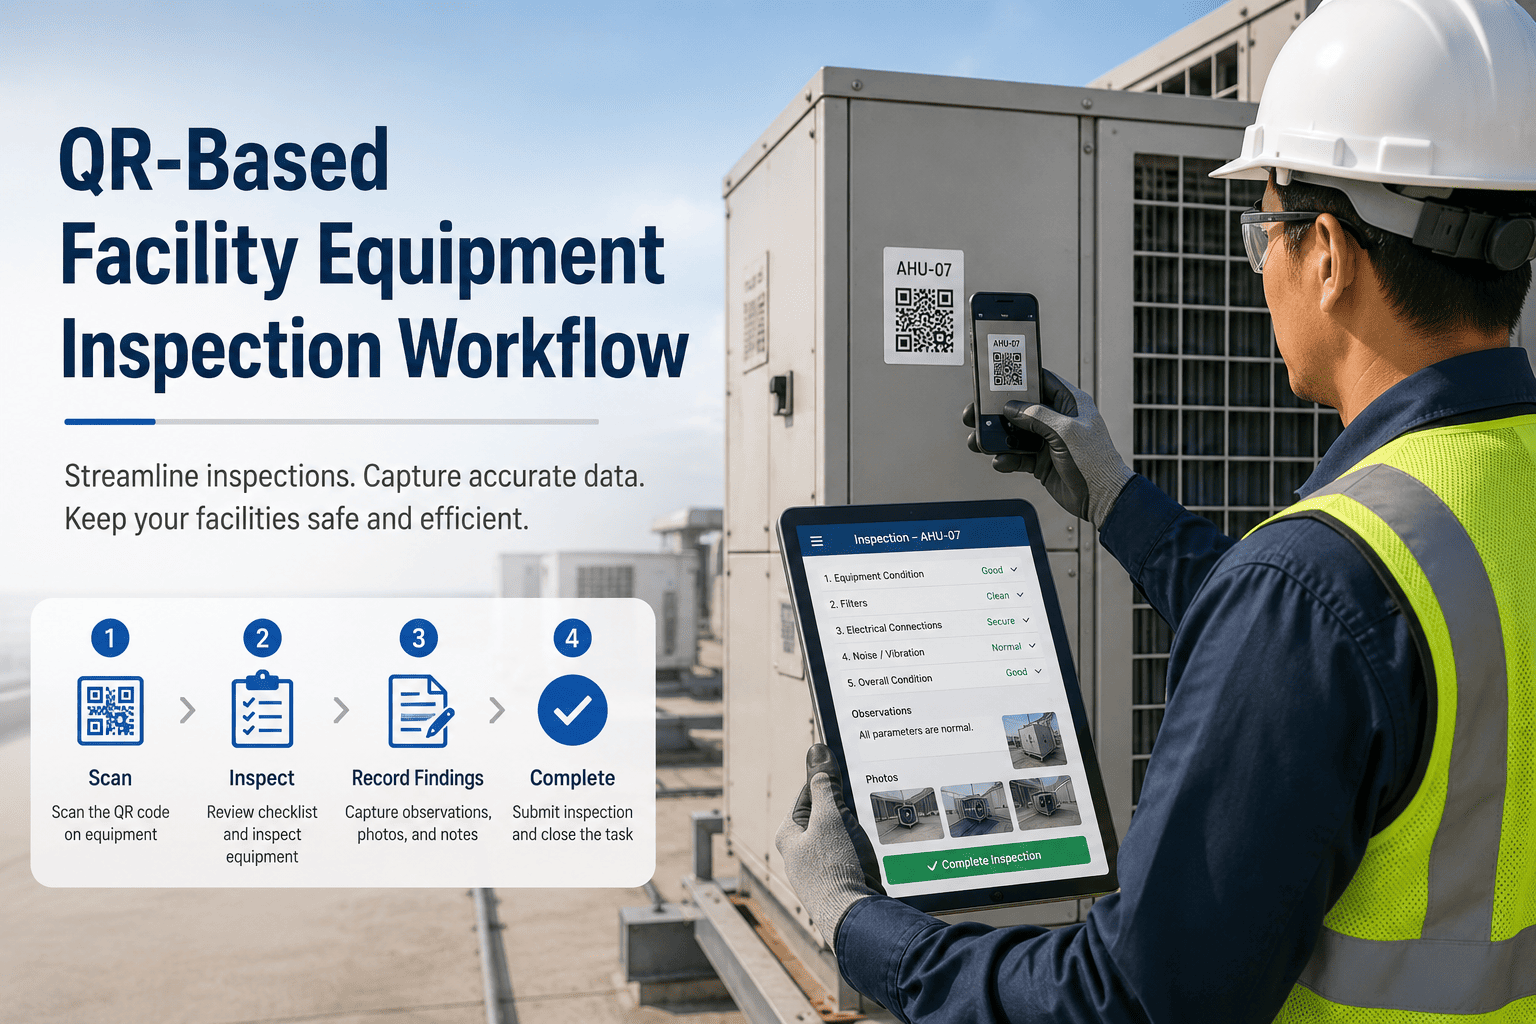
Mobile Inspection with Offline Mode
Inspectors complete zone-based inspection checklists on mobile devices with photo capture, severity rating, and finding description fields at each inspection point. GPS check-in confirms location at each finding. Offline mode ensures mechanical rooms, basements, and areas with poor connectivity do not interrupt inspection workflows. All offline findings sync and AI-classify automatically on reconnection.
Capability 08
Compliance Inspection Documentation
Compliance-related inspection findings (ADA accessibility, fire safety, OSHA housekeeping standards, building code conditions) are tagged with the applicable regulatory framework at capture. Compliance inspection records export as audit packages with timestamped, GPS-located, photo-evidenced findings in under 4 hours for any regulatory review period.
First-Pass Yield by Facility Service Category
| Service Category |
Industry Average FPY |
Oxmaint Quality Hub FPY |
Primary Root Cause of Rework |
| Janitorial and Cleaning |
68% - 1 in 3 cleaning cycles leaves a scoreable defect at next inspection |
91% at 6 months with AI inspection scoring |
Incomplete task completion, missed zones under time pressure |
| HVAC Preventive Maintenance |
74% - callback rate averages 26% of completed HVAC PMs |
88% with post-PM inspection linked to work order record |
Filter specification errors, incomplete coil cleaning documentation |
| Electrical and Life Safety |
82% - fire and electrical PM callback rate of 18% |
94% with AI-verified photo documentation at close |
Incomplete test documentation, missed secondary system verification |
| Plumbing and Restrooms |
71% - restroom defect recurrence within 48 hours of service |
89% with zone-level scoring and contractor performance flags |
Root cause not addressed, surface cleaning without supply restocking |
| Grounds and Exterior |
77% - seasonal defect spikes not predicted in advance |
86% with predictive scheduling from historical defect frequency data |
Reactive scheduling without seasonal pattern data from prior years |
| Pest Control |
63% - recurrence rates highest in food service and storage areas |
85% with root cause workflow after second recurrence |
Entry point not identified and sealed, surface treatment without exclusion |
Before and After: Quality Inspection Transformation
Without AI Quality Inspection
X61% average first-pass yield across facility service categories with no rework tracking or contractor accountability by finding type
XDefect root causes never identified. Recurring findings escalated to more frequent service visits rather than structural correction of the underlying cause
XPortfolio quality comparison requires 3-5 days of manual report compilation and is always 30-45 days retrospective by delivery date
XCompliance inspection documentation assembled manually for each audit at 4-8 weeks preparation time per regulatory review cycle
With Oxmaint Quality Intelligence Hub
V91% first-pass yield at 6 months with real-time FPY scores by contractor, technician, area, and service category updated at every inspection cycle
V72% reduction in repeat defects within 6 months from structured RCA workflows triggered automatically at configured recurrence thresholds
VReal-time quality scores for every zone of every building on one portfolio dashboard. No manual compilation. No reporting lag. Scores update at inspection close.
VCompliance audit packages export in under 4 hours from the quality dashboard with timestamped, GPS-located, photo-evidenced inspection records for any date range
Frequently Asked Questions
QHow does Oxmaint's AI defect detection work for facilities without camera infrastructure?
AI defect classification uses photos taken by inspectors on mobile devices during standard walkthroughs. No fixed camera infrastructure is required. The AI classifies defect type and severity from each submitted photo in under 8 seconds.
Start free or
book a demo to see a live classification demonstration on a sample inspection submission.
QCan Oxmaint calculate first-pass yield for existing work order data before the Quality Hub is deployed?
Yes. Oxmaint can calculate retrospective FPY from historical work order data by identifying callback patterns within configurable time windows. Most facilities see their first FPY baseline report within 48 hours of data import.
Book a demo to see the FPY baseline calculation for your existing work order history.
QHow long does it take to see measurable quality improvement after deploying AI inspection?
Facilities report measurable FPY improvement within 60 days of deployment and a 72% reduction in repeat defects within 6 months. The fastest gains come from contractor accountability visibility.
Start your free trial to begin tracking quality from your first inspection cycle.
QDoes the Quality Intelligence Hub work across multiple building types in the same portfolio?
Yes. Inspection templates, defect categories, and quality scoring are configured per building type within one portfolio account. Office, retail, healthcare, and industrial buildings each maintain type-specific quality benchmarks while the portfolio dashboard aggregates all scores.
Book a demo to see multi-building-type portfolio quality configured for your property mix.
91% First-Pass Yield. 72% Fewer Repeat Defects. Live in 14 Days.
Oxmaint's Quality Intelligence Hub deploys across your entire facility portfolio with AI defect detection, automated FPY tracking, structured root cause analysis, and real-time quality dashboards. Start your free trial or book a 30-minute demo to see quality inspection configured for your building portfolio today.
Continue Reading
Facility Condition Assessment Checklist: Building Systems Audit Guide 2026
Rate every building system, identify deferred maintenance, and prioritize capital expenditures with an FCI-scoring audit checklist aligned to ASHRAE standards.
Read the Checklist
Root Cause Analysis for Recurring Facility Equipment Failures
Stop recurring facility failures with structured RCA. 5 Whys, Fishbone diagrams, and AI-assisted failure pattern detection for maintenance teams.
Read the Blog
Janitorial and Cleaning Quality Inspection Checklist for Commercial Facilities
Score restrooms, lobbies, and workspaces with a structured cleaning quality checklist for offices, hospitals, and retail environments.
Read the Checklist
Robot Fleet Management for Facility Operations: Getting Started Guide
Deploy and manage cleaning, security, and delivery robots with fleet health monitoring, anomaly detection, and maintenance scheduling integrated in your CMMS.
Read the Article
Stop Managing Quality Reactively. Start Predicting It.
Oxmaint's Quality Intelligence Hub gives facility operations teams AI defect detection, real-time FPY scores, automated root cause workflows, and portfolio-wide quality dashboards in one platform. Live in 14 days, no consultant fees, no hardware required. Book a 30-minute demo to see quality inspection configured for your building portfolio today.