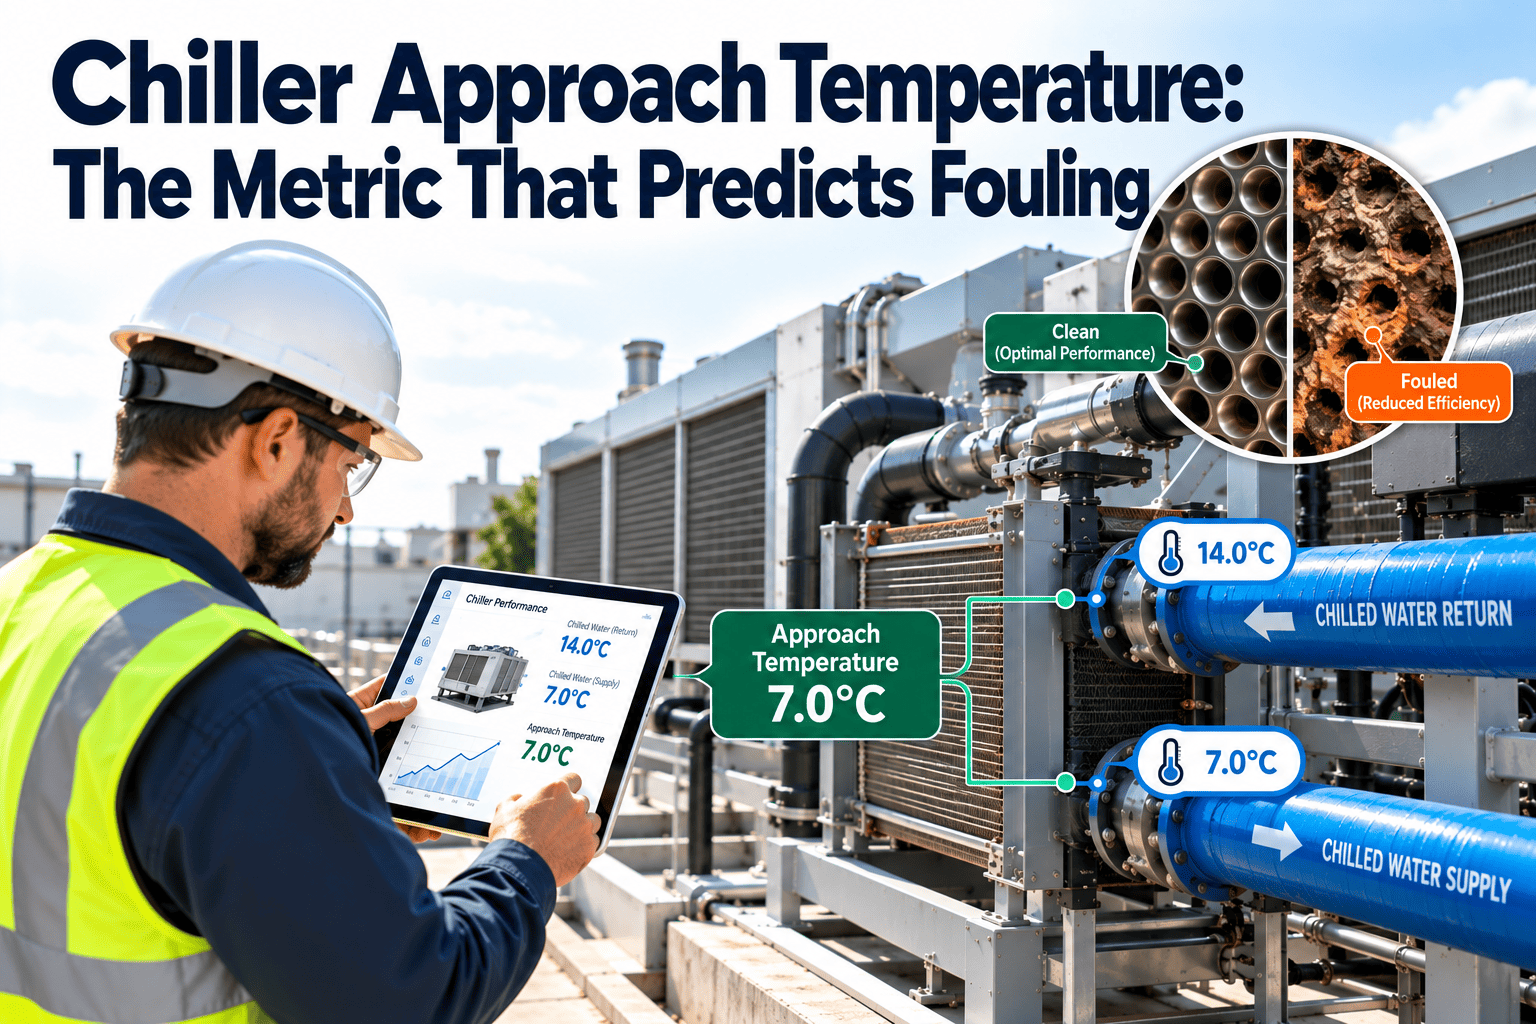
Chiller approach temperature is the gap between the refrigerant saturation temperature and the water leaving a heat exchanger, and it is the earliest clean number a facility team has for spotting fouling. Unlike kW per ton, it does not swing with weather and building load, so a creeping approach points straight at scale, biofilm, or sludge on the tubes. This guide shows how to calculate it, how to set a baseline for each machine, and which threshold should trigger a cleaning job before COP drops. Teams that log it inside maintenance management software can turn every reading into a scheduled task.
Chiller Approach Temperature: The Metric That Predicts Fouling
Commercial chillers lose efficiency quietly as tubes foul. The approach temperature shows the loss weeks or months before the monthly energy report does, and it gives you a clear trigger for cleaning.
What approach temperature measures, and why it isolates the heat exchanger
Both numbers describe how hard the refrigerant has to push heat across the tube wall. A small approach means the tube surface is passing heat easily. A large approach means something is in the way.
- Saturation temperature is calculated by the chiller controller from the refrigerant pressure reading.
- Water temperatures come from the leaving-water sensors on the condenser and evaporator.
- Design approach values are usually in the low single digits of degrees Fahrenheit, but they differ by manufacturer, tube type, and design load.
Why approach beats other signals
Condenser pressure, compressor amps, and kW per ton all move when the weather or the load changes. Approach is a temperature difference taken across the heat exchanger itself, so most of that noise cancels out.
| Signal | Moves with weather and load | Isolates heat exchanger fouling | Best use |
|---|---|---|---|
| Condenser pressure | Strongly | Weakly | Protection limits and alarms |
| kW per ton | Strongly | Weakly | Overall plant efficiency reporting |
| Condenser water delta T | Moderately | Partly, mostly flow and load | Flow and load verification |
| Condenser approach | Mildly, by load band | Strongly | Fouling detection and cleaning trigger |
| Evaporator approach | Mildly, by load band | Strongly | Evaporator fouling, charge, and oil issues |
How a thin film on the tubes turns into a higher power bill
Fouling does not announce itself. It adds a thermal resistance to every tube, and the refrigerant side has to compensate. This is the sequence most plants see.
Deposit forms
Mineral scale, biofilm, silt, or corrosion products coat the inside of condenser tubes.
Resistance rises
The film insulates the tube wall, so more temperature difference is needed to move the same heat.
Approach climbs
The refrigerant must condense at a higher temperature than before for the same water temperature.
Lift increases
The compressor works across a bigger pressure difference at the same cooling load.
COP falls
kW per ton rises. At high enough condensing pressure, the unit may unload or trip.
Approach moves at step three. Energy reports usually notice at step five, after the extra kilowatt-hours have already been burned.
A high approach is a symptom, not always fouling
Before sending a crew to brush tubes, read approach together with a few other values. The patterns below help separate fouling from other causes.
| Pattern observed | Likely cause | Quick check |
|---|---|---|
| Condenser approach rises slowly over months at the same load band | Tube-side scale, biofilm, or sludge | Review water treatment records and inspect tube ends |
| Condenser approach jumps suddenly after a service event | Noncondensables, overcharge, or a sensor fault | Compare against a second temperature reading |
| High approach with low condenser water delta T | Reduced flow or a blocked strainer | Check pump status, valve positions, and strainer pressure drop |
| Evaporator approach rises with normal chilled water flow | Evaporator fouling, oil logging, or low refrigerant charge | Check superheat, oil levels, and sight glass |
| Both approaches rise together | Probably a sensor or calibration issue | Verify leaving water sensors against a reference thermometer |
This is why the work order should carry the reading, the load band, and the diagnostic checklist, not just the instruction to clean.
Set a baseline you can trust before you set a threshold
A trigger is only as good as the baseline behind it. Capture clean-condition readings right after a verified tube cleaning or at commissioning.
- Verify the sensors. Approach is a small difference of two readings, so a half-degree sensor error is a large share of it.
- Record by load band. Approach changes with load, so log separate baselines for each band.
- Log the conditions. Note entering condenser water temperature, flow, and chilled water setpoint beside each reading.
- Use stable operation. Take readings after the machine has settled, not during startup or staging changes.
- Store it with the asset. The baseline belongs on the chiller record so every technician sees the same reference.
| Load band | Why log it separately | Practical note |
|---|---|---|
| 40 to 60 percent | Part-load approach is naturally lower | Most common operating band in many buildings |
| 60 to 80 percent | Mid-range reference for trending | Good band for monthly comparison |
| 80 to 100 percent | Fouling shows most clearly at high load | Capture during peak-season operation |
Comparison against design is useful context. AHRI 550/590 rates chillers using defined fouling allowances, so a machine that runs well above its clean design approach is consuming more than its rating suggests.
Put the approach reading where the work gets done
Log readings against each chiller, compare them to the baseline, and open a cleaning work order from the same record.
A threshold ladder that tells the technician what to do
Define bands as a rise above the machine's own clean baseline at the same load band. The values below are illustrative starting points to validate with your manufacturer and water treatment provider.
Two refinements make the ladder more useful. Require the high reading on several consecutive logs so one noisy value does not create a work order. Also track the rate of rise, because a fast climb deserves attention even inside a lower band.
What a rising approach costs, worked through
Operators often quote a rule of thumb that each degree of extra condensing temperature adds a few percent to compressor power. The exact figure depends on the machine, so use your own trend data. This example is hypothetical.
Replace the assumptions with your own tonnage, hours, and electricity rate. Add the demand charges and the risk of a high-head trip during a heat wave, and the case for acting at the watch band becomes easier to make.
Calendar cleaning versus approach-triggered cleaning
Fixed calendar cleaning
- Tubes are cleaned every year whether they need it or not.
- A fast-fouling season can go unnoticed for months.
- Water treatment problems are found at the next scheduled outage.
- No evidence that the cleaning restored performance.
Approach-triggered cleaning
- Cleaning follows the measured condition of each machine.
- Fast-fouling trends surface within weeks.
- Water treatment gaps are linked to approach history.
- Post-cleaning approach confirms the job worked and resets the baseline.
Many sites keep an annual inspection as a safety net and let approach decide whether extra cleaning is needed in between. That hybrid avoids both overcleaning and surprise failures.
Closing the loop from reading to verified cleaning
Capture the values
Operators or the building system record saturation temperature, leaving water temperatures, load, and flow on a defined interval.
Check against baseline
The calculated approach is compared with the stored baseline for the same load band.
Create the work order
A threshold crossing opens a corrective or planned work order with the readings attached.
Execute the cleaning
Crews use brush cleaning, chemical descaling, or an online cleaning method, and record the method and findings.
Confirm and reset
A post-cleaning reading confirms the approach returned to baseline, then the record is closed.
Where Oxmaint fits
- Asset records hold the chiller baseline, design data, and cleaning history in one place.
- Preventive maintenance schedules cover log readings, strainer checks, and tube inspections.
- Mobile work orders let technicians record readings and cleaning findings at the machine.
- Inventory tracking covers brushes, chemicals, and gaskets used during cleaning.
- Reports and dashboards show approach trends and cleaning intervals by chiller.
The points you need, and how often to log them
| Data point | Source | Suggested interval |
|---|---|---|
| Condenser saturation temperature | Chiller controller | Automatically every few minutes, or every shift if manual |
| Leaving condenser water temperature | Chiller or building system | Same as above |
| Evaporator saturation and leaving chilled water temperatures | Chiller controller | Same as above |
| Percent load or amps | Chiller controller | Same as above |
| Entering condenser water temperature and flow | Building system or flow meter | Hourly or better |
| Water treatment results | Treatment provider | Per treatment schedule |
Where a site has no automatic data, a daily operator log with the same fields still works. Consistency matters more than sophistication.
Common mistakes that make approach data useless
- Using one baseline for all loads. A part-load reading compared with a full-load baseline will mislead.
- Skipping sensor verification. A drifting leaving-water sensor looks exactly like fouling.
- Cleaning without recording. If the post-cleaning approach is not logged, the baseline never refreshes.
- Ignoring water treatment. Repeated fast fouling is often a treatment or filtration problem, not a cleaning frequency problem.
- Treating every alert as fouling. Flow, noncondensables, and charge issues can raise approach too.
Standards such as ASHRAE 90.1 set minimum equipment efficiency and AHRI 550/590 defines how chillers are rated, but neither tells you when to clean a specific machine. That decision comes from your own trend data.
Taking the reading correctly, every time
Good trending starts with a disciplined reading routine. Whether the values come from the chiller panel or a building automation point, the same rules apply.
- Log only when the chiller has been running steadily for a while, not during startup, staging, or a rapid load change.
- Record the number of chillers running and the condenser pump status, since sequencing changes affect flow and load per machine.
- Use the same sensor source each time. Switching between the panel display and a separate trend point can introduce a small offset that looks like a trend.
- Note any recent water treatment events, blowdown changes, or tower cleaning, because they influence how quickly fouling develops.
Water treatment and approach go together
Approach history is a quiet audit of your condenser water program. If tubes foul quickly after every cleaning, the cause is often upstream in the cooling tower loop, not in the chiller itself.
- Scale tends to follow high cycles of concentration, poor pH control, or inhibitor problems.
- Biofilm tends to follow weak biocide control, warm stagnant periods, or dirty tower basins.
- Silt and debris tend to follow poor filtration, open towers near dust sources, or strainer failures.
Sharing the approach trend with your treatment provider turns a general conversation into a specific one. They can see when the rise began and match it against changes in the loop.
Cleaning methods and what to record
The right method depends on the deposit and the tube material. Whatever the method, the work order should capture what was found, because the finding teaches the next decision.
- Mechanical brush cleaning removes soft deposits and some light scale from tube interiors.
- Chemical descaling addresses hard mineral scale, and requires material compatibility checks and safe handling and disposal.
- Online cleaning systems can hold approach closer to baseline between outages on suitable machines.
- Inspection at opening, such as tube condition, end sheet condition, and any signs of corrosion, belongs on the same record.
Record before and after approach values, the method, the contractor or crew, and any unusual deposit type. Over a few cycles, those records show how long your system really runs clean.
Chiller approach temperature questions
What is a normal chiller approach temperature?
It depends on the design, but clean condensers often run in the low single digits of degrees Fahrenheit. Use the manufacturer's data and your own commissioning baseline.
How much approach rise should trigger cleaning?
Many sites plan cleaning when the approach is a few degrees above clean baseline. Set the exact value with your manufacturer and review it after each cleaning.
Can approach detect evaporator fouling too?
Yes, but a high evaporator approach can also point to low charge or oil issues, so confirm with superheat and oil checks first.
Do I need a building automation system to track it?
No. A consistent manual log works, and you can start tracking readings by asset and automate later.
How does this connect to preventive maintenance?
Approach becomes the condition input for your cleaning task. You can book a walkthrough to see the workflow.
Clean on evidence, not on the calendar
Track approach temperature for every chiller, trigger cleaning at the right point, and verify the result on the same record.