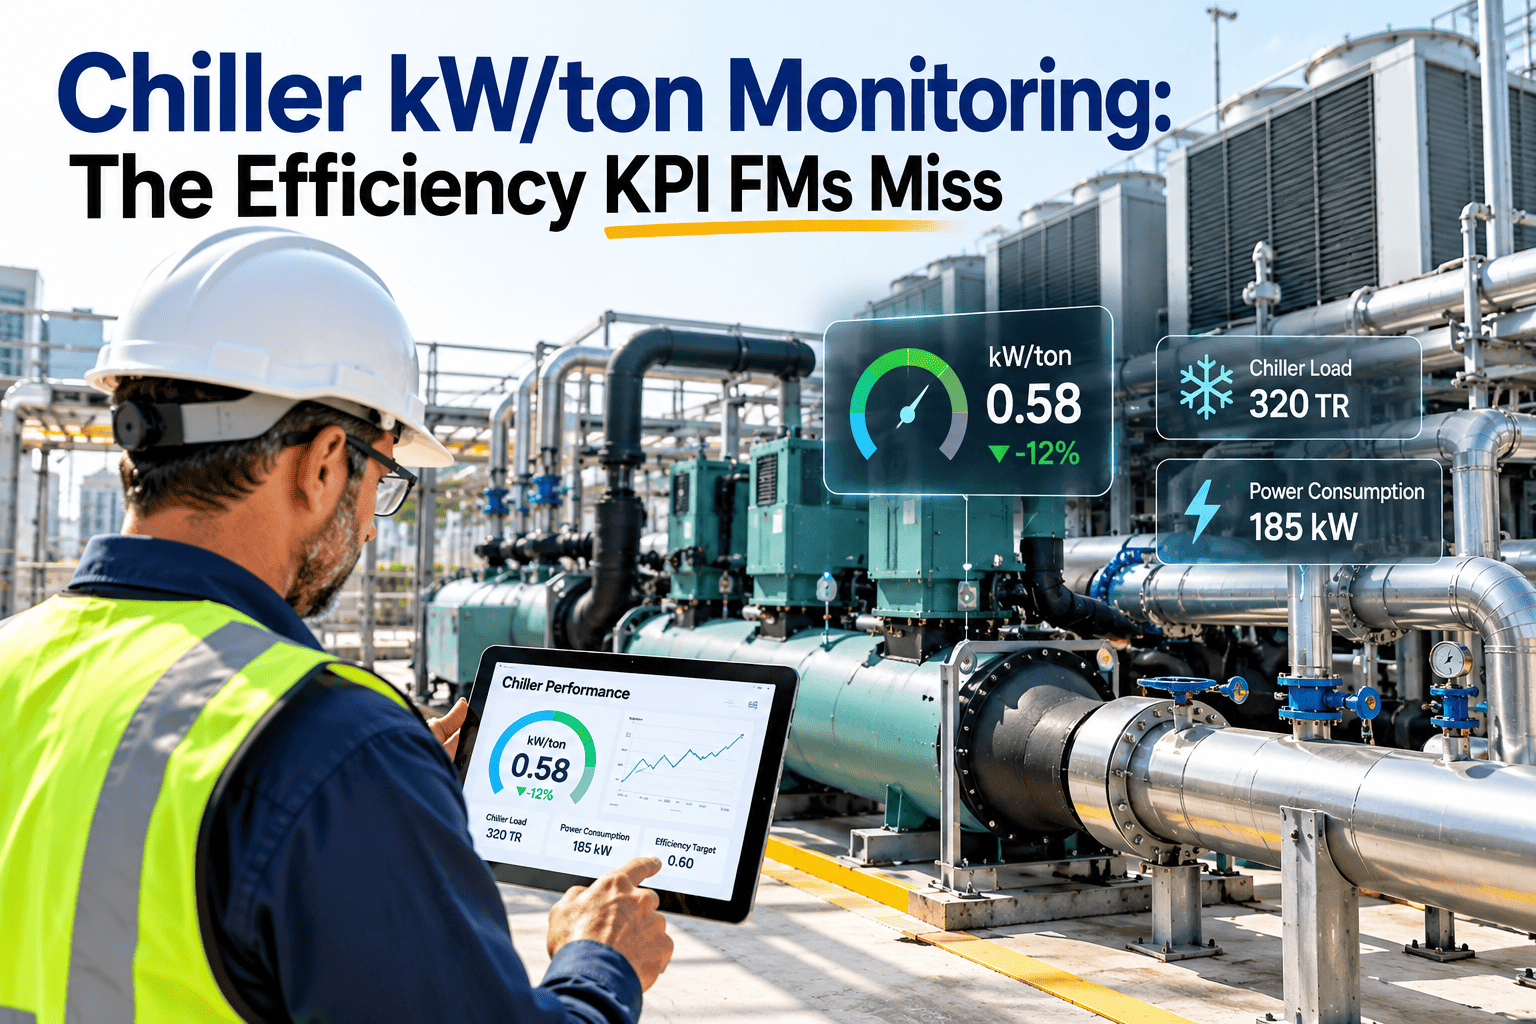
Chillers often account for the largest share of electricity use in a commercial building, yet many facility teams cannot say what their plant is delivering in kW per ton today. Utility bills show the total, but they do not show whether a machine is drifting away from its design performance. Tracking kW/ton turns a hidden slow decline into a visible trend that maintenance can act on. This guide explains the calculation, realistic benchmarks, and how an asset-driven maintenance system links efficiency changes to service work.
Chiller kW/ton Monitoring: The Efficiency KPI FMs Miss
One number tells you whether a chiller is still doing its job efficiently. When it rises, something in the plant needs attention before the next bill arrives.
Why kW/ton gets missed
What most teams watch
- Supply and return water temperatures
- Alarms and trips
- Monthly utility totals
- Run hours for PM scheduling
What they often cannot see
- Power per unit of cooling at each load point
- Gradual fouling and refrigerant loss effects
- Efficiency of the whole plant, not just the chiller
- Savings potential hidden inside normal operation
The core problem
- A chiller can run, hold setpoint, and stay alarm-free while using noticeably more energy than it should.
- Because cooling demand varies, a rising bill can be blamed on weather when the real cause is degraded efficiency.
How to calculate kW/ton step by step
Measure chilled water flow
- Use an in-line or clamp-on flow meter, in gallons per minute.
Measure the temperature difference
- Subtract leaving chilled water temperature from entering chilled water temperature, in degrees Fahrenheit.
Convert to tons of cooling
- Tons = gpm x delta T / 24
Measure electrical input
- Use a power meter on the chiller, in kW, taken at the same time as flow and temperature.
Divide
- kW/ton = kW input / tons of cooling
Worked example
| Reading | Value | Result |
|---|---|---|
| Chilled water flow | 1,000 gpm | Used in tonnage |
| Delta T | 12 F | 1,000 x 12 / 24 = 500 tons |
| Chiller input power | 300 kW | 300 / 500 = 0.60 kW/ton |
| Equivalent COP | 3.517 / 0.60 | About 5.9 |
Useful conversions
- COP = 3.517 / (kW/ton)
- EER = 12 / (kW/ton)
- A lower kW/ton is better; a higher COP or EER is better.
Reading the number: chiller, plant, and rating basis
Always label which boundary a kW/ton figure uses, otherwise comparisons mislead.
Why ratings need context
- AHRI 550/590 sets the test method for water-chilling packages, with standard conditions such as 44 F leaving chilled water and 85 F entering condenser water for water-cooled machines.
- Real sites rarely run at those conditions, so a measured value will not match the nameplate exactly.
- ASHRAE 90.1 sets minimum efficiency requirements that depend on chiller type, capacity, and edition, so check the version your jurisdiction has adopted.
IPLV and NPLV: why part load matters
Chillers rarely run at full load. IPLV weights four load points to estimate seasonal efficiency under standard conditions.
What this tells facility teams
- Most of the weighting sits between 50% and 75% load, so that is where efficiency matters most for many buildings.
- NPLV uses the same weighting but applies to non-standard conditions, such as different condenser water temperatures.
- Your own load profile may differ, so trend kW/ton by load band rather than relying on one headline number.
Typical kW/ton ranges by chiller type
These are general planning ranges. Confirm against manufacturer data for your specific model, refrigerant, and operating conditions.
| Chiller type | Typical full-load range | Part-load behavior | Watch for |
|---|---|---|---|
| Water-cooled centrifugal, variable speed | About 0.50 to 0.60 kW/ton | Often improves at moderate part load with cool condenser water | Tube fouling, surge, poor tower performance |
| Water-cooled screw | About 0.55 to 0.70 kW/ton | Good with slide valve or VFD control | Oil management, refrigerant charge |
| Air-cooled screw | About 1.1 to 1.3 kW/ton | Varies widely with ambient temperature | Dirty coils, fan faults, hot ambient |
| Air-cooled scroll | About 1.1 to 1.4 kW/ton | Stepped capacity can reduce efficiency between stages | Compressor cycling, refrigerant leaks |
Reading your trend against the ranges
- The best benchmark is your own commissioning or early-life baseline at the same load and temperature conditions.
- Changes of several percent against that baseline are worth investigating even if you are still within a typical range.
Operating conditions that move kW/ton without any fault
Not every rise in kW/ton means a failing machine. Separate normal operating effects from real degradation before dispatching a technician.
| Condition | Effect on kW/ton | Is it a maintenance issue? |
|---|---|---|
| Higher entering condenser water temperature | Raises compressor lift and power per ton | Only if the tower should be able to deliver cooler water |
| Lower chilled water setpoint | Raises lift and power per ton | No, unless the setpoint was changed without approval |
| Very low load | Fixed losses weigh more heavily against small output | Review staging and minimum-load control |
| Hot ambient for air-cooled units | Raises condensing pressure | Check coil cleanliness and fan operation |
| Wrong sensor or flow reading | Produces a false number in either direction | Yes, calibrate and verify instruments |
How to compare fairly
- Normalize readings by load band and by entering condenser water or ambient temperature.
- Compare the same operating mode, such as free cooling off, with the same number of chillers running.
- Record any setpoint change in the maintenance history so a later analyst understands the shift.
Plant-level opportunities beyond the chiller itself
A chiller can be healthy while the plant around it wastes energy. Maintenance and controls both play a part.
Condenser water side
- Clean tower fill and basins so heat rejection stays effective
- Verify fan speed control and valve operation
- Review water treatment to limit scale and biological growth
- Check that condenser water reset logic matches wet-bulb conditions
Chilled water side
- Look for low delta T caused by three-way valves or bypass flow
- Check coil cleanliness in air handlers
- Confirm pump speed control and differential pressure setpoints
- Remove unnecessary overpumping that adds pump kW
Why this matters for the KPI
- Plant kW/ton captures these losses, while chiller kW/ton alone can hide them.
- Maintenance work on towers, valves, and coils often pays back faster than compressor work.
Refrigerant, leaks, and efficiency
Refrigerant loss usually degrades efficiency before it triggers a hard failure. It also carries regulatory obligations.
Records worth keeping
- Leak inspection dates, findings, and repairs by chiller
- Refrigerant added, by quantity, date, and technician
- Leak rate calculations where regulations or company policy require them
- Purge or non-condensable removal frequency on low-pressure machines
Compliance note
- Requirements for leak repair and recordkeeping vary by country, refrigerant, and charge size, so confirm the rules that apply to your site.
- Keeping these records beside the work order history makes audits and inspections easier to support.
A 90-day plan to start tracking kW/ton
Days 1-30: Instrument and verify
- Confirm which meters and sensors exist and when they were last calibrated.
- Close gaps with temporary clamp-on devices if permanent ones are not yet installed.
Days 31-60: Baseline
- Capture kW/ton at several load levels while the plant is in good condition.
- Store the results on each chiller asset record.
Days 61-90: Alert and act
- Set thresholds and route alerts to the responsible technician.
- Review the first findings and update preventive tasks accordingly.
Connect efficiency drift to the work that fixes it
Track chillers as assets, schedule preventive tasks, and turn every efficiency alert into a documented work order.
When a rising kW/ton means service is due
Rule for escalation
- Define a threshold, such as a set percentage above baseline over a set period, that automatically creates an inspection task.
- Require the technician to record the readings used, the findings, and the corrective action.
What a small efficiency loss costs
The arithmetic below is illustrative. Replace the inputs with your plant data and local electricity rate.
Healthy baseline
- 500 tons average load
- 0.60 kW/ton
- 300 kW input
After gradual fouling
- 500 tons average load
- 0.66 kW/ton, up 10%
- 330 kW input
Cost of the drift
- Extra demand: 30 kW
- If the chiller runs 3,000 hours per year: 90,000 kWh extra
- At 0.12 per kWh: about 10,800 per year, before any demand charges
Monitoring setup checklist
- Install or verify flow meters on the chilled water loop and calibrate them on a schedule.
- Use matched, calibrated temperature sensors on supply and return lines.
- Meter chiller power directly, and separately meter pumps and tower fans if you want plant efficiency.
- Log data at consistent intervals and keep the time stamps synchronized.
- Record outdoor wet-bulb or ambient temperature to explain weather-driven variation.
- Set a baseline for each load band after commissioning or major service.
- Define alert thresholds and decide who receives each alert.
Data quality warning
- An uncalibrated sensor can create a false efficiency problem or hide a real one.
- Add sensor calibration to the preventive maintenance schedule for the chiller plant.
- Record the calibration date and result on the instrument asset so readings can be trusted later.
Mistakes to avoid
- Comparing a winter reading with a summer reading and calling the difference a fault.
- Using nameplate efficiency as a daily target instead of building a site baseline.
- Letting alerts go to a shared inbox with no owner, so nobody creates the work order.
- Skipping a baseline refresh after a major overhaul, which makes later drift look normal.
- Treating plant kW/ton and chiller kW/ton as the same figure in management reports.
- Ignoring seasonal changeover, when staging and condenser water setpoints often change.
- Closing an efficiency work order without recording the before and after readings.
Turning kW/ton into a maintenance routine with Oxmaint
Practical benefits
- Maintenance history sits beside performance data, so cause and effect are easier to confirm.
- Parts such as gaskets, filters, and sensors can be tracked in inventory with reorder levels.
- Compliance records for refrigerant handling and inspections stay in one place for audits.
KPIs to report alongside kW/ton
kW/ton is strongest when it is read with a few companion measures that explain why it moved.
Reporting rhythm
- Weekly: trend review by the lead technician or controls engineer.
- Monthly: summary for the facility manager, including open actions and cost impact.
- Seasonal: baseline refresh after major service, retrofit, or control changes.
Chiller kW/ton FAQs
What is a good kW/ton for a chiller?
It depends on type, load, and conditions. Water-cooled units are often around 0.5 to 0.7 and air-cooled around 1.1 to 1.3 at full load.
How do I convert kW/ton to COP?
Divide 3.517 by the kW/ton value. A chiller at 0.60 kW/ton has a COP of about 5.9.
Why does kW/ton change through the day?
Load, condenser water temperature, and ambient conditions all change it. Compare readings at similar conditions, or track by load band.
How often should we review kW/ton?
Review trends weekly and set alerts for sustained drift. You can schedule the review tasks in Oxmaint.
Can maintenance software help with efficiency?
Yes, it links efficiency alerts to inspections and repairs. See it in a live demo.
Stop paying for efficiency you cannot see
Give your chiller plant a baseline, a trend, and a maintenance response for every drift in kW/ton.