Facility aging infrastructure quietly drains maintenance budgets — the average commercial building asset in North America is now 24 years old, well past its designed service life in many plants, hospitals, and campuses. Without a structured facility asset age CMMS strategy, teams react to failures instead of planning replacements, and capital requests arrive late with weak documentation. This guide walks facility managers through replacement priority scoring, aging asset dashboards, and the practical CMMS workflows that turn a 20-year-old chiller population into a defensible, ranked capital plan. You can begin building yours in minutes — Start Free Trial and import your asset register today.
Can you name your ten highest-risk assets over 20 years old — before one fails on a Monday morning?
Most facility teams cannot. Aging infrastructure tracking inside a CMMS replaces guesswork with a ranked, cost-backed replacement queue your CFO can actually approve. Build the dashboard in an afternoon, not a fiscal cycle.
Aging infrastructure is now the single largest avoidable line on your maintenance budget
The U.S. Department of Energy and ASCE both track asset age as a leading indicator of unplanned downtime, energy waste, and safety incidents. The numbers below are why a facility aging infrastructure CMMS is no longer optional.
Rank every aging asset with one defensible formula
ISO 55000-aligned asset management calls for a transparent, repeatable priority score. The formula below is the one most facility teams can adopt inside a CMMS in a single afternoon — no consultants, no spreadsheets passed by email.
A worked example: a 180-asset industrial plant running this score in their CMMS identified 11 chillers and 4 AHUs above 75 priority. Capital was reallocated; the team avoided an estimated $310K in reactive repairs and 46 hours of unplanned downtime the following fiscal year.
Six tiles every facility aging dashboard must surface
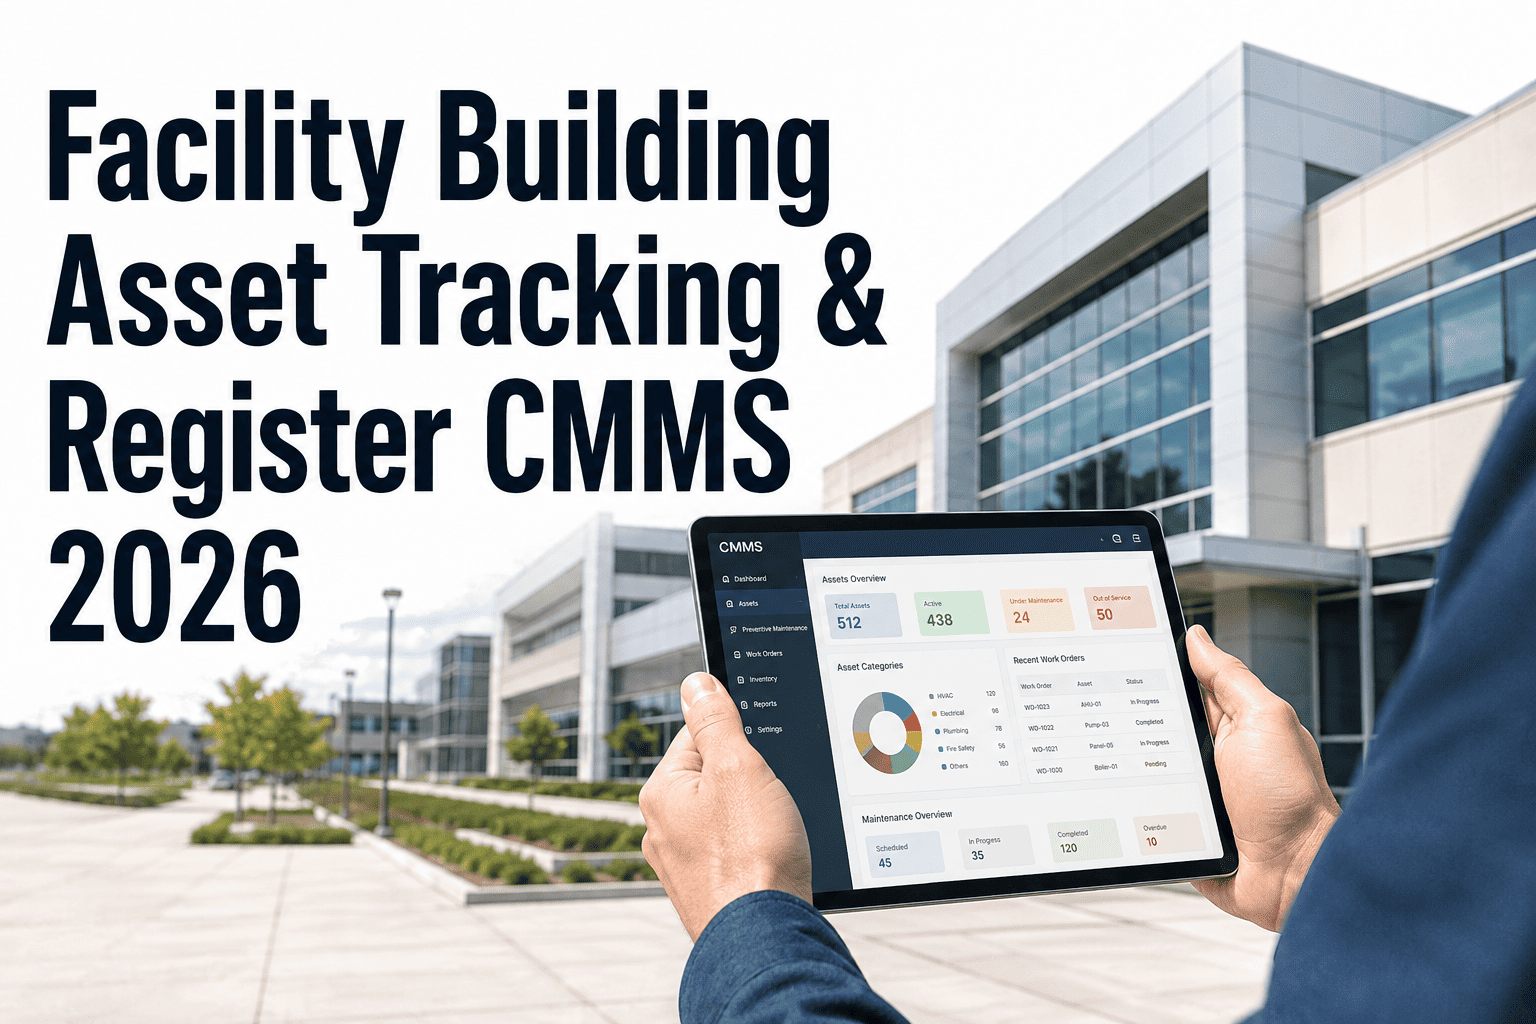
A CMMS aging asset dashboard is only useful if it answers the questions your director and CFO ask in the same meeting. These six tiles cover risk, spend, and replacement timing in one screen.
Asset Age Distribution
Histogram of asset count by age band (0–5, 6–10, 11–15, 16–20, 20+ yrs). Flags the 20+ cohort in gold so capital reviewers see the tail instantly.
Top 25 Priority Queue
Ranked list of the 25 highest-scoring assets from the priority formula, with estimated replacement cost and recommended fiscal year.
Reactive Spend by Age Band
Bar chart of trailing-12-month reactive work-order cost grouped by age band — the visual that wins capital approval in five minutes.
Remaining Useful Life
RUL countdown by asset, calculated from install date, run-hours, and condition-assessment overrides. Turns "old" into a number.
Regulatory Exposure Map
Filters aging assets by governing standard — JCAHO, FMCSA, OSHA, NFPA — so audit-ready evidence is one click away.
Capital Request Export
One-click export of the priority queue into a CFO-ready capital request with cost, rationale, risk-of-deferral, and recommended year.
From asset register to ranked capital plan in eight weeks
Most facility teams already own 80% of the data — install dates, work-order history, criticality ratings. The bottleneck is workflow, not information. Here is the phased rollout that consistently lands in under two months.
Asset register audit & install-date backfill
Import every asset into the CMMS, validate install dates against purchase orders and nameplate data, and flag missing records. Target: 95% of critical assets carry a verified install date by end of Week 2.
Criticality & service-life assignment
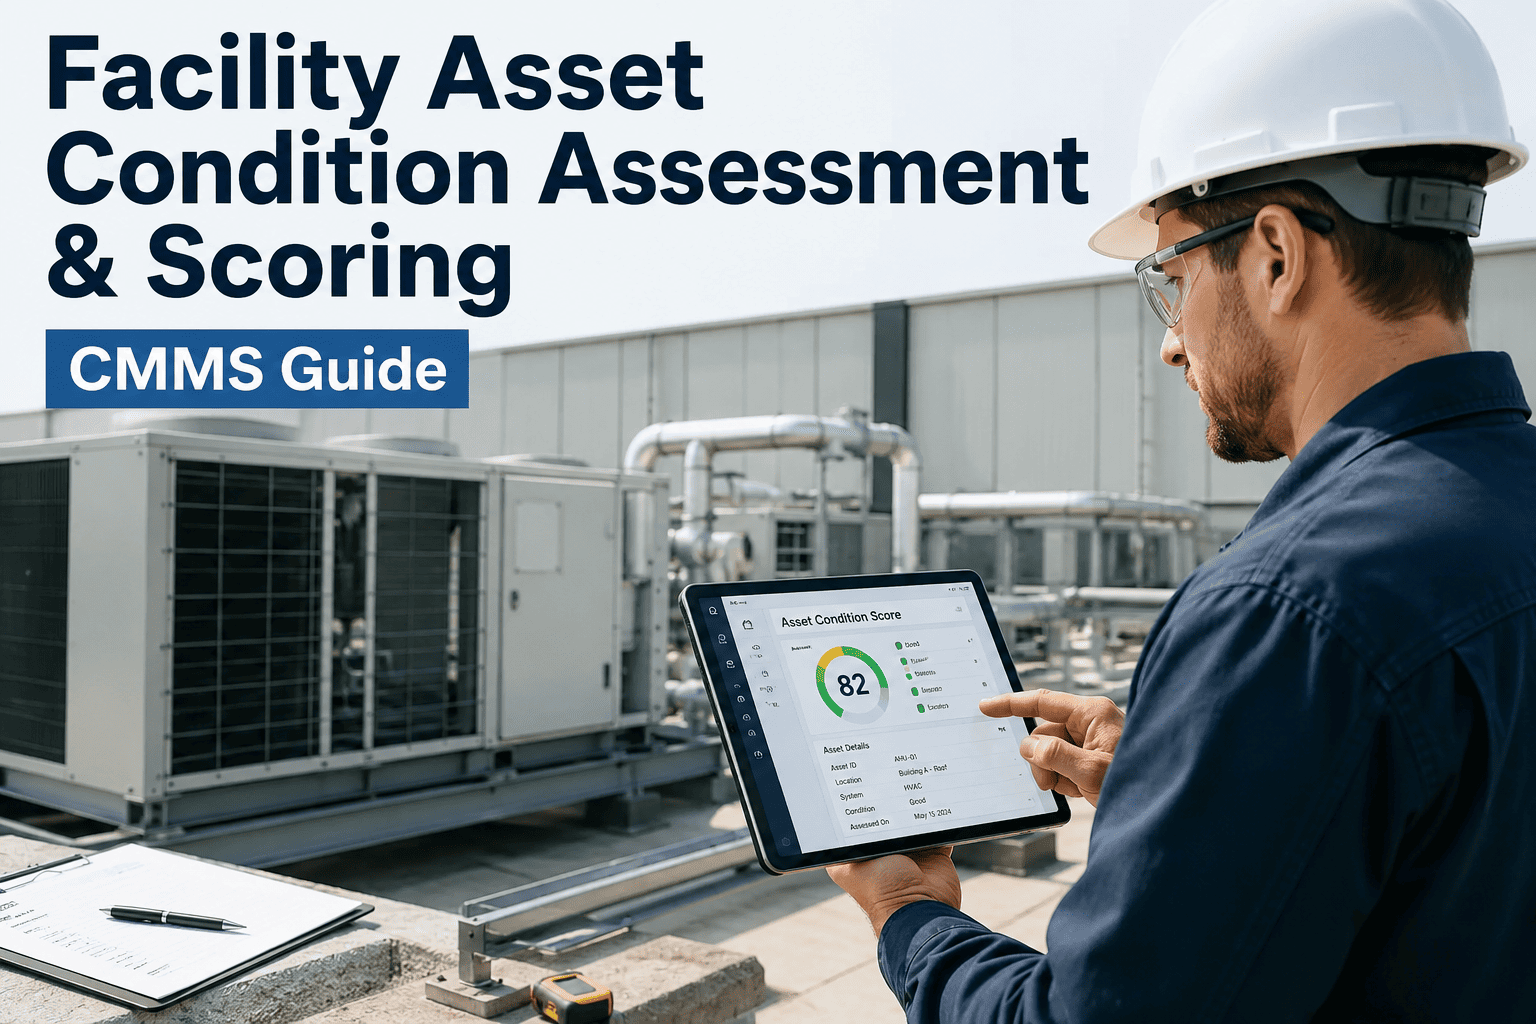
Apply a 1–5 criticality score to each asset and assign expected service life by asset class (ASHRAE or manufacturer baseline). This pair of fields powers every downstream calculation.
Priority formula configuration
Configure the four-factor priority score inside the CMMS, pull 24 months of work-order history for the failure-history factor, and weight regulatory exposure by your site's governing standards.
Dashboard launch & capital export
Publish the six-tile aging asset dashboard, train the team on the priority queue, and generate the first capital request export. Most teams present to finance in Week 8.
What changes when aging asset tracking moves into a CMMS
The shift from spreadsheet-and-memory to a structured CMMS workflow is measurable. The table below reflects outcomes reported by facility teams within 90 days of full rollout.
| Dimension | Before CMMS (typical) | After CMMS aging dashboard |
|---|---|---|
| Asset age visibility | Install dates scattered across POs, spreadsheets, and memory | Single age-distribution histogram, refreshed nightly |
| Replacement ranking | Gut feel plus whoever complained loudest last quarter | Defensible 0–100 priority score with audit trail |
| Capital request quality | Anecdotal, late, often rejected by finance | One-click export with cost, risk, and recommended year |
| Reactive spend on 20+ yr assets | 3.2× baseline; untracked by age band | Tracked, trending down 18–25% within one fiscal cycle |
| Audit readiness (JCAHO / OSHA / FMCSA) | Folder hunt, days of preparation | Regulatory exposure map, one-click evidence export |
Stop managing aging infrastructure from memory
Build your priority queue, aging dashboard, and capital request in one platform — designed for facility teams who answer to directors, auditors, and finance.
Facility aging infrastructure CMMS — the five questions every team asks
How do I calculate the remaining useful life of an aging asset in a CMMS?
Start with expected service life by asset class (ASHRAE or manufacturer baseline), subtract current age, then adjust using condition-assessment scores and run-hour data. A 24-year-old chiller on a 20-year baseline that passed condition assessment at 70% might carry 2–3 years of RUL; the same chiller with rising failure frequency might carry zero. The CMMS stores both the baseline and the override so the number stays defensible.
What asset data do I need before I can build an aging dashboard?
You need four fields per asset: a unique ID, install date, asset class, and a criticality score. Work-order history and downtime hours are strongly recommended for the failure-history factor, but you can launch the dashboard with the four core fields and layer in history later — most teams reach 90% data completeness within the first two weeks. To see the import template and field map, Book a Demo and we will walk through your register.
How does the priority score handle regulatory exposure for JCAHO or FMCSA-regulated facilities?
The regulatory exposure factor is weighted 0.2–1.0 based on the governing standard and the asset's role in compliance. A life-safety asset under JCAHO — emergency power, medical gas, fire suppression — scores 1.0. A comfort-cooling unit in a non-critical space scores 0.2. The CMMS stores the standard per asset so the exposure map is filterable and audit-ready.
Can I justify the CMMS investment to finance using aging-asset data alone?
Yes — and it is usually the fastest path to approval. The reactive-spend-by-age-band tile typically shows 2.5–3.5× higher repair cost on assets over 20 years, and the priority queue quantifies the risk of deferral in dollars. Most facility teams present the dashboard, the spend chart, and the capital export in a single 30-minute meeting and walk out with budget alignment.
How often should the aging asset dashboard and priority scores be refreshed?
Priority scores should recalculate nightly from live work-order data, and a full condition-assessment refresh should happen at least annually for critical assets. Quarterly reviews with your director and an annual capital-planning review with finance are the cadence most teams adopt. You can begin that cycle today — Start Free Trial and the dashboard is live before your next standup.
Turn 24-year-old infrastructure into a ranked, fundable capital plan
Import your asset register, configure the priority formula, and publish the aging dashboard in a single afternoon. Built for facility teams who need answers before the next failure.
Free 14-day trial · No credit card