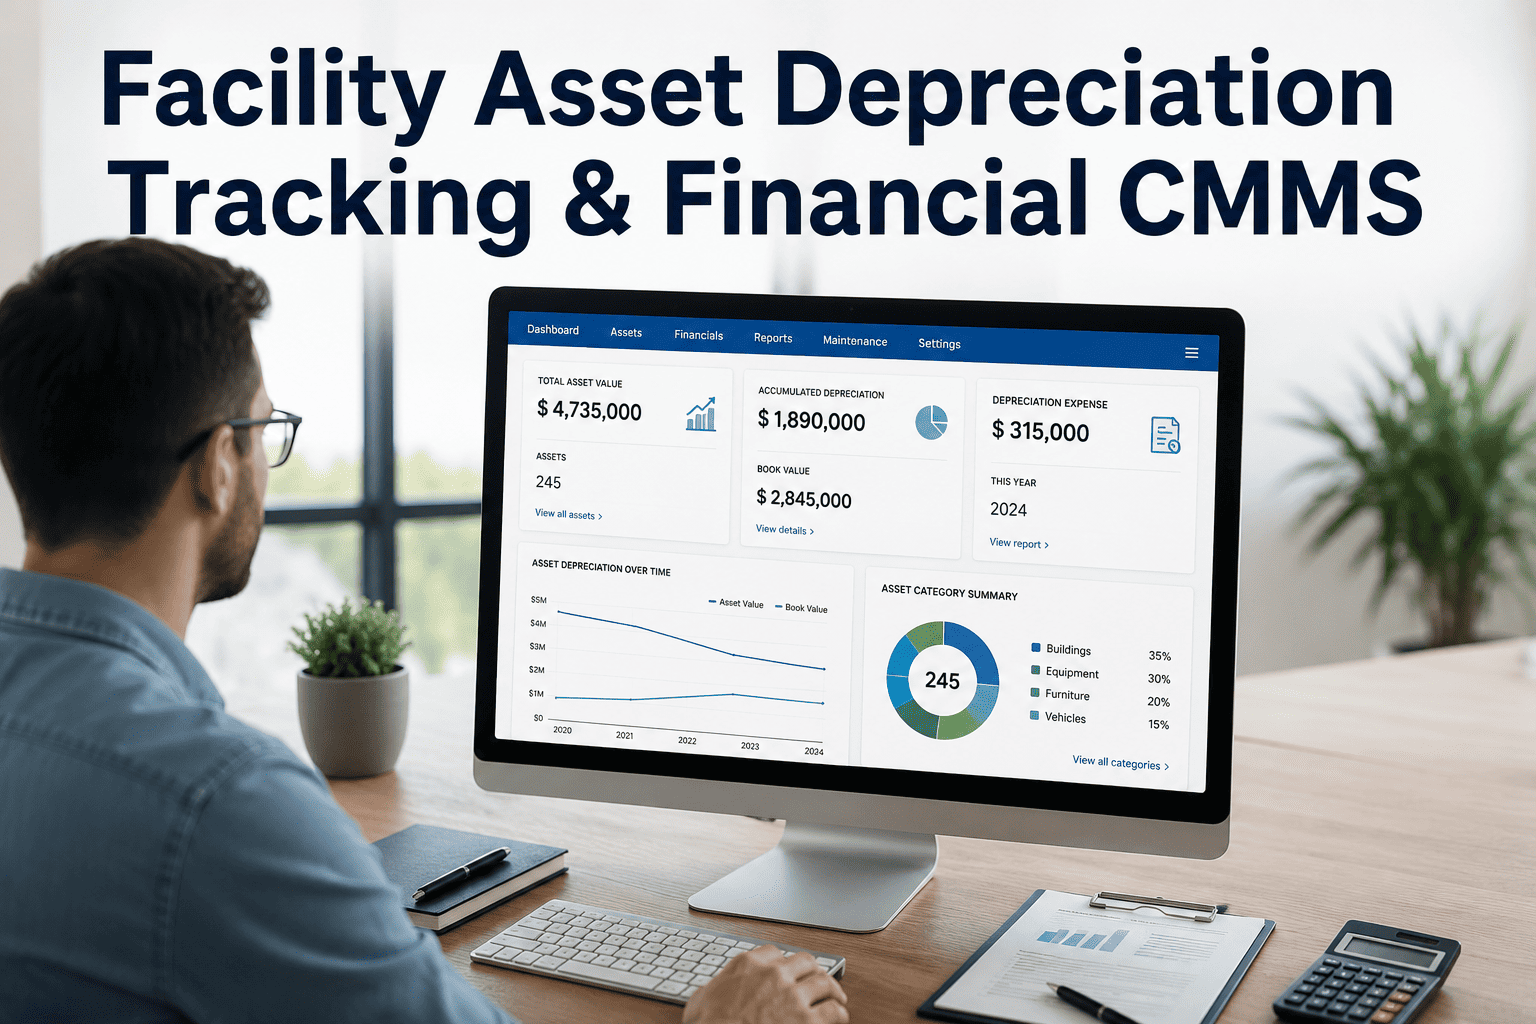
Facility asset depreciation tracking is the financial backbone of every maintenance program — yet roughly 60% of plants still reconcile book value in spreadsheets detached from their CMMS, creating audit gaps and misinformed replacement decisions. Under ISO 55000, the same system that logs work orders should also feed depreciation schedules, impairment reviews, and capital planning. A financial CMMS closes that loop, tying every asset's cost basis, useful life, and salvage value to live maintenance data so finance and operations see one number. This guide walks through depreciation methods, schedule integration, and the worked math behind facility asset book value — then shows how to operationalize it. Start your Start Free Trial to see the financial tracking module in action.
Is your CMMS quietly hiding $1.2M in ghost asset value?
Most facilities carry 12–18% of assets past their useful life without writing them down — inflating book value, skewing insurance premiums, and triggering audit findings. Financial CMMS integration closes the gap between maintenance records and the depreciation schedule in real time.
Four ways facility assets lose book value — and when each applies
Straight-line covers 70% of facility assets. Declining-balance suits fast-obsoleting tech. Units-of-production fits HVAC chillers tracked by run-hours. Sum-of-years accelerates write-offs for high-wear press equipment. Choose wrong and you either overstate asset value or lose tax shield.
Straight-Line (SL)
Equal annual deduction over useful life. Best for buildings, structural improvements, and fixed plant equipment where wear is predictable. Under MACRS, most commercial building improvements use 39-year SL.
Declining Balance (DB)
Front-loaded deduction — 200% double-declining or 150%. Ideal for IT racks, controls, and sensor networks that lose value fast in years 1–3. Switches to SL mid-life for optimal shield.
Units of Production
Ties depreciation to actual output — run-hours, cycles, tonnage. The method of choice for chillers, compressors, and production lines where CMMS meter readings already exist.
Sum-of-Years' Digits
Accelerated but smoother than DB. Used for high-wear press equipment, stamping lines, and CNC machinery where early-year utilization is heavy and resale drops steeply.
The $42K-a-year plant: calculating book value for a 180-asset facility
A 180-asset processing plant installed a new chiller (Asset ID CHL-04) for $185,000, with a 12-year useful life and $15,000 salvage value. After 5 years on a straight-line schedule, here is the exact book value a financial CMMS should report on demand.
Without CMMS integration, that $114,167 figure lives in a finance spreadsheet disconnected from the 47 work orders logged on CHL-04 this year. When operations wants to replace the chiller, finance can't see maintenance spend trending up 22% — and the replacement case stalls for two quarters.
A 4-step depreciation schedule integration timeline
Most facilities complete CMMS-to-depreciation integration in 6–10 weeks. The timeline below reflects a mid-sized 200-asset plant migrating from spreadsheet-based fixed-asset tracking to a financial CMMS module.
Asset Master Import
Import all 200 assets with cost basis, in-service date, salvage value, and current accumulated depreciation. CMMS validates against existing work-order history and flags orphans.
Method Assignment
Map each asset class to its depreciation method — SL for buildings, DB for controls, UoP for production equipment. CMMS auto-assigns defaults from asset category codes.
Live Integration
Connect CMMS meter readings (run-hours, cycles) to units-of-production schedules. Work-order costs flow to accumulated depreciation adjustments for impairment triggers.
Audit & Reconciliation
Run first month-end close inside CMMS. Reconcile to GL. Generate depreciation journal entry, impairment report, and replacement-cost forecast in one click.
What changes when depreciation lives in your CMMS
The gap between spreadsheet-based tracking and a financial CMMS is not just convenience — it shows up at audit time, at renewal time, and at every capital request meeting.
| Capability | Spreadsheet Tracking | Financial CMMS |
|---|---|---|
| Book value lookup | Manual VLOOKUP across 3–5 tabs; 15–20 min per asset | Real-time on asset profile; < 2 seconds |
| Depreciation method change | Rebuild formulas; high error risk; no audit trail | One-click switch with logged change history |
| Maintenance cost visibility | Separate report; never tied to book value | Work-order spend shows next to depreciation |
| Impairment triggers | Quarterly review; reactive; often missed | Auto-flagged when repair cost > 15% of book value |
| Audit trail | Version history in Excel; weak chain of custody | Full change log with user, timestamp, old/new value |
| Month-end close | 2–3 days of manual journal entry prep | Auto-generated JE posted in under 10 minutes |
The cost of staying on spreadsheets — and the payback of switching
A 2025 survey of 340 facility managers found that plants on financial CMMS modules close month-end 78% faster and catch impairment events 4× sooner than spreadsheet-dependent peers.
"We found $340K in fully depreciated assets still on the floor with active work orders. Pulling depreciation into the CMMS cut our month-end from 3 days to 4 hours and gave us a real replacement-cost forecast for the first time."
Stop reconciling depreciation by hand
See live book value, impairment flags, and depreciation journal entries inside the same system your technicians already use.
Facility asset depreciation tracking — answered
What depreciation methods does a financial CMMS support?
Most financial CMMS platforms support straight-line, declining balance (150% and 200%), units-of-production, and sum-of-years' digits. The system auto-assigns a default method based on asset category — buildings default to SL, IT assets to DB, and production equipment to UoP — but you can override per asset. Method changes are logged with user, timestamp, and prior value for full audit traceability.
How does the CMMS connect to my general ledger?
The CMMS generates a depreciation journal entry at month-end that maps to your chart of accounts — typically a debit to depreciation expense and credit to accumulated depreciation. Most systems export the JE as a CSV, direct API post, or pre-formatted file for QuickBooks, Sage Intacct, NetSuite, and Dynamics. You can Book a Demo to see the GL mapping workflow for your specific accounting platform.
When should an asset be flagged for impairment review?
A financial CMMS should auto-flag impairment when cumulative repair spend in the trailing 12 months exceeds 15% of current book value, or when an asset's condition rating drops below a defined threshold. Other triggers include physical damage events, extended downtime beyond 30 days, and technological obsolescence — each of which the CMMS can detect from work-order data and alert finance automatically.
Can I migrate existing depreciation schedules from Excel?
Yes. The standard migration path imports a CSV with asset ID, description, cost basis, in-service date, salvage value, useful life, method, and accumulated depreciation to date. The CMMS validates each row against existing asset records, flags mismatches, and rebuilds the depreciation schedule from the in-service date forward so historical entries reconcile. Most 200-asset migrations complete within the first two weeks.
How long does it take to see ROI from financial CMMS depreciation tracking?
Typical payback is 3–5 months. The recovery comes from three sources: faster month-end close (saving 20–40 finance hours per cycle), recovered tax shield from correctly assigned methods (averaging $14K per 100 assets annually), and avoided over-insurance on fully depreciated assets still on the books. You can start a Start Free Trial to run the numbers against your own asset register.
Your assets are depreciating right now. Is your CMMS tracking it?
Join the facilities using OxMaint to unify maintenance records with depreciation schedules, impairment flags, and capital planning — in one system.
Free 14-day trial · No credit card