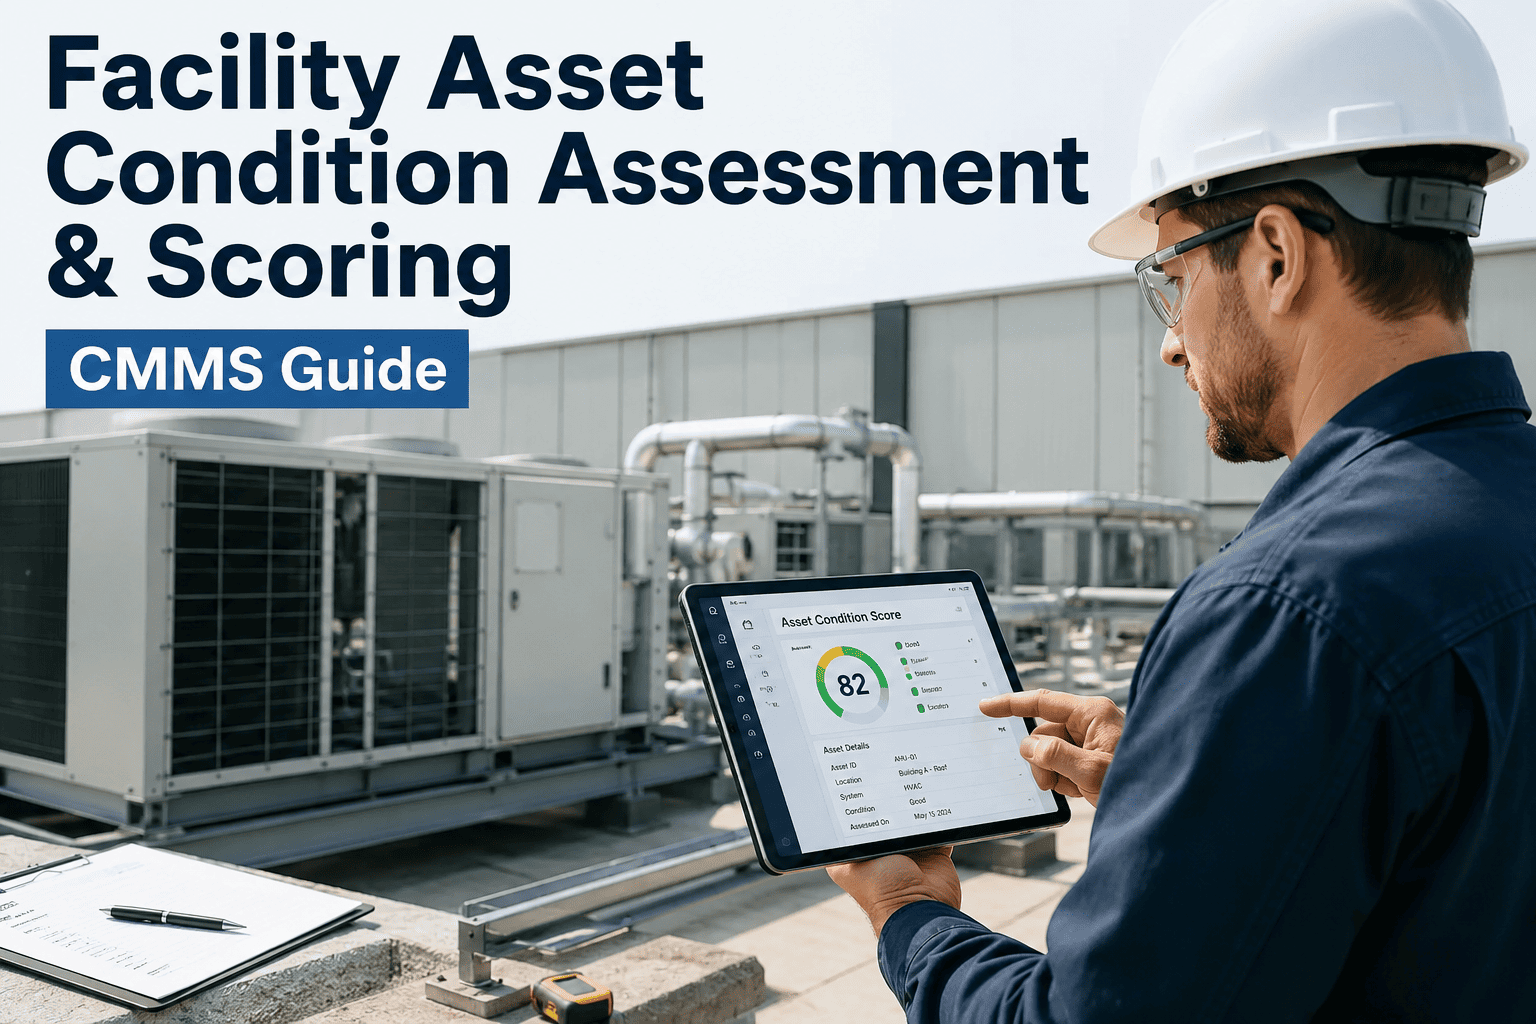
Facility asset condition assessment is the disciplined practice of inspecting, scoring, and tracking the physical state of equipment and infrastructure so maintenance teams can prioritize spend before failure. A standardized condition scoring methodology—typically a 1-to-5 or 0-to-100 scale aligned with ISO 55000—turns subjective walk-downs into defensible, comparable data that feeds directly into a CMMS. When scoring is paired with visual inspection criteria and live condition tracking, plants routinely cut unplanned downtime by 20–40% and extend asset useful life by 3–7 years. Ready to operationalize it? Start Free Trial and build your first condition register this week.
What if every asset in your facility carried a single, defensible condition score?
Without one, 60% of maintenance budgets are spent reacting to failures. With a CMMS-driven scoring model, you inspect once, score once, and let the system rank 1,000+ assets by risk and remaining useful life—automatically.
Why facilities without condition scores overspend by 30%
The U.S. Department of Energy estimates that reactive maintenance costs 3–5× more than planned work. Yet most facilities still run asset evaluation on clipboards and tribal memory—so the wrong assets get replaced, and the risky ones run to failure.
The 1–5 condition score, decoded
A defensible condition score combines physical deterioration, performance degradation, and failure history into one number per asset. Below is the industry-standard scale used inside ISO 55000-aligned CMMS workflows.
| Score | Condition Label | Visual Inspection Criteria | CMMS Action Triggered | Typical Remaining Life |
|---|---|---|---|---|
| 1 | Excellent | Like-new, no corrosion, OEM performance, full service history | Routine PM only, annual inspection | 80–100% RUL |
| 2 | Good | Minor wear, cosmetic surface rust, performance within 5% of spec | Standard PM cycle, 6-month check | 60–80% RUL |
| 3 | Fair | Visible deterioration, 5–15% performance drift, intermittent alerts | Accelerated PM, quarterly inspection | 30–60% RUL |
| 4 | Poor | Significant corrosion, 15–30% performance loss, recurring breakdowns | Conditional run, monthly inspection, capex evaluation | 10–30% RUL |
| 5 | Critical | Imminent failure, >30% performance loss, safety risk present | Immediate remediation or replacement | <10% RUL |
How to calculate a composite condition index
A single visual grade is not enough for capex justification. The composite condition index blends three weighted dimensions so a shiny-but-failing pump does not score better than a rusty-but-reliable fan.
Each sub-score uses the 1–5 scale. The 50/30/20 weighting can be tuned per asset class—a safety-critical boiler may weight Failure History at 40%.
A score of 3.7 places AHU-07 in the "Fair-to-Poor" band—flagging it for quarterly inspection and a capex pre-study, not a reactive rebuild.
From walk-down to live condition dashboard in 6 steps
A 180-asset facility spending $42K/yr on reactive repairs can stand up a CMMS-based condition program in under 90 days. Here is the step-by-step sequence that turns one inspection cycle into a continuously updated asset health register.
Import all assets into the CMMS with location, install date, OEM specs, and a criticality tier (A/B/C). A-tier assets get 6-month inspection; C-tier get annual.
Attach a 10–15 point visual checklist to each class (pumps, fans, switchgear, roofing). Checklists auto-launch in the CMMS mobile app so techs capture data on-site.
A two-person team scores every A-tier asset in weeks 1–4. Expected throughput: 25–35 assets per inspector per day using the mobile checklist.
The CMMS auto-calculates the composite condition index from the three sub-scores and publishes a ranked asset health register visible to operations and finance.
Scores of 4–5 auto-generate work orders or capex requests. Scores of 3 reschedule the next PM. No human interpretation needed—rules run inside the CMMS.
Re-inspect A-tier every 6 months, B-tier annually, C-tier every 18 months. The register updates live, giving leadership a always-current capital plan.
Turn one inspection cycle into a year of defensible capital plans.
Stand up a CMMS-backed condition register in under 90 days and stop replacing the wrong assets.
Spreadsheet condition tracking vs. CMMS scoring
The same facility, the same assets—two different management approaches. The gap between a static Excel register and a live CMMS condition engine is where 20–40% of downtime hide.
- ✕ Scores live in one technician's Excel file; no version control
- ✕ Re-inspection cadence is "whenever someone remembers"
- ✕ No link between condition score and work-order trigger
- ✕ Capex requests take 4–6 weeks to justify with photos and email
- ✕ Average score drift: ±1.5 points between inspectors
- ✓ Every score lives in the asset master, time-stamped and auditable
- ✓ Auto-scheduled re-inspection per criticality tier, mobile-reminder driven
- ✓ Scores of 4–5 auto-generate work orders or capex requests
- ✓ One-click capex report with photos, trend, and CCI justification
- ✓ Inspector variance drops below ±0.3 with standardized checklist
A 180-asset food-processing plant spending $42K/yr on reactive repairs deployed CMMS condition scoring in 11 weeks. Within the first year they identified 14 assets scoring 4–5 that had been "on the list" for replacement—and 9 assets scoring 1–2 that had capex requests pending. Net result: $61K redirected from unnecessary replacements to genuinely failing equipment, and unplanned downtime dropped 27%.
Facility asset condition assessment — answered
A-tier (safety-critical, production-critical) assets should be re-scored every 6 months; B-tier annually; C-tier every 18 months. The cadence should be automated inside the CMMS so no asset falls through the cracks—manual reminders fail at scale once you exceed ~200 assets.
Condition assessment is a periodic, inspector-driven scoring event—usually visual plus performance check. Condition monitoring is continuous, sensor-driven (vibration, oil analysis, thermal). The strongest programs feed both into the CMMS so the composite condition index reflects both the walk-down grade and live sensor anomalies. To see how this works in practice, Book a Demo and we will walk you through a live dashboard.
Yes. Rules are set per asset class: a score of 4 can auto-create a corrective work order, a score of 5 can auto-create a capex request with photos and CCI attached, and a score of 3 can shorten the next PM interval by 50%. This removes the human judgment gap that causes 30% of mis-prioritized spend.
A 200-asset facility typically completes inventory, checklist design, first walk-down, and CMMS go-live in 8–12 weeks. The bottleneck is usually the first physical inspection cycle, not the software. Expect 25–35 assets per inspector per day using a mobile checklist. You can begin building yours today—Start Free Trial takes under five minutes.
ISO 55000 is the global reference for asset management and provides the vocabulary and lifecycle framework your scoring system should map to. For physical condition grades specifically, many facilities adapt ASTM E2018 (Standard Guide for Property Condition Assessments) or FCA methodologies used in commercial real estate, then tailor the scale to their asset classes.
Your assets already have a condition. Start tracking it.
Build a defensible condition register, auto-trigger work from scores, and stop replacing the wrong equipment. Free 14-day trial · No credit card.
Free 14-day trial · No credit card