Every facility has a list of assets, but very few have a list of consequences. A failed transformer, sump pump or chilled water loop does not just stop itself; it stops whatever depends on it. A business impact analysis (BIA) traces that chain before the failure happens, so maintenance effort follows real consequences rather than habit. This guide shows facility teams how to run one, and you can hold the results in an asset register in Oxmaint that drives your PM priorities.
Facility Business Impact Analysis: What Fails If This Asset Fails
Trace downstream damage, set recovery targets and rank assets by consequence, so critical equipment gets the maintenance it has earned.
What a facility BIA actually answers
A BIA is a structured way of asking one question about every important asset: if this stops, what else stops, how fast, and how bad does it get?
Why it differs from a simple condition survey
A condition survey tells you how likely an asset is to fail. A BIA tells you how much the failure costs. Prioritizing on both is what separates useful criticality ranking from a guess.
The standards behind the method
Two references shape most BIA practice. Neither is written only for facilities, but their concepts translate directly.
ISO 22301
The international standard for business continuity management. It expects organizations to analyze impact over time and identify the activities and resources that support critical services.
NIST SP 800-34
A US contingency planning guide. Its BIA process identifies critical functions, resource dependencies and recovery priorities, and it defines the recovery timing terms below.
Recovery terms in plain language
| Term | Meaning | Facility example |
|---|---|---|
| Maximum tolerable downtime | The longest an outage can last before consequences become unacceptable | How long a hospital wing can lose cooling |
| Recovery time objective | The target time to restore the asset or a workaround | Restoring standby power within a set window |
| Dependency | A resource another asset or process needs to function | Chillers depending on electrical supply and water |
| Single point of failure | An asset with no redundancy behind it | One feeder supplying an entire floor |
Use these terms consistently so operations, finance and maintenance are ranking assets against the same definitions.
The facility BIA workflow
A practical BIA can be run in weeks, not months, if scope and method are kept disciplined.
Define scope
Choose the site, building or system group. Start with one building or one critical service, not the entire portfolio.
List critical activities
Identify what the facility must keep doing, such as patient care, production, data hosting or tenant occupancy.
Map dependencies
Link each activity to the assets, utilities and spaces it needs, including upstream supply.
Rate the impact
Score consequences over time using agreed categories and downtime windows.
Check redundancy
Confirm what backup exists, whether it is tested and how long it can carry the load.
Rank and act
Turn scores into criticality tiers and link each tier to a maintenance strategy.
Keep impact scores attached to the asset itself
Oxmaint stores asset hierarchies, criticality and maintenance history together, so consequence and condition can be read side by side.
Impact categories to score
Scoring only financial loss hides the real risk. Score each asset across several consequence types, then use the highest or a weighted total.
| Category | Questions to ask |
|---|---|
| Safety and life | Could failure endanger occupants, patients or workers, or disable life safety systems? |
| Regulatory and compliance | Would failure breach permits, codes, licenses or inspection requirements? |
| Operational | Which services stop, slow or move, and for how long? |
| Financial | What are lost revenue, penalties, emergency repair and recovery costs? |
| Asset and environment | Would failure damage other equipment, stored goods or the building? |
| Reputation and contracts | Would tenants, customers or partners be affected or entitled to remedies? |
Score over time, not just once
Impact grows with duration. Rate each asset at set points, such as one hour, one day and one week, to reveal when a tolerable outage becomes a severe one.
Turning scores into a criticality matrix
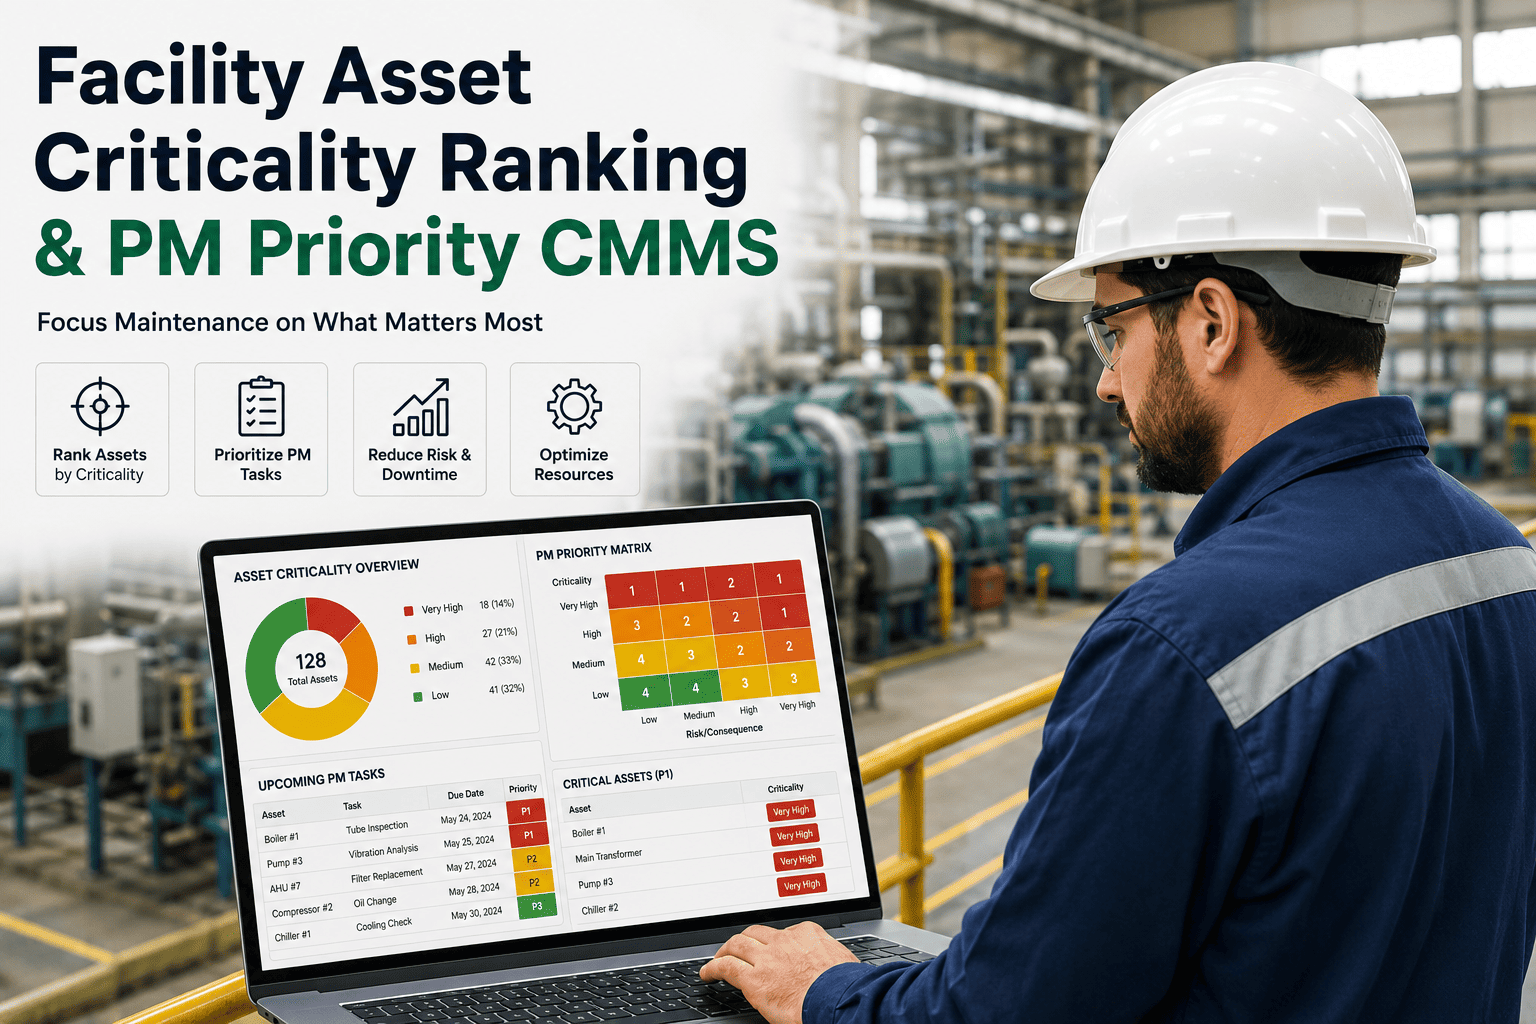
Combine impact with failure likelihood or detectability to place each asset on a simple grid. The bands below are an illustrative structure, not a fixed standard.
Tier definitions
- Critical: failure causes severe consequences; requires preventive maintenance, condition monitoring, spares and a tested recovery plan
- Prioritize: important assets that warrant tighter PM intervals and defined response times
- Monitor: watch key readings and inspect periodically
- Routine: standard PM or run-to-failure where consequences are minor
Assets a facility BIA almost always flags
Every building is different, but the same categories of equipment tend to rise to the top because so many other systems depend on them.
Electrical distribution
Main switchgear, transformers, UPS systems and standby generators. Almost everything downstream depends on them.
Cooling plant
Chillers, cooling towers and chilled water pumps, especially where they serve data, labs, healthcare or process areas.
Fire and life safety
Alarm panels, suppression systems, smoke control and emergency lighting, which carry safety and compliance weight.
Water systems
Booster pumps, sump pumps, backflow devices and water treatment, where failure can flood or halt service.
Vertical transport
Elevators and escalators in high-rise and healthcare settings, where access and evacuation matter.
Building controls
Automation servers and network gear that coordinate other systems and hide faults when they fail.
Treat this list as a starting hypothesis and test it against your own dependency maps rather than assuming.
A worked scoring example (illustrative)
The scores below are invented to show the method, not benchmarks. Use your own scale and definitions.
| Asset | Safety | Operational | Compliance | Redundancy | Tier |
|---|---|---|---|---|---|
| Main switchgear | 4 | 5 | 4 | None | Critical |
| Standby generator | 5 | 4 | 5 | Partial | Critical |
| Chilled water pump A | 2 | 4 | 2 | Pump B | Prioritize |
| Lobby fan coil | 1 | 1 | 1 | None | Routine |
Reading the result
Pump A scores high on operations but has a standby, so it ranks below assets with no backup. Redundancy changes the tier only if the backup is maintained and tested.
Before and after: maintenance with and without a BIA
Without a BIA
- PM effort is spread evenly across assets
- Criticality is decided by whoever shouts loudest
- Spares are stocked by habit, not consequence
- Shared dependencies stay hidden until an outage exposes them
With a BIA
- PM depth follows criticality tiers
- Recovery targets are written down and agreed
- Critical spares are identified and stocked
- Single points of failure are known and planned for
From BIA results to maintenance strategy
A BIA has value only if it changes what maintenance does. Link each tier to specific practices.
| Tier | Preventive maintenance | Monitoring | Spares and response |
|---|---|---|---|
| Critical | Tight intervals, full inspection, tested backup | Condition monitoring where feasible | Critical spares on site, defined emergency response |
| Prioritize | Standard PM with shorter intervals on key tasks | Periodic readings and alerts | Spares within fast reach, priority scheduling |
| Monitor | Standard PM | Round-based checks | Normal supplier lead times |
| Routine | Basic PM or run-to-failure | Inspection during rounds | Order on demand |
Where Oxmaint supports it
- Asset hierarchies that show parent and child equipment and what each serves
- Criticality fields that drive PM schedules and work-order priority
- Preventive maintenance and inspection schedules by tier
- Inventory tracking for critical spares and minimum stock levels
- Work-order history and reports to show the effect on downtime
Mapping dependencies the right way
Most surprises in an outage come from hidden dependencies. Map each critical activity backward through everything it needs, layer by layer.
Questions that expose hidden links
- Does the standby generator depend on the same fuel supply, transfer switch or control panel as the main system?
- Are both redundant pumps fed from the same electrical panel?
- Does the building automation system control life safety or cooling functions that continue without it?
- Which assets need cooling, ventilation or water to keep running themselves?
- Which suppliers or contractors are required to restore service, and how quickly can they respond?
Redundancy on paper often shares a common cause. Two pumps behind one breaker are one point of failure, not two.
Who should be in the room
Maintenance knows how assets fail. It does not always know what the business would lose. A BIA works when both views meet.
Facilities and maintenance
Provides equipment knowledge, failure history, redundancy and repair times.
Operations or tenants
Explains which activities matter most and how long they can pause.
Safety and compliance
Identifies regulatory duties, permits and life safety obligations.
Finance or risk
Helps estimate cost of downtime and supports agreement on scoring scales.
IT and controls
Covers networks, automation systems and equipment that rely on them.
Contractors and OEMs
Confirms lead times, service contracts and emergency support terms.
Gathering evidence instead of opinions
Scores drawn from opinion tend to favor whoever speaks first. Anchor them to records wherever possible.
| Question | Evidence source |
|---|---|
| How often has this asset failed? | Work-order and breakdown history |
| How long did repair take? | Work-order timestamps and contractor invoices |
| What did past outages cost? | Finance records, incident reports and tenant claims |
| What does it serve? | Single-line diagrams, piping schematics and control drawings |
| Is the backup reliable? | Test logs and inspection records |
| What rules apply? | Permits, insurer requirements and code inspections |
Fill gaps honestly
Where records are missing, mark the score as an estimate and plan to improve the data. Guessing silently is worse than admitting a gap.
Recovery planning for the top tier
Once critical assets are identified, prepare for the day one fails. A BIA that stops at ranking leaves the hardest work undone.
Write a response procedure
Define who is called, what is isolated and what temporary measures are available.
Stock critical spares
Hold parts with long lead times, such as contactors, control boards, seals and fuses.
Secure support agreements
Confirm emergency response times with contractors and manufacturers in writing.
Test backups regularly
Exercise generators, transfer switches and standby pumps under realistic conditions and record results.
Rehearse and review
Run tabletop exercises and update procedures after each real event.
Industry differences in what counts as critical
The same generator ranks differently in a warehouse and a hospital. The consequence, not the equipment, sets the tier.
Healthcare and life sciences
- Clinical continuity and patient safety dominate scoring
- Medical gas, pressure control and standby power are usually top-tier
- Regulatory inspection records carry high weight
Data centers and offices
- Cooling and electrical continuity drive most risk
- Tenant agreements often define acceptable downtime
- Redundancy design and testing are central
Manufacturing and cold storage
- Production lines, refrigeration and product loss set the stakes
- Utilities such as compressed air and process cooling rank high
- Spare part lead times matter
Hospitality and residential
- Guest safety, hot water, elevators and heating drive impact
- Reputation and occupancy effects grow with outage length
- Life safety compliance remains a fixed priority
Common BIA mistakes
- Scoring assets in isolation instead of tracing dependencies
- Rating everything critical, which makes ranking meaningless
- Assuming backups work without testing them
- Leaving operations, safety and finance out of the scoring conversation
- Treating the BIA as a one-time project rather than a living record
- Ignoring upstream utilities and third-party services the site relies on
Checklist for a defensible BIA
- Scope, scoring scales and definitions are written down and agreed by operations and maintenance
- Every critical activity is linked to the assets and utilities that support it
- Downtime tolerance is stated in hours or days, not adjectives
- Redundancy claims are backed by test records and shared-cause checks
- Each critical asset has a named owner, a response procedure and identified spares
- Scores, evidence and assumptions are stored with the asset record so they can be audited and updated
- Review dates are set, and triggers for early review are defined
Keep it current
Review scores after major changes, such as new tenants, process changes, equipment replacement or failures. A BIA that is a year out of date can rank assets wrongly.
Frequently asked questions
How is a BIA different from a criticality assessment?
A BIA focuses on consequence and downtime tolerance. Criticality ranking combines it with likelihood and condition.
Do we need ISO 22301 certification?
No. You can borrow its BIA concepts without certifying. Check contractual or regulatory requirements.
Where should we start?
One building or critical service. Build the asset register first.
How often should scores be reviewed?
Annually and after major changes or significant failures.
Can criticality drive PM schedules?
Yes. Book a demo to see tier-based scheduling.
Know what fails before it fails
Rank assets by consequence, connect them to maintenance plans and keep the evidence in one place.