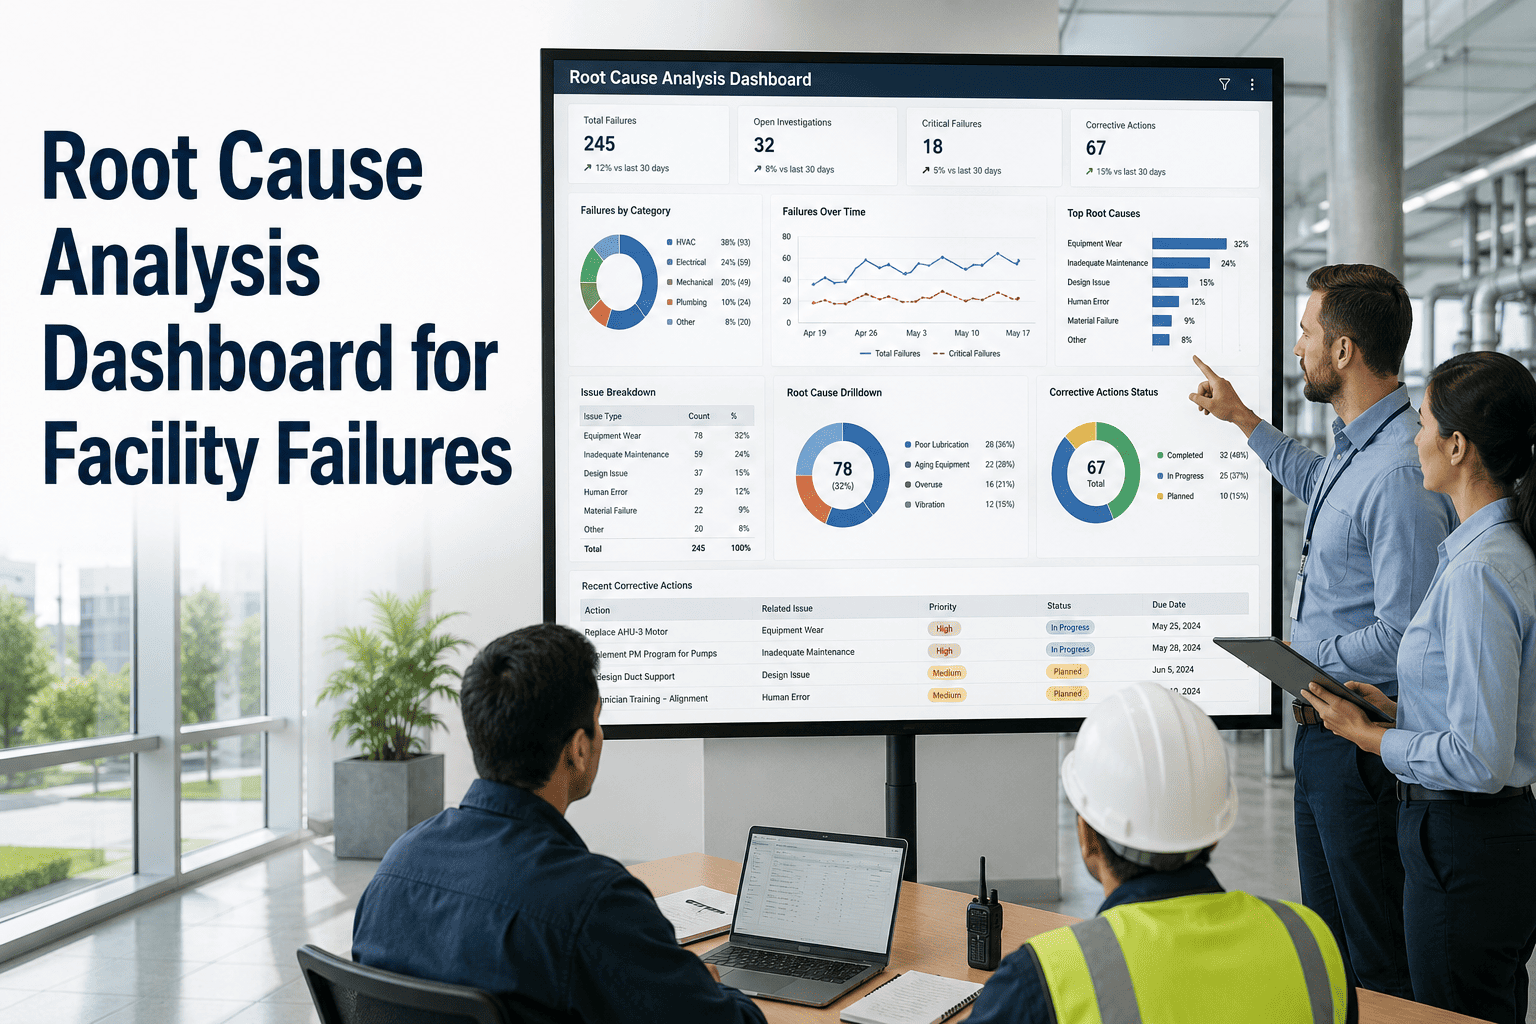
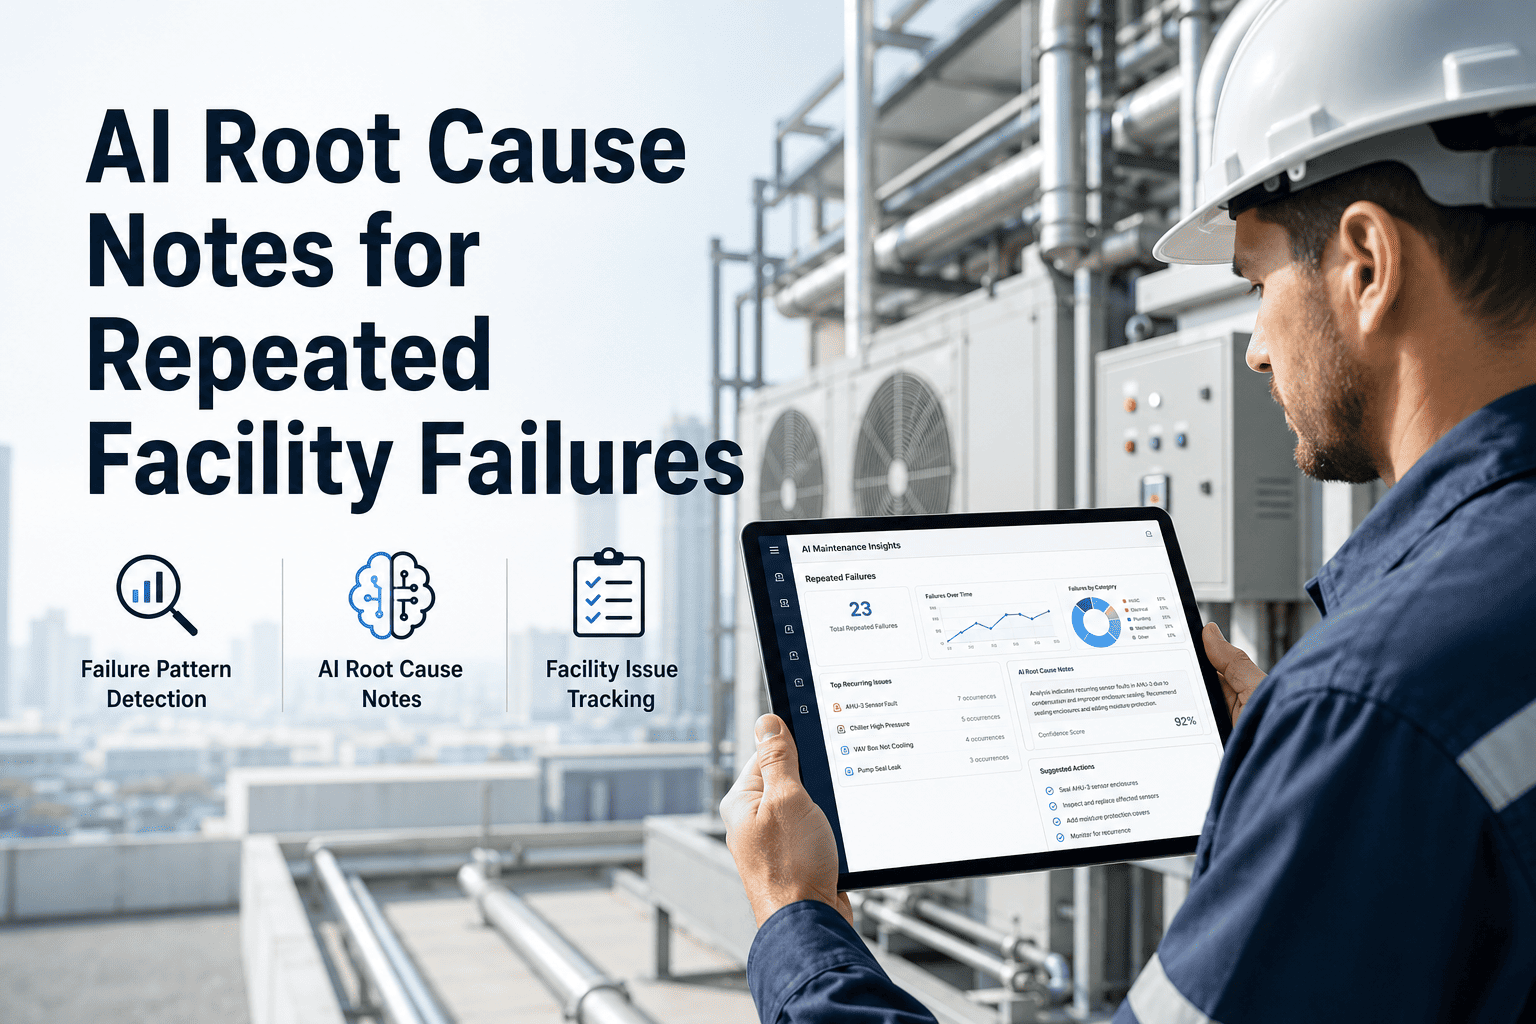
Fixing the same HVAC unit three times a year is not a maintenance problem — it is a data problem. Most facilities fix failures one at a time without ever asking why the same asset, or the same type of asset, keeps generating work orders. The answer is buried in work order history, and without a root cause analysis dashboard, it stays buried. Oxmaint's analytics platform surfaces recurring failure patterns across every asset class — HVAC, electrical, plumbing, and life safety — giving facility teams the insight to fix the cause, not just the symptom. If your maintenance budget is being consumed by repeat failures, book a 30-minute analytics review to identify your highest-frequency failure patterns before the next breakdown occurs.
Failure Pattern Intelligence
Fix the Pattern, Not Just the Problem
Root cause analytics across HVAC, electrical, plumbing, and life safety — turning repeat failures into preventable events.
$18,400
Average annual cost of one repeat failure pattern
3.2x
More likely to recur without root cause intervention
67%
Of facility failures are preventable with pattern data
Asset Classes With the Highest Repeat Failure Rates
Across commercial and institutional facilities, these four systems generate the most recurring failures — and carry the highest cost when root causes go unaddressed.
HVAC Systems
38%
Repeat failure rate without RCA
Top Root Causes
Filter change intervals mismatched to load
Coil cleaning deferred beyond threshold
Refrigerant leak identified late
Electrical Systems
27%
Repeat failure rate without RCA
Top Root Causes
Overloaded circuits not flagged by PM
Panel infrared inspection gaps
Aging breaker not captured in asset register
Plumbing Systems
22%
Repeat failure rate without RCA
Top Root Causes
Water pressure variations unchecked
Fixture failure pattern by building zone
Backflow preventer PM not scheduled
Life Safety Systems
19%
Repeat failure rate without RCA
Top Root Causes
Battery backup not load-tested per cycle
Sprinkler head corrosion not inspected
Fire suppression valve position not logged
Your repeat failures are visible in your work order data. Oxmaint's RCA dashboard finds the patterns your team doesn't have time to see manually.
What the Root Cause Analysis Dashboard Shows You
Oxmaint's RCA dashboard is not a static report. It is a live analytics view that surfaces patterns as they emerge — so teams act before the third breakdown, not after it.
01
Failure Frequency Heatmap
A visual map of failure frequency by asset class, location, and time period. Hotspots emerge clearly — showing which systems and buildings generate disproportionate breakdown volume.
02
Mean Time Between Failures (MTBF) Trending
MTBF is calculated automatically for every asset and tracked over time. A declining MTBF trend is the earliest signal that an asset is approaching accelerated degradation — before a full failure event.
03
Failure Mode Library
Common failure modes are auto-classified from work order descriptions using NLP — building a categorized failure history that replaces free-text search through years of unstructured notes.
04
PM Gap Identification
The dashboard cross-references failure events with PM schedule adherence — flagging which missed or delayed preventive tasks correlate most strongly with subsequent failure events.
RCA Impact by the Numbers
| Outcome |
Without RCA Analytics |
With Oxmaint RCA |
| Repeat failure rate |
35–45% |
Under 12% |
| Mean time to identify failure pattern |
Never (reactive only) |
30-day rolling window |
| PM schedule refinement |
Annual, opinion-based |
Continuous, data-driven |
| Maintenance cost per asset class |
Flat or growing year-over-year |
Declining after root cause resolution |
| Leadership reporting on reliability |
No structured data |
Monthly MTBF and trend report |
"
Reactive maintenance that never investigates root cause is not a maintenance program — it is a breakdown response program. Facilities with RCA analytics embedded in their daily operations consistently achieve 25–35% reduction in unplanned failures within the first year because they stop treating symptoms and start eliminating failure modes. The data has always been there; what was missing was the tool to surface it.
Frequently Asked Questions
How does Oxmaint identify recurring failure patterns from work order history?
Oxmaint analyzes work order data across three dimensions: failure type classification from work order descriptions, asset linkage to identify which specific units generate repeated closures, and time-pattern analysis to detect seasonal or usage-triggered cycles. The system flags any asset or asset class where failure frequency exceeds threshold values and presents the pattern in the RCA dashboard view automatically.
Start your free trial and import 12 months of work order history to generate your first failure pattern report.
How much historical work order data does Oxmaint need to detect patterns?
Oxmaint begins surfacing meaningful failure patterns with as little as 6 months of work order history. Patterns become statistically reliable with 12 months of data, and seasonal failure cycles require at least 18–24 months to detect accurately. All historical data can be imported from your existing CMMS, Excel files, or CSV exports during initial setup.
Book a session to discuss your data availability and what patterns are detectable from your current records.
Can Oxmaint's RCA dashboard be used to update or refine PM schedules?
Yes. The PM gap identification feature directly links failure events to preceding PM activities — or their absence. When a correlation is found between missed PM intervals and subsequent failures, Oxmaint surfaces a recommended PM schedule adjustment for review and approval. This closes the loop between failure analysis and prevention, creating a continuously improving maintenance program.
Sign up to see how the PM refinement workflow operates in a live environment.
Does the RCA dashboard work for both single-site and multi-site facility portfolios?
Oxmaint's RCA analytics operates across all sites simultaneously — allowing facility directors to identify whether a failure pattern is site-specific (suggesting a local maintenance or equipment issue) or portfolio-wide (suggesting a systemic PM or specification problem). Cross-site pattern comparison is one of the most valuable capabilities for enterprise facility teams managing standardized building systems across multiple locations.
Book a demo to see the multi-site RCA view in action.
Stop Repairing the Same Failures. Start Eliminating Them.
Oxmaint's root cause analysis dashboard finds recurring failure patterns across every asset class — so your team fixes the cause, not just the consequence.