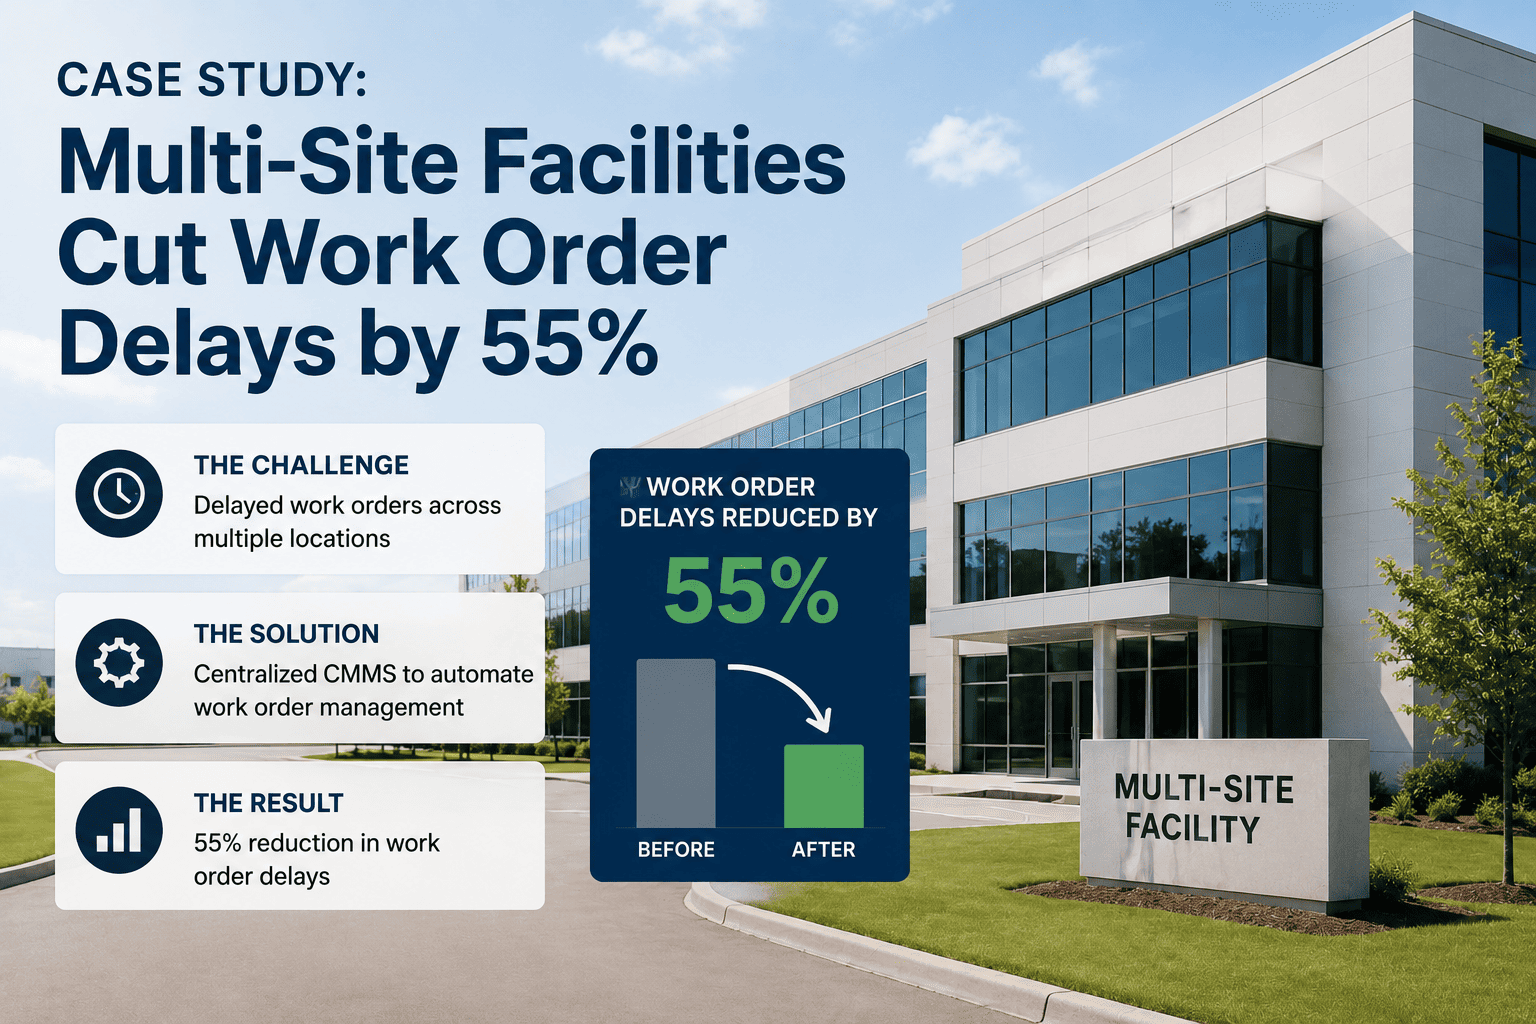
A chiller that fails every 14 months is not a maintenance problem — it is a reliability problem, and no amount of reactive repair will solve it. Mean Time Between Failure (MTBF) is the metric that makes invisible failure patterns visible, turning raw breakdown history into a number every FM director can act on. When your CMMS tracks MTBF by asset type, location, and age, you stop replacing parts and start replacing decisions. OxMaint's analytics engine calculates MTBF automatically for every tracked asset — so your next capital decision is backed by data, not gut feel.
Article · Analytics & KPIs · Facility Management
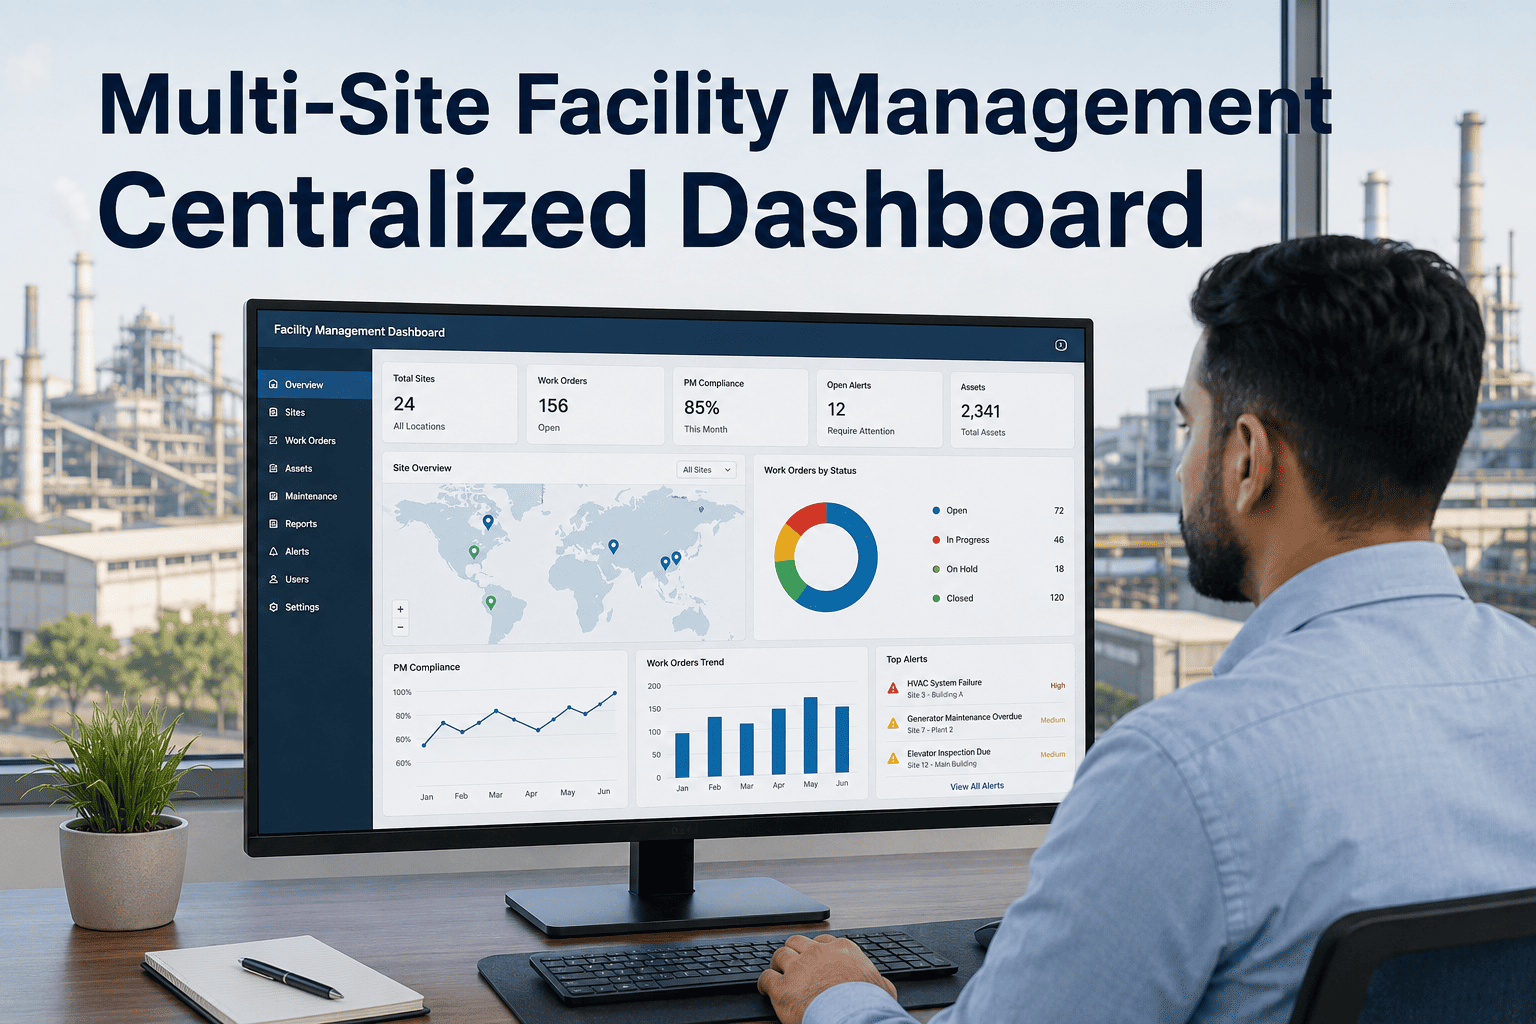
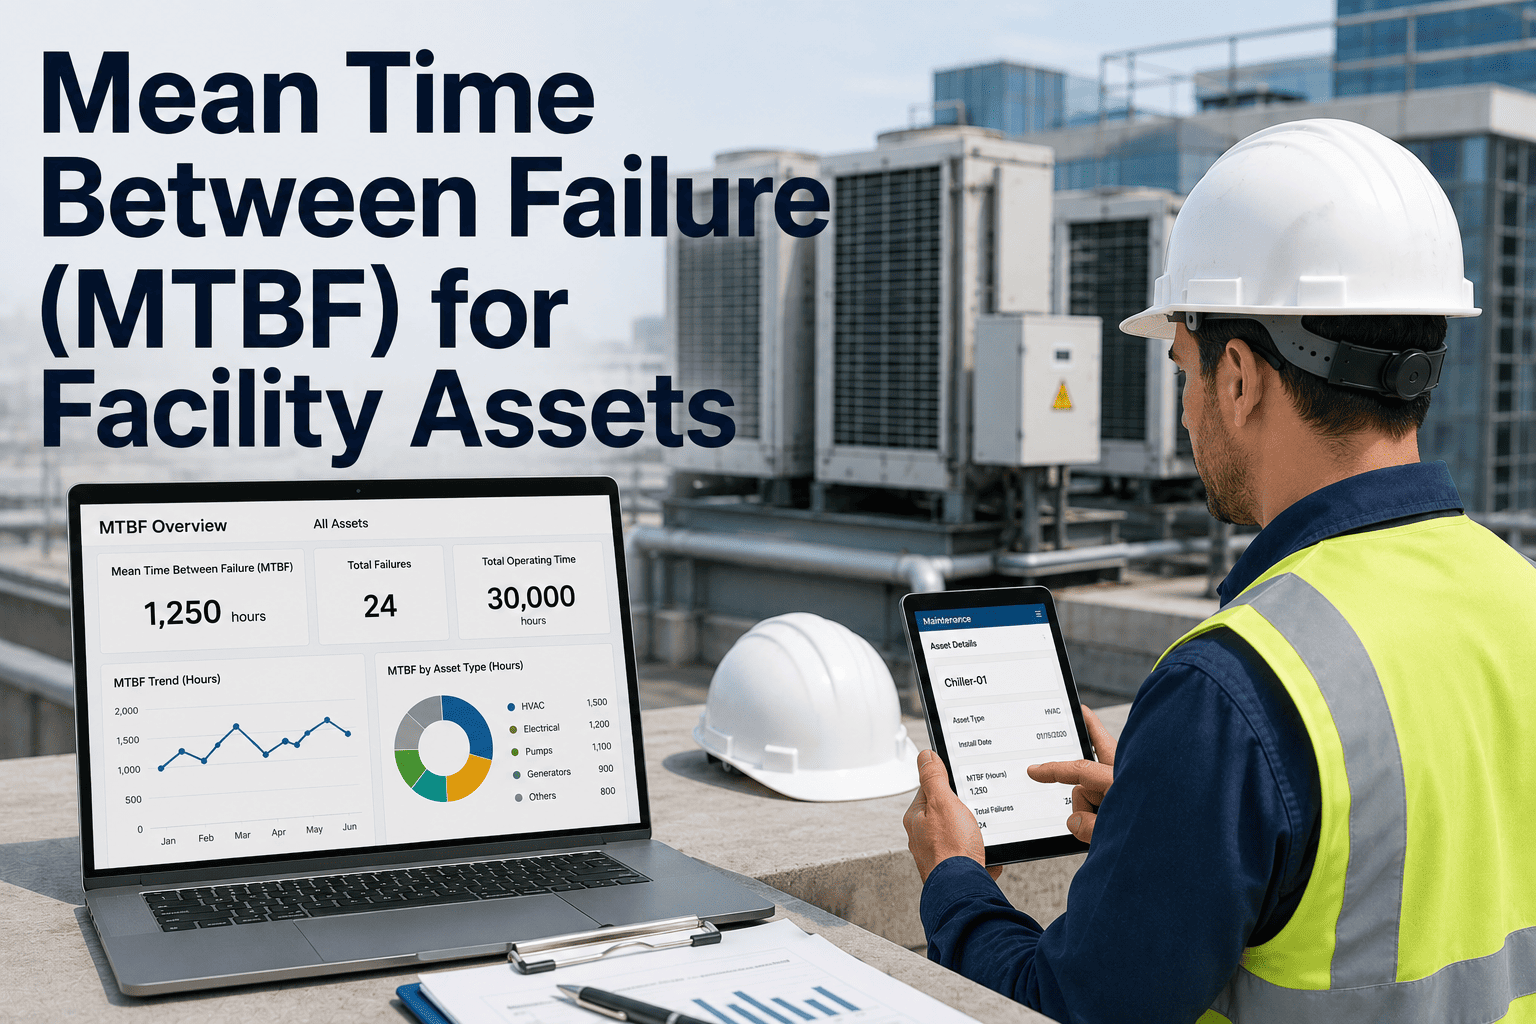
Mean Time Between Failure (MTBF) for Facility Assets
HVAC · Pumps · Elevators · Generators · Electrical Panels · Predictive Maintenance · Reliability Benchmarks
MTBF Formula
MTBF = Total Uptime ÷ Number of Failures
Total uptime8,400 hrs
Failures recorded6
MTBF1,400 hrs
Higher MTBF = more reliable asset. Track it over time to detect early degradation.
3–5x
higher repair cost for reactive vs preventive maintenance — MTBF tells you where to act first
68%
of facility asset failures are detectable in advance through MTBF trend analysis
$0
cost of a failure prevented — vs. average $18K–$80K per unplanned critical asset failure
MTBF Benchmarks — Critical Facility Asset Classes
| Asset Type | Industry MTBF Benchmark | Alert Threshold | Primary Failure Driver | PM Action |
|---|---|---|---|---|
| Centrifugal Chiller | 12,000 – 18,000 hrs | Below 10,000 hrs | Condenser fouling, refrigerant leak | Quarterly condenser clean + refrigerant log |
| Air Handling Unit (AHU) | 8,000 – 14,000 hrs | Below 6,000 hrs | Filter loading, belt wear, bearing failure | Monthly filter + quarterly full service |
| Centrifugal Pump | 15,000 – 25,000 hrs | Below 12,000 hrs | Cavitation, seal wear, impeller erosion | Vibration analysis + annual seal inspection |
| Standby Generator | 10,000 – 20,000 hrs | Below 8,000 hrs | Fuel degradation, cooling system failure | Monthly load test + annual full service |
| Passenger Elevator | 6,000 – 10,000 hrs | Below 5,000 hrs | Door mechanism wear, rope elongation | Monthly inspection per local code |
| Electrical Distribution Panel | 20,000 – 50,000 hrs | Below 15,000 hrs | Connection degradation, thermal stress | Annual thermographic inspection |
| Cooling Tower | 10,000 – 16,000 hrs | Below 8,000 hrs | Fill fouling, drift eliminator damage | Weekly water treatment + annual basin clean |
How MTBF Drives 4 Maintenance Decisions
01
PM Interval Optimisation
If your pump MTBF is 18,000 hours but you service it every 2,000 hours, you are over-maintaining it. If your AHU MTBF drops to 4,000 hours, your quarterly filter PM is too infrequent. MTBF data sets the evidence-based interval — not the vendor's recommended schedule.
02
Capital Replacement Planning
An asset whose MTBF has declined 40% over two years is approaching end of economic life. That trend, tracked in your CMMS, gives the FM director 12–18 months to build a replacement business case before an emergency purchase forces a bad decision at the worst time.
03
Vendor and Contractor Evaluation
If an asset's MTBF improves consistently after a specific contractor performs the annual service, that data supports contract renewal. If MTBF degrades after a vendor change, you have the evidence to require a return to the previous standard before the next contract period.
04
Insurance and Risk Reporting
Insurers increasingly require documented asset reliability data for commercial property and business interruption policies. MTBF reports exported from OxMaint give risk managers and brokers the asset health evidence needed to negotiate premiums and justify coverage terms.
OxMaint Calculates MTBF Automatically — For Every Asset You Track
No manual spreadsheet formulas. No data consolidation. Just real-time MTBF trending per asset, per site, per asset category — visible on your analytics dashboard from day one.
MTBF vs MTTR — Understanding Both Metrics Together
MTBF — Mean Time Between Failure
How often does it break?
Total Uptime ÷ Number of Failures
Measures asset reliability over time
Higher number = more reliable
Drives PM interval decisions
Signals when to replace vs repair
Target: above your asset class benchmark
MTTR — Mean Time To Repair
How fast do you fix it?
Total Repair Time ÷ Number of Repairs
Measures maintenance team responsiveness
Lower number = faster recovery
Drives staffing and inventory decisions
Exposes parts availability gaps
Target: below your SLA threshold per asset tier
"
Most facility teams are sitting on the data they need to predict their next three equipment failures — they just do not have a system that surfaces it. When I work with FM directors on reliability programmes, the first step is always the same: pull your work order history, calculate MTBF by asset class, and compare it against the manufacturer benchmarks. Within two hours, you will see two or three assets whose MTBF has dropped 30% in the last 18 months. Those are your next failures. The facility teams that have deployed OxMaint to automate this analysis are not smarter than the teams still doing it in spreadsheets — they just see the pattern weeks earlier, when there is still time to act. That is the entire value proposition of MTBF tracking in a modern CMMS: turning historical failure data into a forward-looking decision tool.
Thomas Ferreira, PE, CMRP
Principal Reliability Engineer · 24 Years Industrial and Commercial FM · Licensed Professional Engineer · Certified Maintenance and Reliability Professional (SMRP) · Specialist in asset reliability programmes, CMMS analytics deployment, and predictive maintenance strategy for multi-site facility portfolios
Frequently Asked Questions
How does OxMaint calculate MTBF automatically — do we need to enter data manually?
OxMaint calculates MTBF continuously from the work order history it records during normal operations. Every time a technician closes a corrective maintenance work order, the system logs the failure event against that specific asset. Uptime is calculated from the gap between failure events. The MTBF figure updates in real time on the asset record and on the analytics dashboard — no manual calculation, no spreadsheet formula, and no separate data entry required. Start a free trial and your MTBF data begins building from the first work order closed. For assets with existing maintenance history, OxMaint's data import tool accepts historical work order records from spreadsheets or legacy CMMS systems, allowing the analytics engine to calculate MTBF from day one of deployment rather than waiting months to accumulate new data.
What is a healthy MTBF for HVAC and mechanical systems in a commercial facility?
Industry benchmarks vary by asset type and operating environment, but as reference points: centrifugal chillers should maintain MTBF above 12,000 hours, air handling units above 8,000 hours, and centrifugal pumps above 15,000 hours under standard commercial facility conditions. Assets in higher-demand environments — 24/7 operations, extreme climates, or high-usage public buildings — will naturally see lower MTBF and should be benchmarked against sector-specific data rather than general commercial averages. Book a demo to see how OxMaint benchmarks your assets against comparable facilities. The more important number than the absolute MTBF figure is the trend — an asset whose MTBF is declining quarter over quarter requires investigation regardless of whether it is above or below the benchmark, because the trajectory predicts the next failure more reliably than any single snapshot.
Can MTBF data from OxMaint be used to support capital replacement business cases?
Yes, and this is one of the most high-value use cases for MTBF analytics in facilities management. OxMaint generates asset reliability reports that show MTBF trend over time, total cost of failure events per asset, and comparison against new asset benchmark performance — packaged as a PDF export that FM directors can attach directly to capital expenditure requests. The report provides the quantitative evidence that finance teams and executive stakeholders require to approve replacement budget. Explore OxMaint's capital planning reports with a free trial. Facilities that use OxMaint MTBF data in capital planning processes typically see approval rates for replacement requests increase significantly, because the request is grounded in objective failure history rather than the FM director's subjective assessment that a piece of equipment is "getting old."
OxMaint · Asset Reliability Analytics
Know Which Asset Fails Next — Before It Happens.
OxMaint tracks MTBF for every facility asset automatically. See your reliability trends, set alert thresholds, and act on data — not on surprises.