The deferred maintenance backlog across US commercial and government facilities now exceeds $1 trillion — and most of the organisations contributing to that number do not have an accurate, up-to-date picture of their own exposure. The Facility Condition Index (FCI) is the industry-standard formula that converts deferred maintenance costs into a single comparable percentage, making it possible to rank buildings against each other, justify capital requests to finance committees, and track whether a portfolio is improving or deteriorating year over year. First published in 1991 by NACUBO and now adopted by APPA, federal agencies, healthcare systems, and commercial property groups worldwide, FCI is the one number every facilities leader needs to defend a capital budget. Yet most FM teams still calculate it once every three to five years from a static spreadsheet, then watch it go stale before the capital plan is even approved. OxMaint’s analytics and reporting platform turns FCI from a point-in-time snapshot into a living, continuously updated asset health score — recalculated every time a work order closes, a deficiency is logged, or a component replacement is recorded in your CMMS.
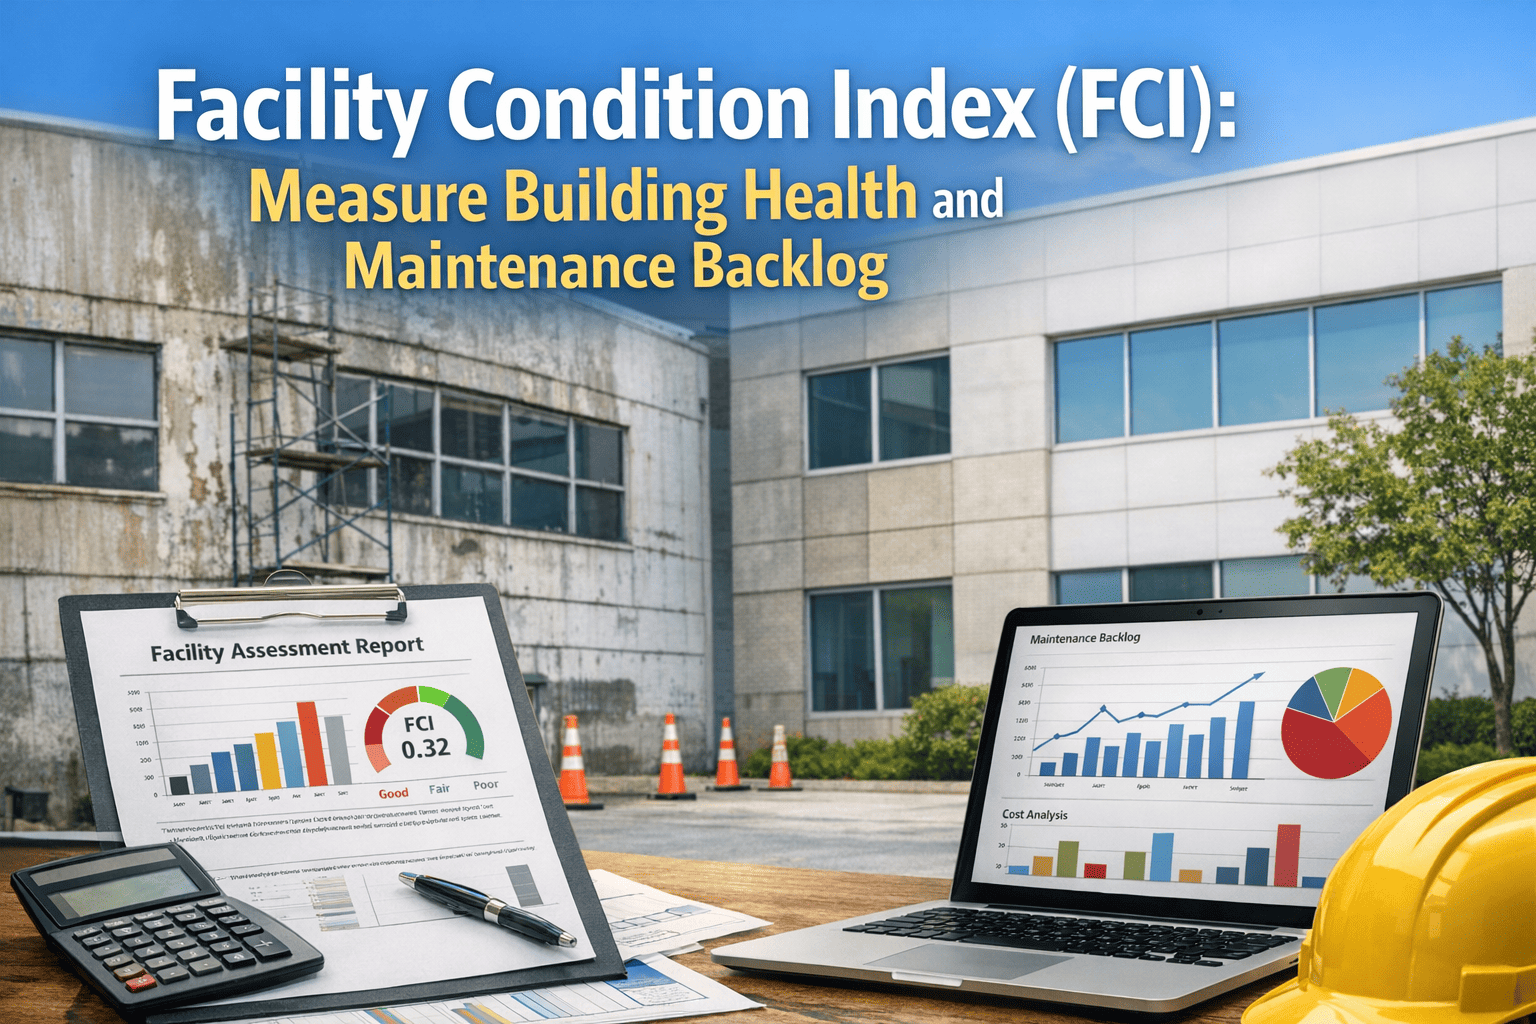
Facility Condition Index (FCI): Measure Building Health and Maintenance Backlog
01 — The FCI Formula: Simple Calculation, Powerful Implication
The FCI formula is deceptively simple. It divides the total cost of deferred maintenance deficiencies by the Current Replacement Value (CRV) of the facility. The lower the result, the better the condition. An FCI of 0% means no backlog. An FCI of 60% means the cost of all identified deficiencies equals 60% of what it would cost to replace the building entirely — at which point economic analysis typically favours replacement over continued investment in repair.
The Two Variables That Drive Accuracy
The total estimated cost to remedy all identified deficiencies — structural, mechanical, electrical, plumbing, envelope, and life safety. This number must come from a documented Facility Condition Assessment (FCA), not from a work order backlog alone. Work orders capture reported issues; a proper FCA adds proactive assessment of ageing components that have not yet failed but are past their expected service life.
The cost to replace the facility in-kind at today’s construction prices. RS Means construction cost data is the most widely used CRV benchmark. CRV must be updated annually for inflation — at 5–7% per year in 2024–2026, a CRV figure from three years ago understates the replacement cost by 15–21%, causing FCI to overstate the severity of the backlog.
02 — FCI Scoring Bands: What the Number Means and What Action It Requires
The original NACUBO/APPA thresholds remain the most widely cited industry benchmarks. Many organisations customise thresholds based on building type, mission criticality, and portfolio strategy — hospitals, data centres, and emergency services facilities commonly target FCI under 5% and treat 10%+ as poor regardless of standard benchmarks. OxMaint allows per-building threshold configuration so mission-critical assets have tighter action triggers than general-use facilities.
03 — System-Level FCI: Where the Budget Needs to Go
A portfolio-level FCI score tells you which buildings to prioritise. A system-level FCI breakdown tells you what to fix within each building. Every building system should carry its own FCI calculated separately — HVAC, roofing, electrical, plumbing, envelope, and life safety — so capital planning can target the highest-impact systems rather than spreading investment across general improvements.
A building with an overall FCI of 14% Fair condition might have an HVAC FCI of 32% Poor while its structural FCI is 3% Excellent. The capital allocation decision is fundamentally different depending on which system is driving the number, and a blended score conceals this information entirely.
| Building System | Typical Useful Life | Key Deficiency Types | FCI Impact Driver | OxMaint Tracking |
|---|---|---|---|---|
| HVAC Systems | 15–25 years | Equipment past service life, failed components, controls obsolescence, refrigerant compliance | Highest single-system driver in most commercial buildings — 25–35% of total building CRV | PM records, age tracking, deficiency work orders |
| Roofing and Envelope | 20–30 years | Membrane failure, flashing deterioration, cladding delamination, window seal failure | Envelope failures cascade into interior damage — FCI impact multiplies when deferred | Annual inspection records, moisture survey results |
| Electrical Systems | 25–40 years | Panel capacity shortfalls, aged switchgear, conduit deterioration, code compliance gaps | Often underweighted until a code inspection forces remediation — sudden large FCI jump | Inspection findings, compliance work orders, component age |
| Plumbing Systems | 20–50 years (varies by material) | Pipe material past life expectancy, backflow failure, fixture obsolescence, water heater age | Concealed deterioration; FCI impact surfaces suddenly at failure | PM checklist results, backflow test records, age data |
| Life Safety Systems | 10–20 years | Sprinkler system age, fire alarm panel obsolescence, egress lighting failure, suppression compliance | Non-negotiable: life safety FCI impacts occupancy permit status regardless of overall FCI | Inspection compliance calendar, test records, deficiency tracking |
| Structural Systems | 40–75 years+ | Foundation movement, structural crack progression, seismic compliance, floor system fatigue | Low-frequency but high-cost; structural FCI impacts usually require specialist assessment | Inspection records, deficiency reports, specialist findings |
FCI Is Only Useful When It Is Current. OxMaint Keeps It Current Automatically.
Every work order closed in OxMaint updates the deferred maintenance record for that asset. Every PM completed reduces the backlog. Every condition score logged from an inspection recalculates the system-level FCI — so your capital planning is always built on this week’s data, not last year’s assessment.
04 — Facility Condition Assessment: How to Build the Data Behind the FCI
An FCI is only as accurate as the data feeding it. A Facility Condition Assessment (FCA) is the structured process of identifying, documenting, and costing every deficiency in a building — the systematic survey that populates the numerator of the FCI formula. Without a rigorous FCA, the FCI reflects only reported failures, missing the silent deterioration of components past their service life that has not yet produced a symptom.
Document every major building system component: make, model, installation date, expected service life, and current condition rating. The gap between current age and expected service life is the primary driver of proactive deficiency identification — a chiller at year 22 of a 20-year service life carries a deferred replacement cost whether or not it has failed yet.
Each identified deficiency receives a cost estimate using RS Means or equivalent regional construction cost data. Deficiencies are categorised by system, severity (immediate, near-term, planned), and compliance impact (life safety, regulatory, operational). The total across all deficiencies is the deferred maintenance cost used in the FCI formula.
CRV is calculated from regional construction cost benchmarks applied to the building’s gross square footage, occupancy type, and construction class. RS Means is the most widely used source. CRV must be updated annually at 5–7% for inflation — a three-year-old CRV figure overstates FCI severity by 15–21% and produces capital allocation errors.
With both inputs verified, the FCI is calculated per system and for the building overall. System-level FCIs are reviewed against the overall score to identify which systems are driving the number. Outlier systems — those with FCI more than 10 percentage points above the building average — are flagged as primary capital targets regardless of their contribution to the overall score.
A point-in-time FCA goes stale immediately. Connecting FCA data to a CMMS allows the deferred maintenance backlog to update as work orders are completed, new deficiencies are logged during PM inspections, and component replacements are recorded. OxMaint recalculates FCI dynamically from these inputs, so the score reflects current reality rather than a past assessment date.
05 — Capital Planning with FCI: From Score to Investment Decision
FCI’s most powerful application is portfolio-level capital prioritisation. When every building in a portfolio has a current FCI, finance committees can make objective allocation decisions based on condition data rather than the loudest voice in the room. Buildings with the highest FCI scores have the largest backlog relative to value and therefore the greatest risk of accelerating deterioration if capital is deferred further.
Organisations that use FCI as a dynamic portfolio management tool — updating it continuously rather than as an annual compliance exercise — make capital allocation decisions 40% faster and achieve CapEx budget variance under 15%. Those that treat it as a periodic snapshot continue to experience budget surprises and credibility gaps when presenting capital requests.
06 — CMMS Analytics: Turning Work Order Data into a Living FCI
The traditional FCI workflow is a three-to-five year cycle: commission a consultant-led FCA, calculate the FCI, build a capital plan, wait for budget approval, execute some projects, and then repeat the assessment cycle before the next plan. By the time the capital plan is approved, the FCI that justified it is already 12–18 months out of date. OxMaint breaks this cycle by connecting every maintenance activity to the FCI calculation in real time.
How often should FCI be recalculated?
Best practice is continuous recalculation as conditions change — which is only achievable when FCI is connected to a live CMMS rather than a periodic assessment process. At minimum, FCI should be recalculated annually for each building, with CRV updated for inflation at the same time. For buildings in the Fair or Poor range (FCI above 10%), quarterly recalculation is warranted because the backlog is growing rapidly enough to change capital priorities between annual reviews. For mission-critical facilities, monthly recalculation should be standard. OxMaint recalculates FCI automatically from every closed work order and PM completion — start your free trial to connect your maintenance data to a live FCI dashboard.
What is the difference between FCI and deferred maintenance backlog?
Deferred maintenance backlog is an absolute dollar figure — the total cost of all identified deficiencies. FCI is a normalised ratio that expresses that backlog as a percentage of replacement value. The backlog figure alone cannot be compared across buildings of different sizes and values; FCI makes the comparison possible. A $2M backlog on a $5M building is an FCI of 40% Poor. The same $2M backlog on a $50M building is an FCI of 4% Excellent. Portfolio capital prioritisation decisions must use FCI, not raw backlog figures, to be meaningful. Both numbers are tracked in OxMaint’s analytics dashboard: the absolute backlog in dollars, and the normalised FCI ratio per building and per system.
What FCI threshold should trigger a replace vs. repair analysis?
The standard industry trigger is 60% overall building FCI, where the deferred maintenance cost approaches or exceeds 60% of replacement value. At that point, economic analysis using Net Present Value of continued maintenance versus a replacement event typically favours replacement. However, the trigger should be applied at the system level, not just the building level. An HVAC system with FCI above 40% — where replacement costs represent 40% of the system’s current value — warrants a component-level replace-vs.-repair analysis even if the overall building FCI is in the Fair range. OxMaint’s lifecycle analytics module generates replace-vs.-repair recommendations per major component based on age, repair frequency, and remaining useful life estimates. Book a demo to see the lifecycle analytics dashboard for your building portfolio.
How does preventive maintenance affect FCI over time?
Preventive maintenance slows the rate of FCI growth by reducing the frequency and severity of deficiencies that accumulate in the numerator. A well-maintained building with 95%+ PM compliance will see FCI drift of approximately 1–2% per year as components age toward end of life. A reactive building with 60% PM compliance may see FCI drift of 4–8% per year as deferred maintenance compounds — and deferred items cost 4.8 times more to address as emergency repairs than as planned work. OxMaint tracks PM compliance rate alongside FCI, allowing facilities managers to demonstrate the direct relationship between maintenance investment and FCI trajectory when presenting capital plans to finance committees.
Can OxMaint calculate FCI without a prior facility condition assessment?
Yes, with an important caveat. OxMaint can begin calculating a working FCI immediately from existing data: the deferred maintenance backlog visible in open corrective work orders, the component age data in your asset register, and PM inspection findings that have identified deficiencies. This operational FCI will be more accurate than no FCI, but it will undercount deficiencies for components that have not yet failed and have not been formally assessed. The recommended approach is to use OxMaint’s operational FCI as the baseline while scheduling a formal FCA to identify the silent deficiencies not yet in the work order system. Once the FCA data is loaded, the FCI reflects both reported and assessed deficiencies — and OxMaint keeps it current from that baseline forward.