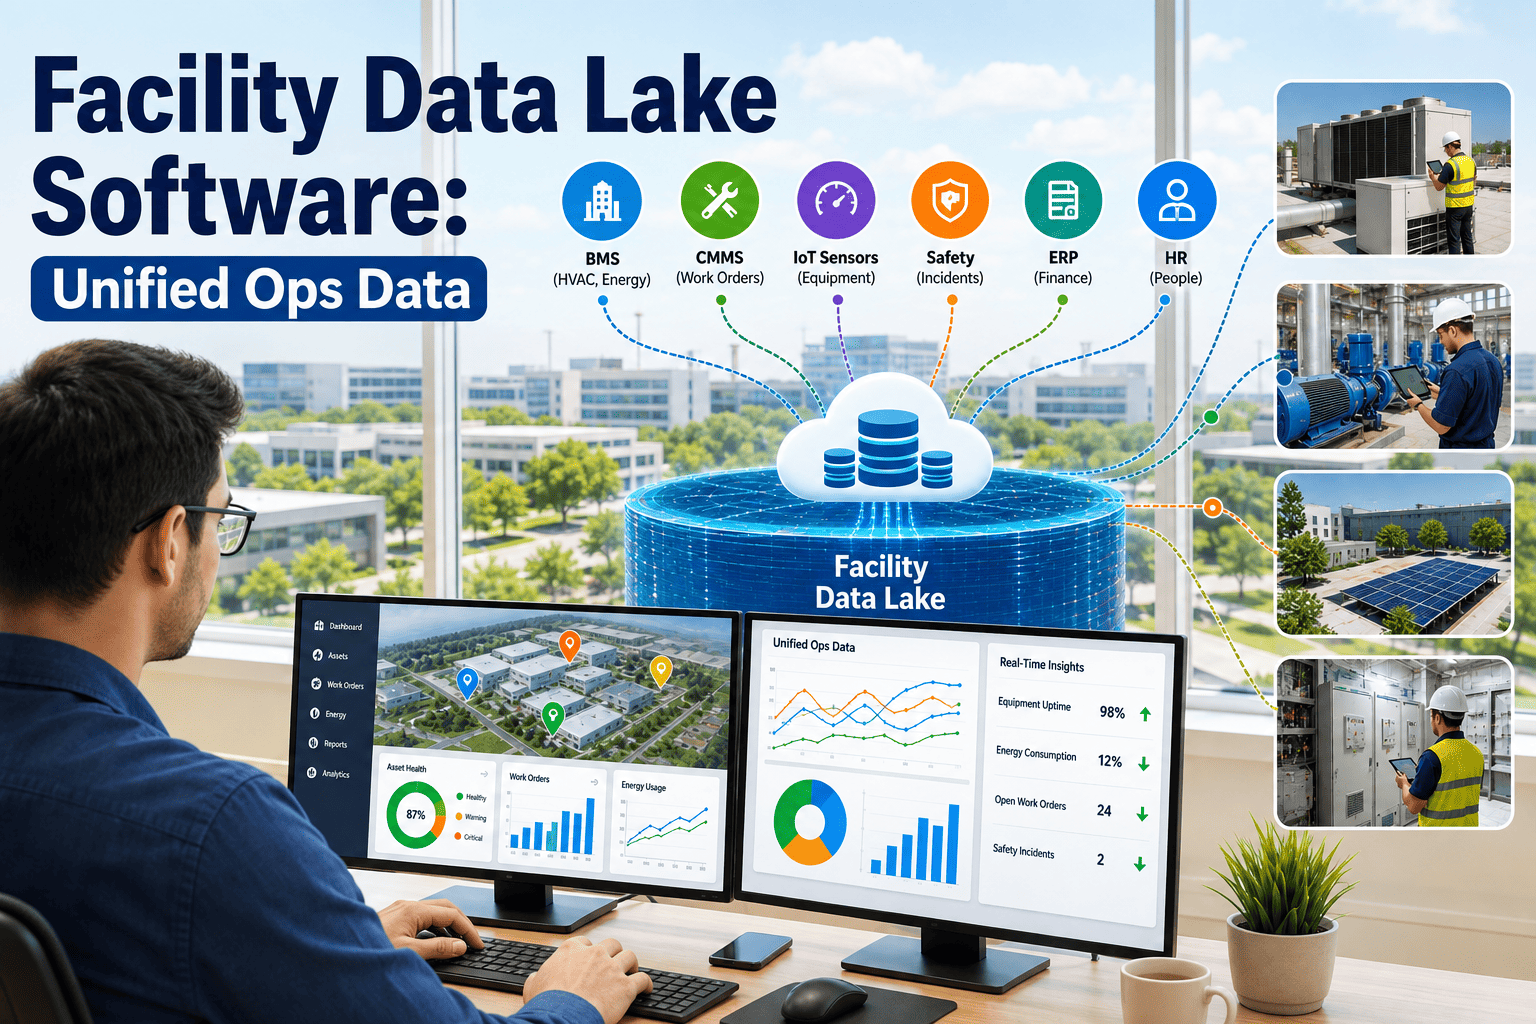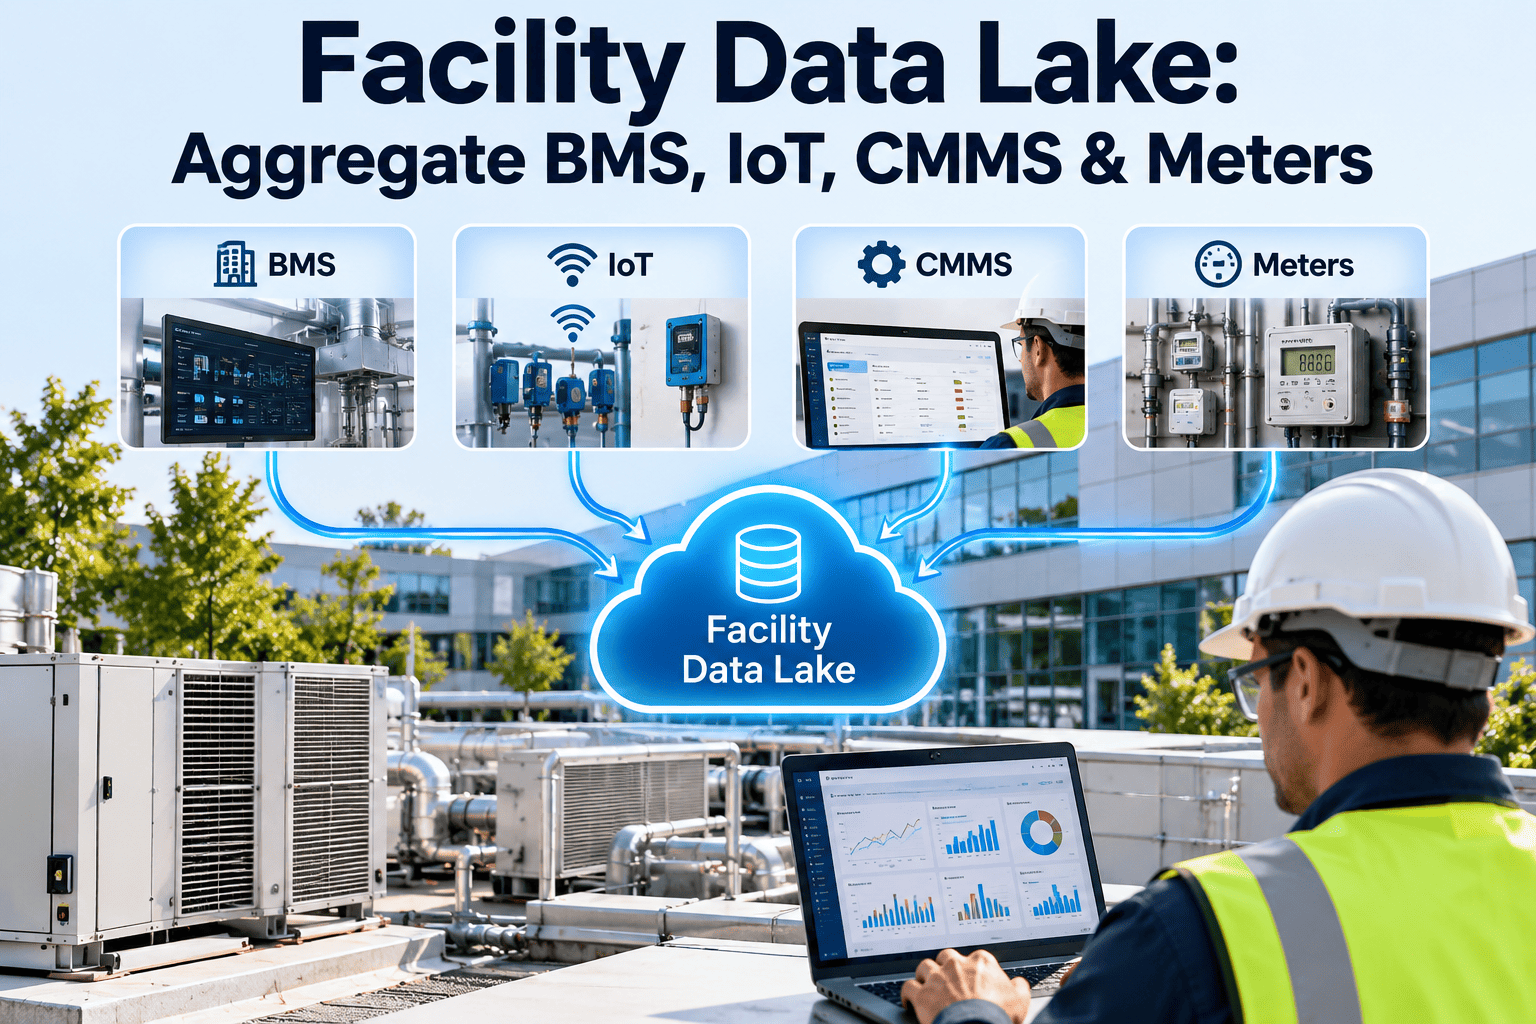
Most commercial buildings already collect plenty of data. The BMS logs temperatures and setpoints, IoT sensors report vibration and occupancy, meters record kilowatt-hours, and the CMMS holds every repair. The trouble is that each system keeps its own copy of the truth, in its own format, behind its own login. A facility data lake brings those signals together so one question can draw on all of them. This guide explains the architecture, the data model and the pitfalls, and shows where Oxmaint maintenance management software fits as both a data source and the place findings become work.
Facility Data Lake: Aggregate BMS, IoT, CMMS and Meter Data in One Place
Siloed systems answer narrow questions. A shared data layer answers the expensive ones, like why a chiller keeps tripping after hours or which assets drive the energy bill.
The Problem With Siloed Facility Data
Each question sits between two systems. Without a shared layer, someone exports spreadsheets and joins them by hand, once.
Reference Architecture in Five Layers
Cloud providers publish building data lake reference architectures, including AWS. They share the same layered idea, shown here in vendor-neutral terms.
What Each Source Contributes
| Source | Typical data | Rate | Main challenge |
|---|---|---|---|
| BMS | Temperatures, valve and damper positions, setpoints, alarms | Seconds to minutes | Inconsistent point names across vendors |
| IoT sensors | Vibration, humidity, occupancy, leak detection | Seconds to hours | Battery life, gaps and calibration |
| Meters | Electricity, gas, water, demand | Minutes to monthly | Mixed intervals and missing intervals |
| CMMS | Assets, work orders, labor, parts, inspections | Event based | Free text and uneven coding |
| Context | Weather, occupancy schedules, tenant requests | Hourly or daily | Joining to the right zone and asset |
Start With the Record Every Other Source Needs
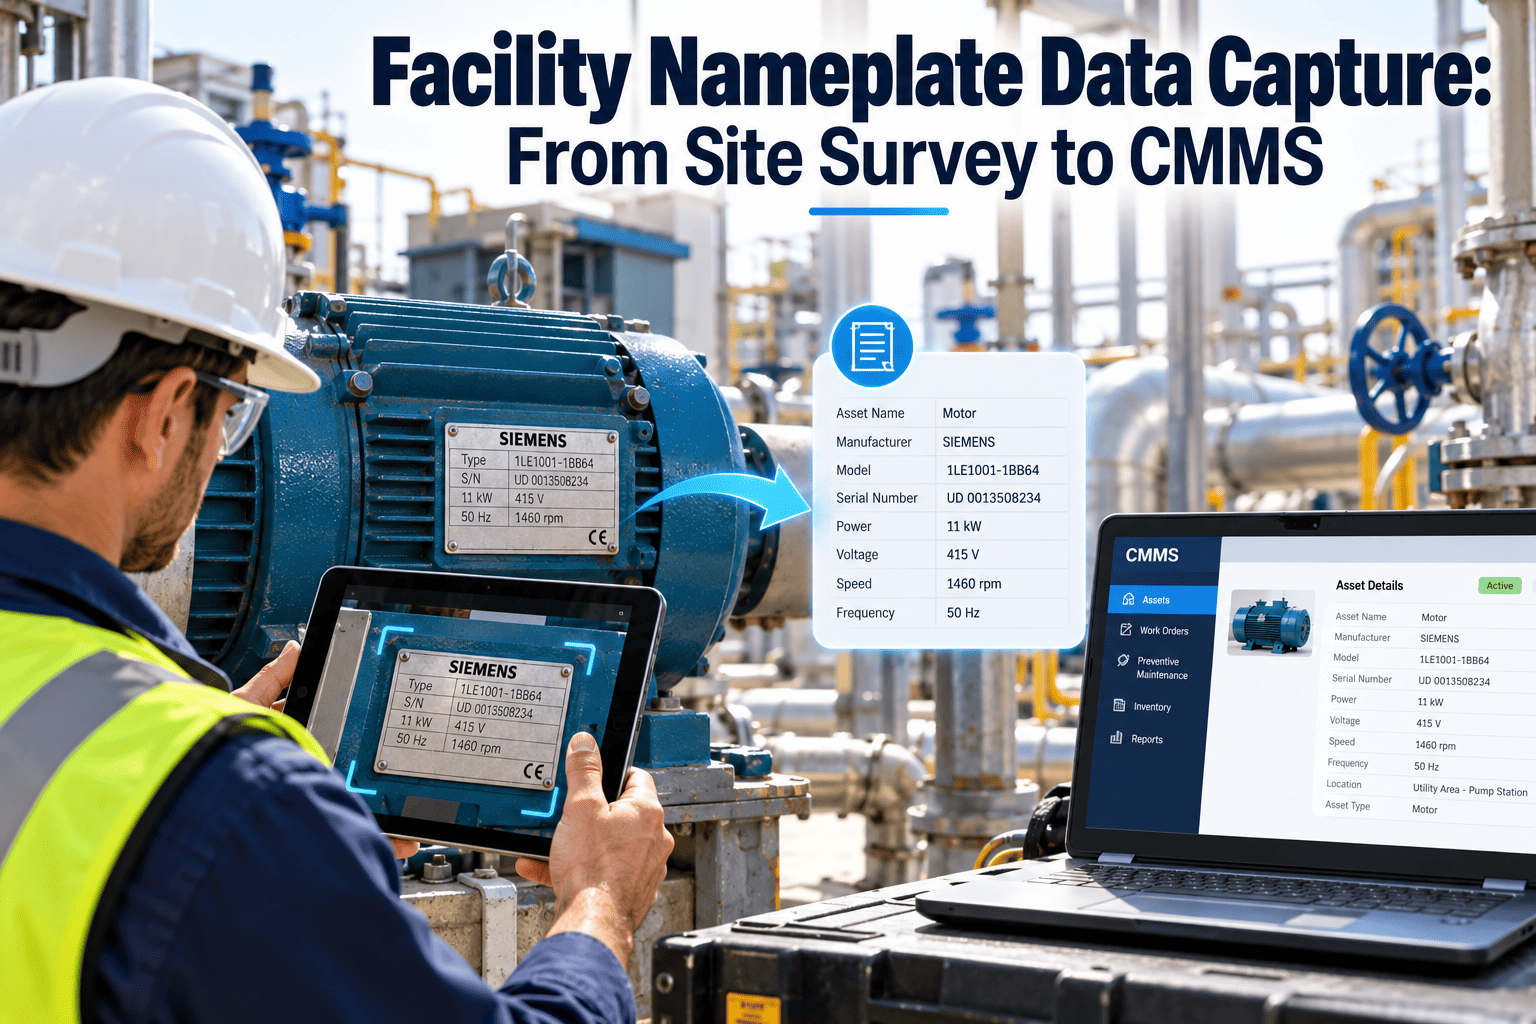
A clean asset register is the backbone of any facility data model. Build it once in Oxmaint and let every signal attach to it.
The Join Key Problem
The hardest part of a facility data lake is not storage. It is knowing that a BMS point, a meter and a CMMS asset all describe the same equipment.
- Use one asset ID everywhere and store the mapping as data, not as tribal knowledge.
- Adopt a point naming convention or an open tagging model so equipment relationships are explicit.
- Record location, system served and parent asset so analytics can roll up by floor, tenant or system.
Questions a Data Lake Can Finally Answer
Data Lake or Data Warehouse?
- Stores raw data of any shape
- Good for time series and unplanned questions
- Needs a catalog to avoid becoming a swamp
- Stores modeled, structured tables
- Good for fixed reports and finance
- Needs schema work before data arrives
Most facility teams end up with both: raw signals land in the lake, and curated tables feed reports.
Governance and Data Quality
- Assign an owner to every source, so broken feeds have someone to call.
- Track completeness, freshness and out-of-range values for each point.
- Keep raw data immutable and log every transformation.
- Control access by site and role, and separate tenant data where contracts require it.
- Secure the operational technology boundary. Pulling BMS data out should not open a path back in.
A Phased Path That Avoids the Big-Bang Trap
Where Oxmaint Fits
The CMMS is both a source and a destination. It supplies asset, work order and cost history, and it receives the findings that analytics produce.
- Asset management with hierarchy and location, which gives the lake its join keys.
- Work orders and preventive maintenance records as event data for failure analysis.
- Inspections and mobile checklists that capture readings sensors cannot.
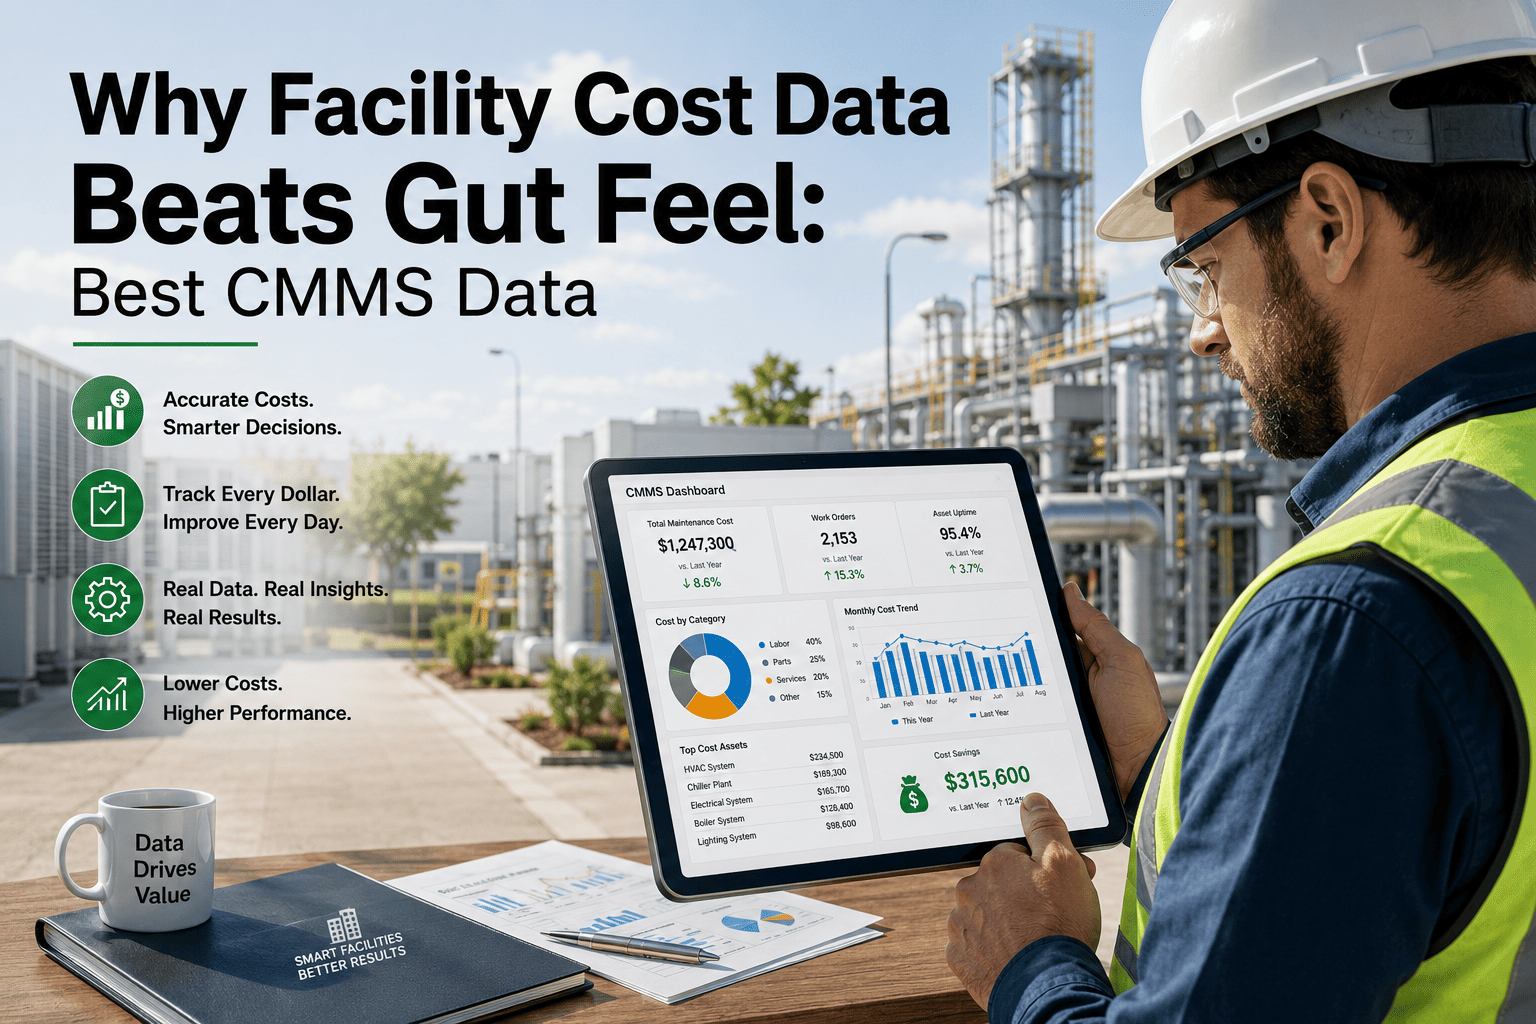
- Inventory and cost data to price each fault.
- Dashboards and reports that put maintenance and condition side by side.
Ingestion: Streaming, Batch or Both
Not every signal needs to arrive in real time. Match the ingestion pattern to how quickly the data is used.
| Pattern | Best for | Design note |
|---|---|---|
| Streaming | Alarms, fast sensors and safety events | Buffer at the gateway so outages do not lose data |
| Scheduled batch | BMS trend logs and interval meter data | Pull on a fixed cycle and track the last successful read |
| API sync | CMMS assets, work orders and inspections | Sync changes, not full copies, and keep record IDs stable |
| File upload | Utility bills and commissioning reports | Validate the format before it lands in storage |
- Store timestamps in a single time standard and keep the original local time as a separate field.
- Make loads repeatable, so reprocessing a day never creates duplicate rows.
- Version every schema, because controllers and point lists change over time.
Storage Tiers and Retention
Time series data grows quickly. Tiering keeps recent detail fast to query and older history cheap to keep.
Cleaning BMS Data Before Anyone Trusts It
Analytics built on bad data produces confident wrong answers. Expect these problems and plan for them.
Typical problems
- Flatlined sensors that keep reporting the last value.
- Daylight saving and time zone errors that shift data by an hour.
- Mixed units, such as Fahrenheit in one controller and Celsius in another.
- Duplicate or orphaned points left behind after retrofits.
- Gaps from network outages and controller restarts.
Practical fixes
- Flag suspect values instead of silently deleting them.
- Apply range and rate-of-change checks at ingestion.
- Keep a mapping table for units and point names under version control.
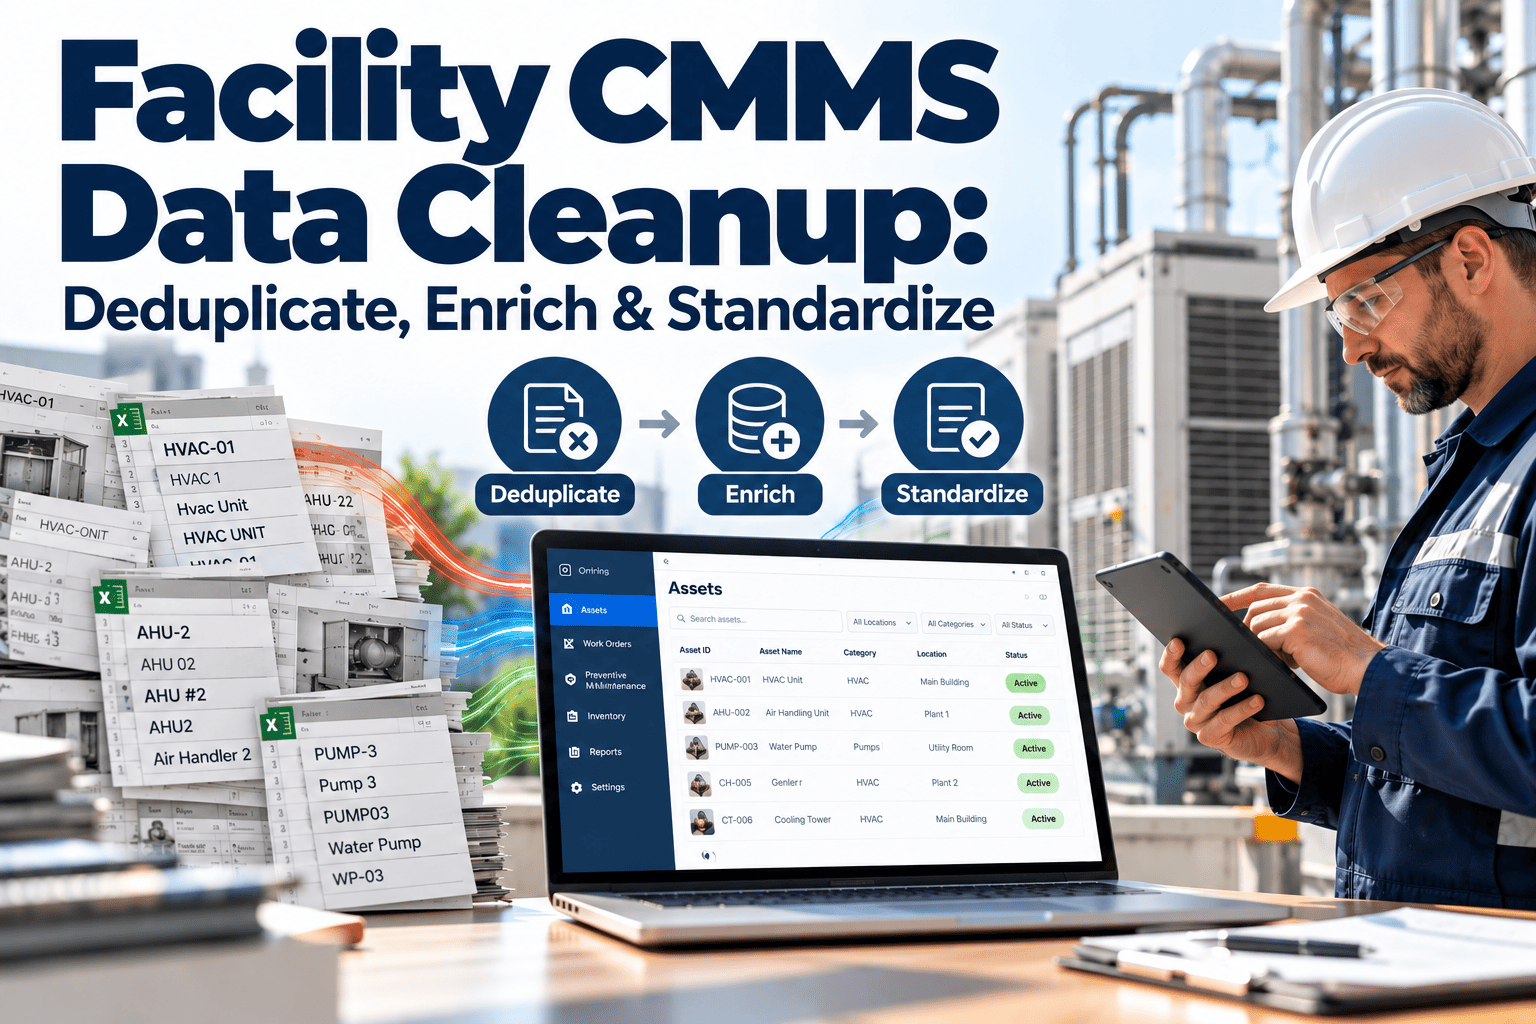
- Send repeat sensor faults to the CMMS as corrective work.
Worked Example: A Chiller Plant
A chiller plant shows how the pieces fit together, because it involves controls, power metering, sensors and heavy maintenance.
Security and the Operational Technology Boundary
Building controls were not designed for the open internet. Treat data extraction as a security project too.
- Use read-only connections wherever possible, and keep write access separate and audited.
- Place gateways in a segmented network zone and limit outbound traffic to known destinations.
- Encrypt data in transit and at rest, and rotate credentials on a schedule.
- Apply role-based access by site, tenant and function.
- Log who queried what, especially for tenant-level energy data.
Build, Buy or Blend
- Full control of models and storage
- Needs data engineering skills
- Ongoing maintenance of connectors
- Faster start with prebuilt connectors
- Less flexibility for custom questions
- Check data export and ownership terms
Many teams blend the two, buying connectors and analytics while keeping asset and work order data under their own governance.
Measuring Whether the Lake Pays Off
- Number of faults found that were not visible in any single system.
- Time from detection to closed work order.
- Share of assets with mapped points and current maintenance records.
- Data completeness and freshness across feeds.
- Energy and repair cost changes on assets where findings were acted on.
Mistakes That Turn a Lake Into a Swamp
- Collecting every point before deciding what questions to ask.
- Skipping the asset mapping, which leaves data that cannot be joined.
- Giving no one ownership of data quality.
- Building dashboards that nobody uses to dispatch work.
- Leaving documentation until after the original engineer moves on.
Plan Your Facility Data Architecture With a Specialist
Bring your BMS, meter and sensor list. We will map where each signal connects to assets and work orders.
Data Model Essentials
A simple, consistent hierarchy makes every later question easier. Most facility models need these entities.
| Entity | Example | Why it matters |
|---|---|---|
| Site and building | Main campus, Building B | Enables portfolio comparisons |
| Floor and zone | Level 3, east zone | Links comfort complaints to equipment |
| System | Chilled water, air handling | Groups assets that work together |
| Asset | AHU-03, Pump P-12 | Connects data to repairs and cost |
| Point or meter | Supply air temperature, kWh | The measured signal itself |
| Work order | Replace belt, calibrate sensor | Records what was done and when |
Naming Points So People and Machines Can Read Them
- Use a fixed pattern such as site, equipment, then measurement, and apply it everywhere.
- Avoid abbreviations that only one contractor understands.
- Record the engineering unit and data type with every point.
- Describe what the point measures, such as supply air or return air, in a separate field.
- Consider an open semantic tagging approach so relationships between equipment are queryable.
Analytics Maturity Ladder
Most buildings gain the most from levels one and two. Predictive models need clean history, and that takes time to accumulate.
Tenant and Portfolio Reporting
- Allocate energy and service cost by tenant or department from metered data.
- Compare similar buildings on cost per square foot and repair frequency.
- Show comfort and response metrics that matter to tenants.
- Provide evidence for sustainability and compliance reporting.
Skills and Staffing
A facility data program needs a small mix of skills, not a large team.
- A data engineer or integrator to build and maintain connectors.
- A controls specialist who understands BMS points and sequences.
- A maintenance lead who owns asset records and turns findings into work.
- An executive sponsor who protects time for cleanup and governance.
Trends Shaping Facility Data Platforms
- Open semantic models that describe equipment relationships in a vendor-neutral way.
- Wider use of IoT sensors on assets that the BMS never monitored, such as motors and pumps.
- Cloud storage and query services that make large time series affordable for small teams.
- Growing expectation from owners and regulators for measured, auditable energy performance.
- Machine learning applied to fault detection, with humans still reviewing the findings.
A Short Readiness Checklist
If any answer is no, fix it first. A data lake built on weak asset records will only store confusion at scale.
Frequently Asked Questions
Give Every Facility Signal a Home and a Next Step
Connect assets, history and findings in a maintenance system built for facility teams.