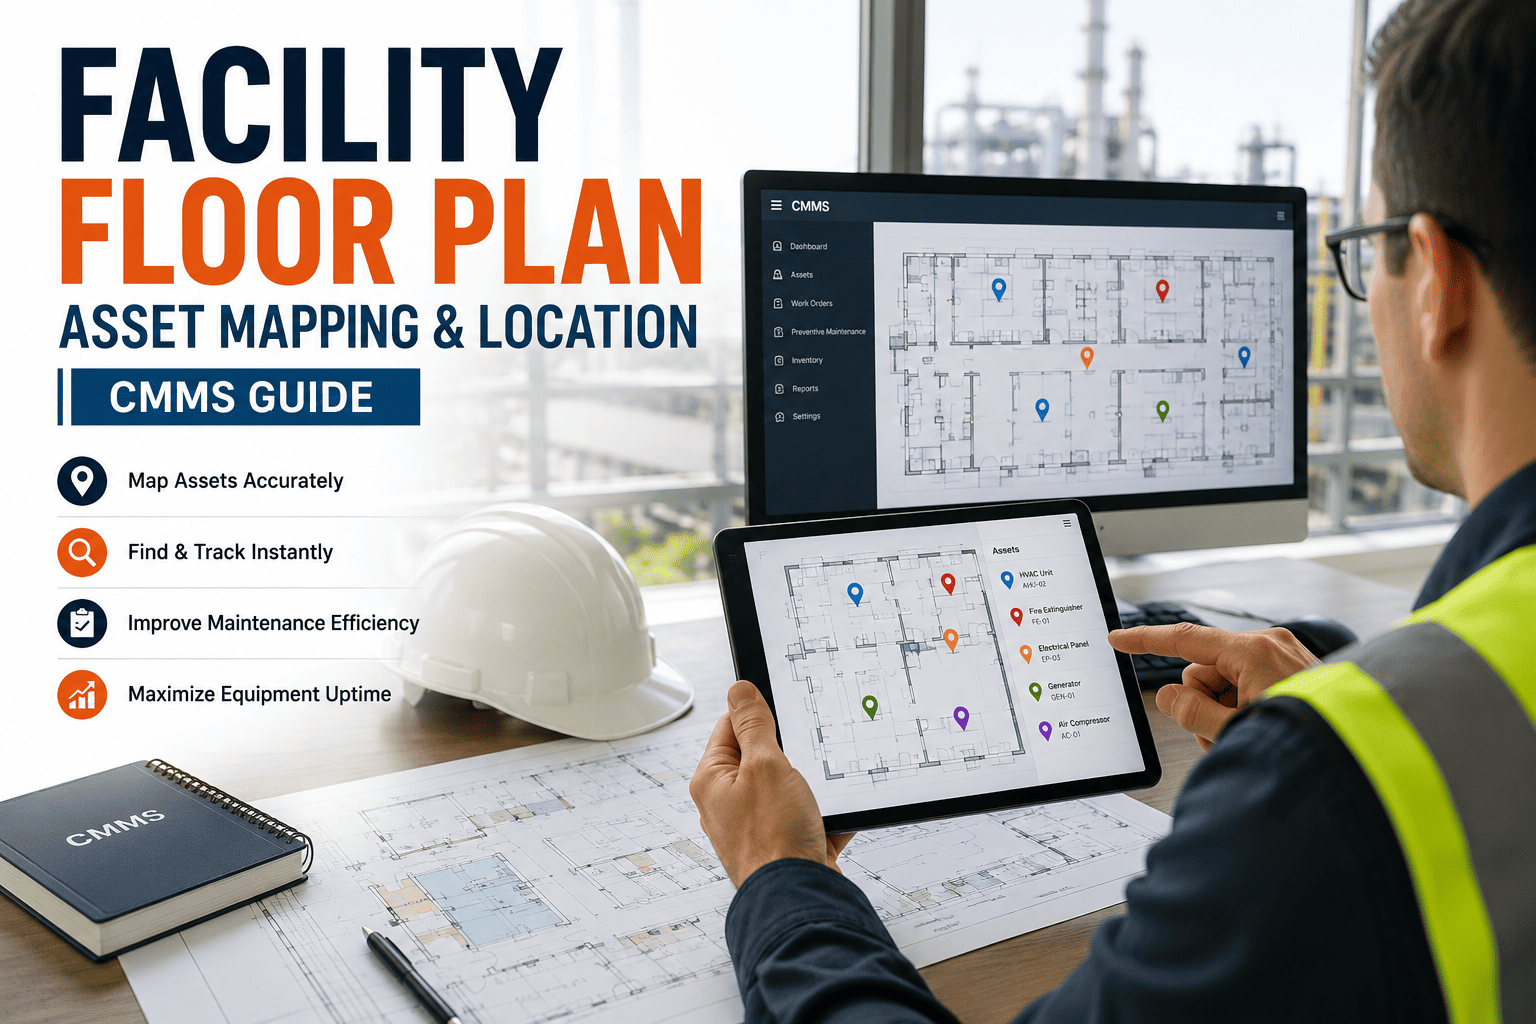
Facility teams lose an average of 6.3 hours per week searching for assets buried in spreadsheets and paper binders — a hidden cost that compounds across every preventive maintenance round, audit, and emergency call-out. Floor plan asset mapping closes that gap by pinning every pump, AHU, and electrical panel to a clickable coordinate on your building's actual blueprint, then syncing that location data back to your CMMS work order in real time. The result is faster technician dispatch, fewer "asset not found" notes, and a defensible audit trail that satisfies ISO 55000 and Joint Commission requirements. This guide breaks down the spatial tracking stack, the payback math, and the rollout plan — and you can Start Free Trial to map your first facility today.
CMMS FLOOR PLAN GUIDE 2026
Can your technicians locate 100% of your assets in under 90 seconds?
Facility floor plan asset mapping ties every piece of equipment to a precise coordinate on your building blueprint — so work orders, history, and inspection rounds launch from the right location every time. Most teams cut dispatch-to-arrival time by 40% within the first quarter of deployment.
THE PROBLEM
Why spreadsheet-only asset tracking is silently draining your maintenance budget
A 2024 survey of 1,200 plant and facility managers found that 67% still rely on Excel or paper binders as their primary asset register — and those teams spend 2.4× more on emergency labor than peers using spatial CMMS tracking.
WORKED EXAMPLE
A 180-asset food processing plant spending $42K/yr on locate time
Consider a mid-sized cold-storage facility with 180 tagged assets across three floors. Technicians averaged 9 minutes per work order just confirming equipment location using a shared spreadsheet and a printed binder — across 3,200 work orders a year, that's 480 labor-hours, or roughly $42,000 in fully-loaded technician time. After importing their CAD floor plans into a CMMS and pinning each asset to a coordinate, locate time dropped to under 60 seconds. The payback: 412 hours recovered annually and a 38% reduction in overtime within two quarters.
HOW IT WORKS
The 5-layer floor plan asset mapping stack
A complete spatial CMMS deployment isn't just a digital blueprint — it's five interconnected layers, each adding a measurable speed or accuracy gain. Skip a layer and the payback shrinks by half.
Floor plan ingestion
Upload CAD (.dwg, .dxf), PDF, or scanned blueprints. The system georeferences the drawing, normalizes scale to ±6 inches, and splits multi-floor files into navigable levels. Most facilities complete ingestion in under 2 hours per building.
Asset coordinate mapping
Each asset record is dropped onto its physical location on the plan. QR codes or NFC tags physically affixed to equipment link back to the same coordinate, so a technician scanning a pump on the floor jumps straight to its work-order history on the map.
CMMS work-order linkage
Every work order, PM trigger, and inspection checklist inherits the asset's spatial data. Dispatchers see a live map of open tickets by location, enabling route-optimized assignment that cuts travel time inside large facilities by 25–35%.
Spatial filtering and zone reporting
Filter assets by room, wing, floor, or system (HVAC, electrical, plumbing) directly from the map. Generate compliance reports scoped to a zone — critical for ISO 55000 audits and Joint Commission environment-of-care rounds.
Field-ready mobile navigation
Technicians open the floor plan on a tablet or phone, tap a work order, and get turn-by-turn routing to the exact asset — including inter-floor paths. Offline mode caches the plan so basement and roof work continues without Wi-Fi.
THE PAYBACK
Quantifying the ROI of floor plan CMMS integration
The financial case for spatial asset tracking rests on three measurable savings buckets: recovered labor hours, reduced emergency spend, and avoided compliance penalties. Use the formula below to model your own facility.
ANNUAL SAVINGS FORMULA
Where WO_count = annual work orders · Locate_min_saved = minutes recovered per WO after mapping · Labor_rate = fully-loaded $/hr · OT_premium = overtime differential · Reduction_% = expected emergency-hour reduction (typically 0.20–0.35)
| Facility profile | Assets mapped | Annual WOs | Locate time before | Locate time after | Year-1 savings | Payback period |
|---|---|---|---|---|---|---|
| Single-site office building | 80 | 1,100 | 7 min | 1 min | $9,400 | 3.1 months |
| Multi-floor hospital wing | 320 | 4,800 | 11 min | 2 min | $41,200 | 2.4 months |
| Food processing plant (3 buildings) | 180 | 3,200 | 9 min | 1 min | $38,600 | 2.0 months |
| University campus (12 buildings) | 1,400 | 18,500 | 14 min | 2 min | $214,000 | 1.6 months |
| Logistics warehouse | 240 | 2,600 | 8 min | 1 min | $22,100 | 2.8 months |
Savings figures based on a $55/hr fully-loaded technician rate and a 25% overtime premium. Actual results vary with facility complexity and data quality at ingestion.
BEFORE vs AFTER
What changes the day your floor plan goes live in the CMMS
The shift from spreadsheet tracking to spatial CMMS isn't incremental — it changes how dispatchers, technicians, and auditors interact with asset data on day one.
- Dispatcher reads a room number from Excel, calls technician to confirm location — 3–5 min per urgent WO.
- New hires spend 2–4 weeks learning where equipment physically sits before working independently.
- Audit prep pulls 3 people off the floor for a full week to reconcile binder records with actual asset locations.
- Wrong-asset repairs occur in 4–7% of work orders in multi-building facilities.
- Dispatcher assigns by map click — technician sees asset pin, photo, and history on their tablet instantly.
- New hires reach productive autonomy in 4–6 days; the map IS the onboarding tool.
- Auditors self-serve zone-scoped reports from the CMMS — zero floor-personnel pulled.
- Wrong-asset repairs drop below 0.5% — QR/NFC scan confirms identity before any wrench turns.
ROLLOUT TIMELINE
A 12-week deployment plan for your first facility
Most single-building rollouts complete in 8–12 weeks. The timeline below assumes a 200–400 asset facility and a dedicated project lead splitting 40% of their time on the deployment.
Audit & blueprint prep
Collect current CAD/PDF plans, verify scale accuracy, and reconcile the existing asset register against physical walkdowns. Tag gaps with a red-line report.
Plan ingestion & georeferencing
Upload floor plans to the CMMS, normalize scale, split into floor layers, and confirm coordinate accuracy against known reference points to within ±6 inches.
Asset pinning & QR tagging
Drop each asset onto its coordinate, attach photos and spec sheets, and physically affix QR or NFC tags. Walkdown crew averages 25–40 assets per day.
Work-order migration & linkage
Import open and historical work orders, link each to its asset coordinate, and configure PM triggers that fire from the map interface.
Mobile rollout & technician training
Deploy the mobile app to field staff, run scenario-based training (locate, scan, complete WO offline), and certify each technician on map navigation.
Go-live & baseline measurement
Cut over fully from spreadsheet dispatch to map-based dispatch. Establish a 30-day baseline of locate-time, wrong-asset, and overtime metrics to measure ROI.
WHAT TEAMS SAY
Facility teams report measurable gains in the first quarter
"Our Joint Commission environment-of-care audit went from a five-day fire drill to a two-hour walkthrough. The auditor literally navigated our floor plan herself and pulled asset history on the spot."
"We mapped 1,400 assets across 12 campus buildings in seven weeks. Dispatch-to-arrival dropped from 22 minutes to 9, and our new technicians stopped getting lost in building six."
Ready to pin every asset to its exact location?
Upload your first floor plan, map 50 assets free, and watch dispatch time drop inside one work-order cycle.
FAQ
Floor plan asset mapping — the questions facility teams ask most
What file formats can I upload for my building floor plan?
The CMMS accepts CAD (.dwg, .dxf), PDF, JPEG, PNG, and TIFF files. For best accuracy, CAD originals are preferred — they carry true scale data and layer separation. Scanned paper blueprints are auto-georeferenced during ingestion, with a typical scale accuracy of ±6 inches after processing.
How long does it take to map a 200-asset facility?
A single building with 200 assets and clean CAD plans typically completes in 8–12 weeks end-to-end: 2 weeks of audit and prep, 3 weeks of ingestion and pinning, 2 weeks of work-order linkage, and 2–3 weeks of mobile rollout and training. You can Book a Demo to get a tailored timeline estimate for your facility.
Do technicians need internet access to use the floor plan in the field?
No. The mobile app caches the full floor plan and asset data locally on the device, so technicians working in basements, rooftops, or remote outbuildings can navigate, scan QR codes, open work orders, and log completions offline. Data syncs automatically when connectivity returns.
Can I use floor plan mapping across multiple buildings or campuses?
Yes. The system supports unlimited buildings, each with its own plan set and floor hierarchy. Dispatchers switch between sites from a single dashboard, and cross-site reporting rolls up asset performance, work-order status, and compliance metrics at the portfolio level.
How does spatial asset tracking support ISO 55000 and audit compliance?
Every asset record carries a timestamped location history, so auditors can verify that equipment was inspected at the correct place and time. Zone-scoped reports export in PDF or CSV for ISO 55000, Joint Commission, or FMCSA evidence packets — eliminating the manual reconciliation that typically consumes 200+ labor-hours per audit cycle.
Map your first facility this week
Upload a floor plan, pin 50 assets, and feel the dispatch-speed difference inside your next PM cycle.
Free 14-day trial · No credit card