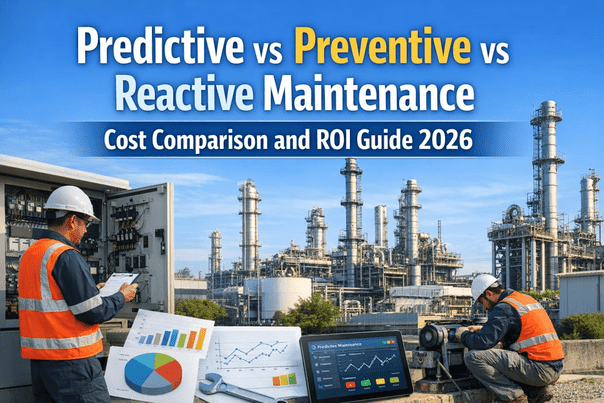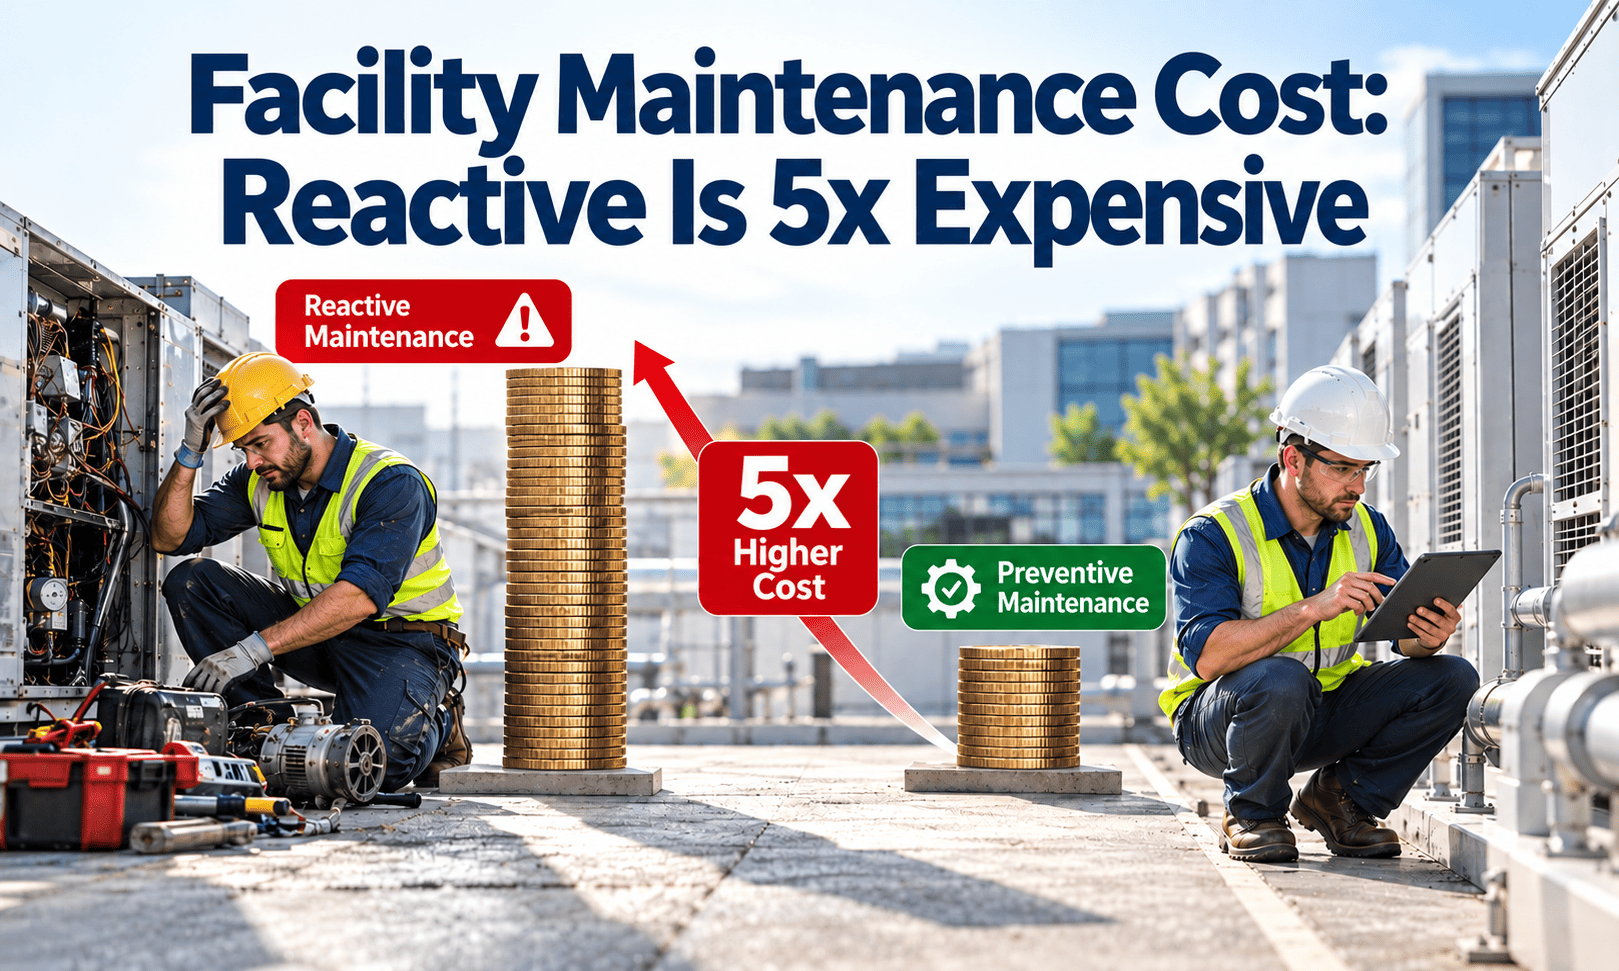
The invoice for a failed pump looks like one number. The real cost of a reactive repair is spread across overtime, rush parts, damaged equipment nearby, lost use of the space and the planned work that was pushed aside to deal with it. That is why reactive maintenance so often turns out to cost several times more than the same fix done on schedule. Understanding where those costs hide, and tracking them in a system that records every work order, is the first step toward shifting spend to planned work.
Facility Maintenance Cost: Why Reactive Repairs Cost So Much More
See what makes up the reactive premium, how it differs by asset class, and where preventive work stops paying back.
Anatomy of a Reactive Repair Bill
When you compare a breakdown with a planned task, the labor hours are rarely the biggest difference.
Why These Costs Stay Hidden
- Overtime is booked to payroll, not to the asset that caused it.
- Secondary damage is repaired under a different budget line.
- Tenant impact never appears in maintenance reporting.
- Displaced PM work shows up later as another failure.
What Published Guidance Says
The U.S. Department of Energy's Federal Energy Management Program publishes operations and maintenance guidance that is widely used as a benchmark.
- A functioning preventive program is reported to deliver meaningful savings compared with running equipment to failure.
- Predictive, condition-based approaches are reported to add further savings on top of preventive.
- Actual savings depend on equipment type, starting condition and program quality.
Treat headline multiples such as four or five times as a prompt to measure your own portfolio, not as a promise. Your work order history is the only number your finance team will accept.
Reactive Cost Drivers by Asset Class
| Asset class | What makes failure expensive | Preventive tasks that reduce it |
|---|---|---|
| Chillers and boilers | Rental plant, comfort loss, emergency contractor rates | Water treatment, tube checks, controls verification |
| Air handlers and fans | Belt, bearing and motor damage, long lead times | Belt and bearing checks, filter changes, coil cleaning |
| Pumps and motors | Seal leaks, flooding, secondary motor damage | Alignment, lubrication, vibration spot checks |
| Elevators | Entrapment, accessibility impact, compliance exposure | Scheduled service per contract, inspection follow-up |
| Roofs and envelope | Water intrusion into finishes and equipment | Seasonal inspection, drain clearing, sealant repair |
| Electrical distribution | Outage, safety incident, damaged downstream gear | Thermal scans, torque checks, breaker testing |
| Fire and life safety | Impairments, inspection failure, liability | Code-driven test and inspection routines |
The Switch Point: Where Preventive Stops Paying Back
More maintenance is not always better. Over-maintaining low-risk equipment wastes labor that could protect critical assets.
- Failure has little operational or safety consequence
- Replacement is cheap and fast
- A spare is on the shelf or readily available
- Failure occurs at random, not with age
- Failure interrupts occupants or core operations
- Parts have long lead times
- Failures cause secondary damage
- Wear is predictable by time or usage
- Condition can be measured, such as vibration or temperature
- Failure is costly but not age-related
- Fixed intervals waste labor
- Data capture is practical
A Simple Break-Even Test
For any recurring PM task, compare the yearly cost of doing it against the expected yearly cost it prevents.
Use your own failure counts and your fully loaded reactive cost. If you lack that data, collecting it is the first project.
Measuring Your Own Reactive Cost
You do not need a perfect model. You need consistent tracking for a handful of measures.
Moving Spend from Reactive to Planned
Shift work in stages. A sudden change overwhelms the team and rarely sticks.
Presenting the Case to Finance
Finance teams respond to evidence they can audit. Show the chain from record to saving.
What to Include
- Twelve months of reactive cost by asset class, taken directly from work orders.
- Repeat-failure assets and the cost of each event.
- The proposed PM or spares investment and its expected avoided cost.
- Assumptions written plainly, with a range rather than a single figure.
- A review date to report what actually happened.
What to Avoid
- Quoting a generic multiple without local data.
- Counting savings that cannot be traced to a work order.
- Ignoring the cost of the preventive work itself.
How Oxmaint Supports Cost Tracking
Cost comparison only works when every job is recorded the same way.
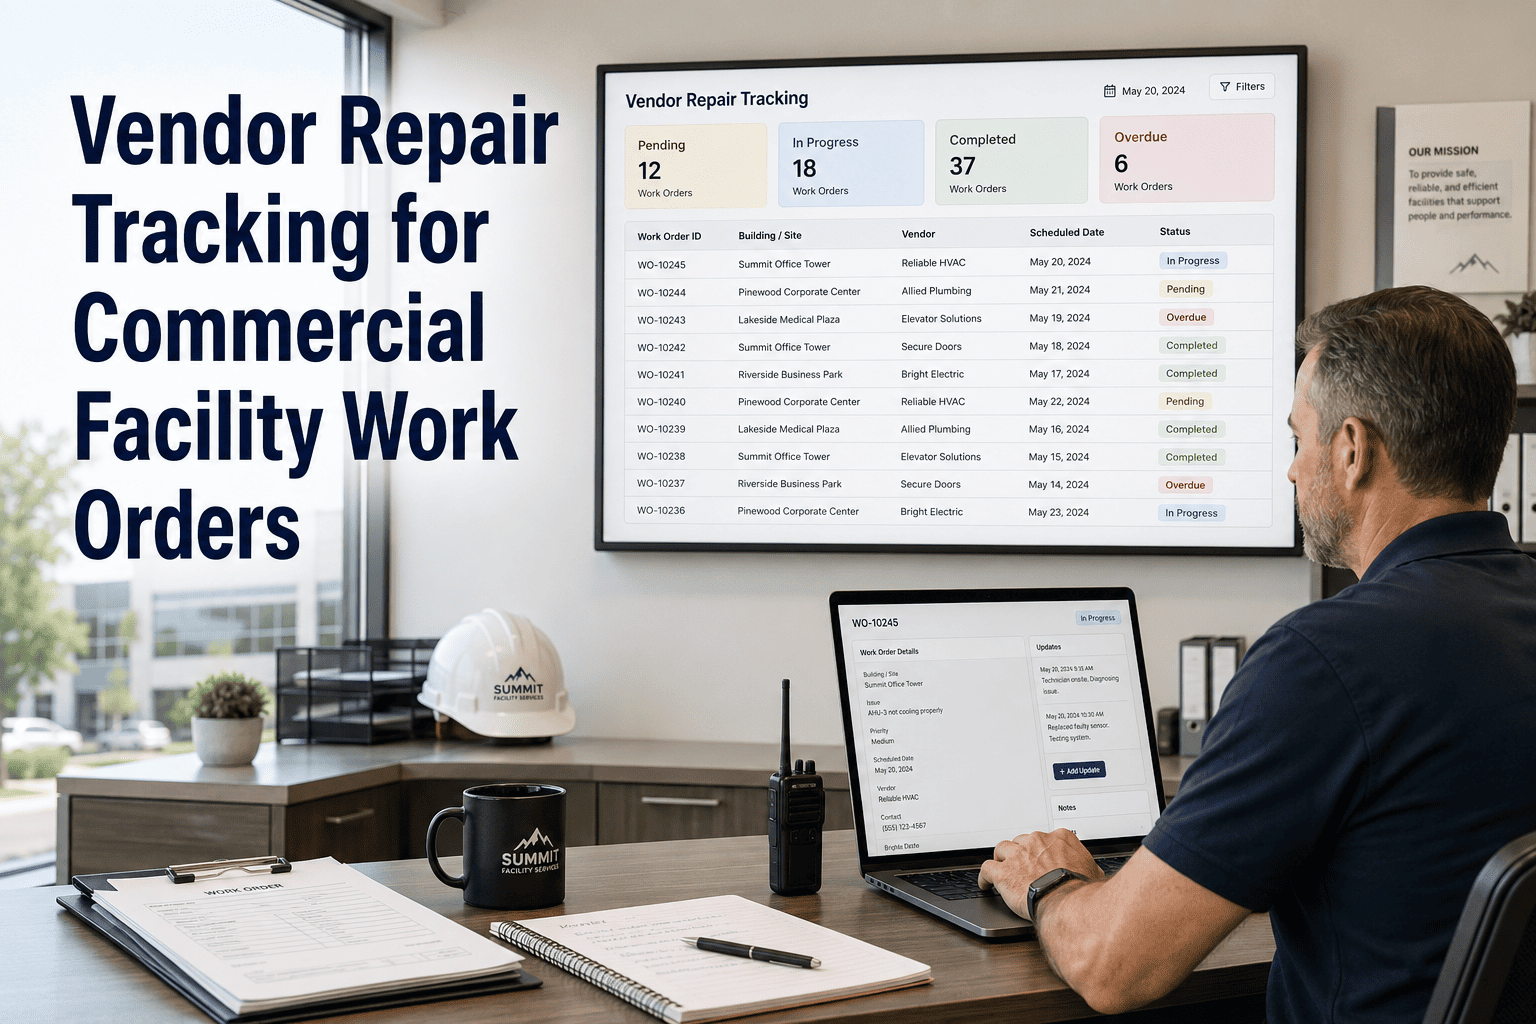
- Work orders that capture labor, parts, vendor cost and downtime per asset.
- Preventive maintenance scheduling with completion tracking.
- Corrective work flagged separately so planned and reactive spend can be compared.
- Inventory for critical spares, reducing rush purchases.
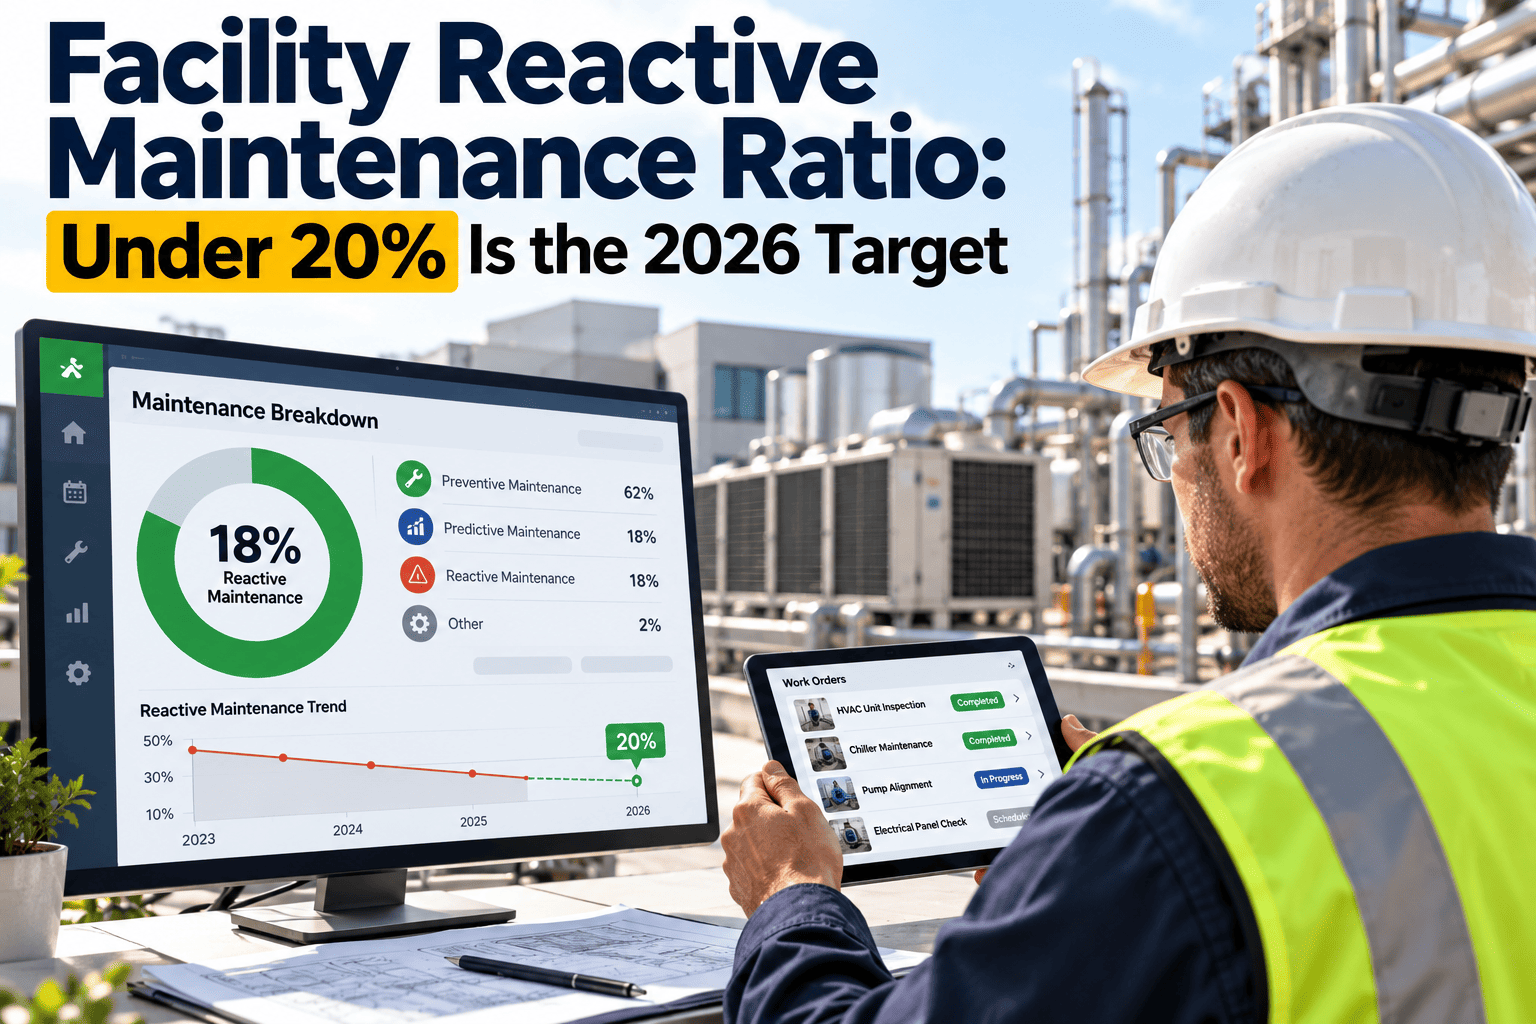
- Dashboards for emergency share, PM compliance and repeat failures.
- Mobile completion so technicians record cost details at the job.
You can see a cost report built from work order data in a short walkthrough.