A facility predictive maintenance program rarely fails because of the sensors. It fails because the pilot never gets a clear owner, the alerts never reach a work order, and the technicians who must act on them were never asked how they work. This 90-day playbook shows how to move from a small pilot to a production routine in three phases: scope and baseline, install and integrate, then coach and scale. Teams that already run preventive maintenance and work orders in a CMMS such as Oxmaint maintenance management software start with the hardest part already in place.
From pilot to production in 90 days without losing the maintenance team on the way
A practical deployment plan for commercial facilities: choose pilot assets that prove the case, select a vendor on evidence, install sensors cleanly, connect alerts to work orders, and coach technicians until the routine holds.
Where facility PdM programs stall between pilot and production
Stalled programs share a pattern. Sensors go in, a dashboard appears, and nobody owns the next step. Naming these five stall points before day one makes each of them cheaper to avoid.
- No baselineWithout emergency work orders, downtime, and repair spend recorded before installation, nobody can show that the pilot changed anything.
- Wrong first assetsA pilot on a low-consequence asset produces no budget argument, even when the technology works exactly as promised.
- Alerts without a pathAn alert that does not become a reviewed work order turns into one more notification that people learn to mute.
- Contract surprisesData export limits, naming mismatches, and integration fees discovered in month four stall a rollout that looked settled.
- Skipped people workTechnicians who were not part of the design treat new alerts as extra paperwork rather than useful information.
The 90-day deployment map
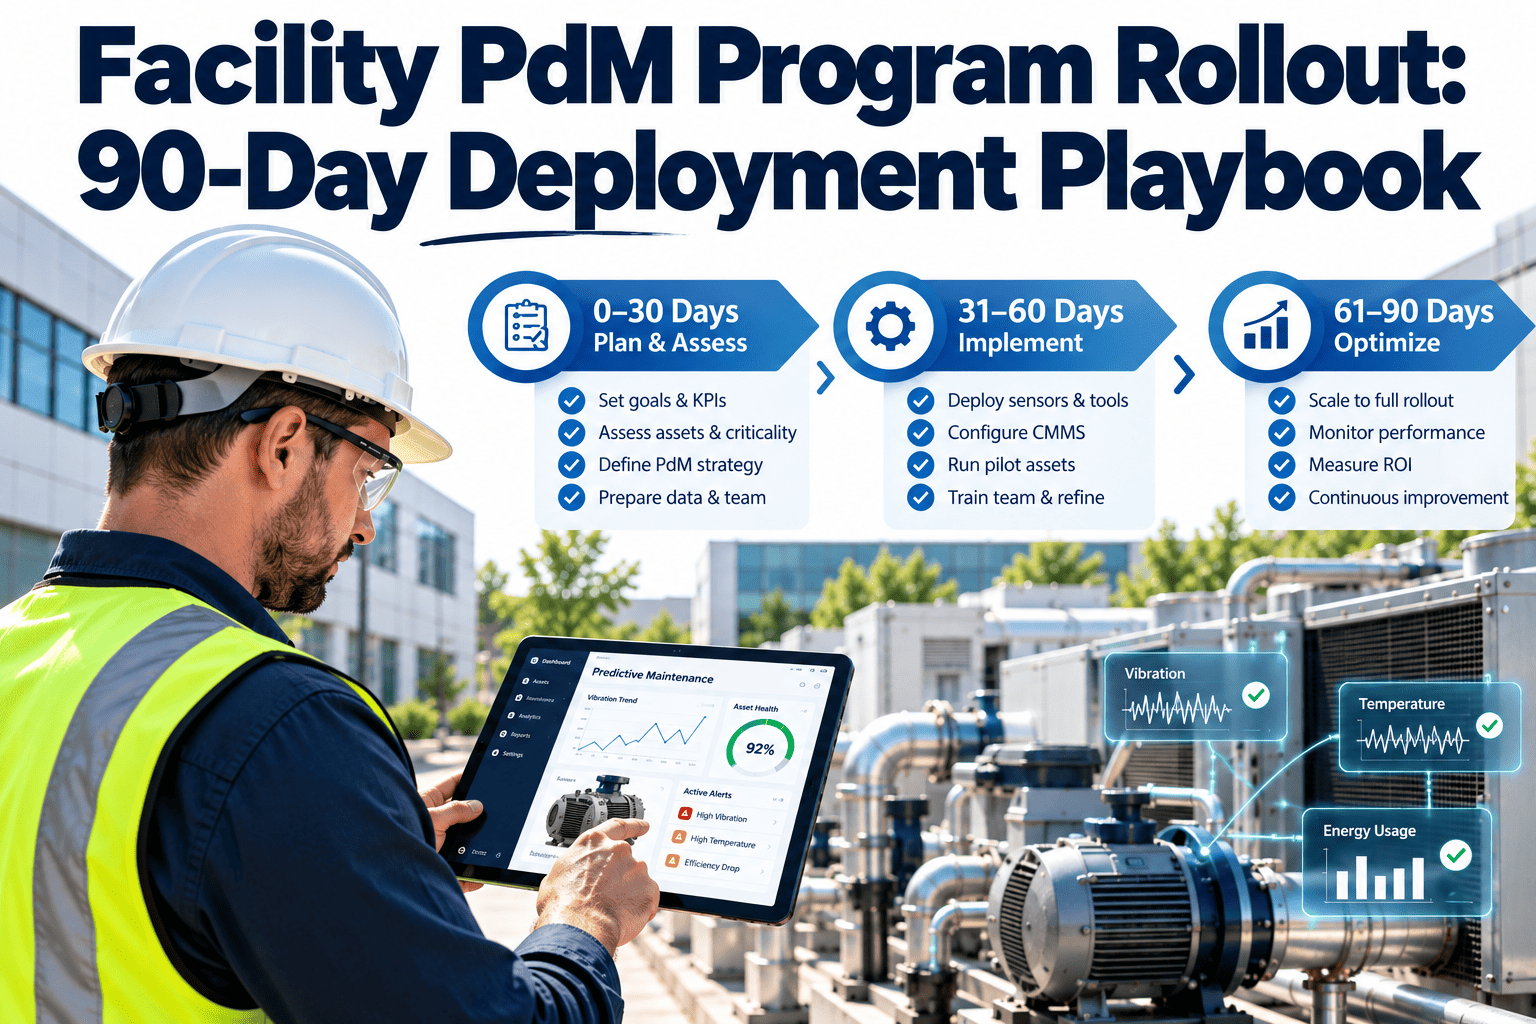
Each phase runs about 30 days and ends with a gate that maintenance, operations, and finance can all read. The gates keep the program honest about what has been proven and what is still being learned.
Scope, baseline, select
- Name the program owner and pilot team
- Rank candidate assets by consequence of failure
- Pull baseline numbers from the CMMS
- Score vendors and choose one
Install, connect, calibrate
- Survey, mount, and tag every sensor
- Capture healthy-state baselines
- Write alert rules and tiers
- Test the alert-to-work-order path
Coach, validate, decide
- Run weekly alert review meetings
- Verify alerts by physical inspection
- Tune thresholds from false positives
- Compare against the baseline
A 90-day window delivers a working routine and the first validated findings. Some assets need 90 to 180 days of data before patterns are convincing, so the day-90 gate judges process health and early results rather than a finished return on investment.
Week-by-week deliverables
Use this table as the program checklist. Every row has an owner and a piece of evidence, so progress is something you can inspect rather than something people report.
| Week | Deliverable | Owner | Exit evidence |
|---|---|---|---|
| 1 | Kickoff, pilot team, success criteria | Maintenance manager | One-page criteria document signed |
| 2 | Baseline pull for candidate assets | Planner | Baseline sheet from CMMS history |
| 3 | Criticality ranking and failure-mode map | Reliability lead | 3 to 5 pilot assets confirmed |
| 4 | Vendor scorecard and IT security review | Maintenance, IT, procurement | Vendor selected, scorecard filed |
| 5 | Site survey, mounting points, network check | Vendor and electrician | Installation plan approved |
| 6 | Sensor installation and tag mapping | Vendor and technicians | All sensors reporting to the platform |
| 7 | Healthy-state signatures and draft alert rules | Reliability lead | Alert rule register |
| 8 | CMMS integration and test work order | Planner and system admin | Test order closes with failure code |
| 9 | Technician coaching and ride-alongs begin | Maintenance supervisor | Training log |
| 10 | Live alert triage meetings | Reliability lead and planner | False-positive log started |
| 11 | Physical verification of alerts | Technicians | Validated alert list |
| 12 to 13 | Baseline comparison and gate briefing | Maintenance manager | Scale proposal and wave-two plan |
Days 1 to 30: scope, baseline, and choose the vendor
Pick pilot assets that can prove the case
The best pilot assets combine real consequence with a failure mode that sensors can actually see. Apply these selection rules to every candidate.
- Failure disrupts occupants, tenants, or a critical process, so a prevented failure has a visible value
- The failure mode shows up in vibration, temperature, current, pressure, or ultrasound signals
- The asset has recurring corrective history in the CMMS to compare against
- Sensors can be mounted safely and the asset record is clean
Record the baseline before a sensor is mounted
Pull these figures for the 90 days before installation. They become the denominator for every claim you make at the gate.
Score vendors on evidence, not demos
The weights below are a suggested starting point. Adjust them to your facility, but agree on them before the first vendor presentation.
| Criterion | Suggested weight | Question to ask |
|---|---|---|
| Fit to your failure modes | 20 | Which of our pilot assets and failure modes have you monitored before? |
| Data ownership and export | 15 | Can we export raw and derived data in an open format at any time? |
| CMMS integration | 15 | How do alerts become work orders, and which asset ID do they use? |
| Install and commissioning | 15 | Who mounts, labels, and verifies each sensor? |
| Alert quality and tuning | 10 | How are thresholds tuned and who owns false positives? |
| Security and IT fit | 10 | How is the sensor network segmented and how is remote access controlled? |
| Three-year total cost | 10 | What are hardware, subscription, integration, and renewal costs? |
| Similar reference sites | 5 | Can we speak with a facility of our type and size? |
Days 31 to 60: install sensors and connect them to work orders
Installation quality decides data quality. Treat mounting, labeling, and tag mapping as maintenance work with its own checklist and sign-off.
Before installation
- Asset IDs in the CMMS match the names the platform will use
- Lockout and access permits arranged for each asset
- Network route chosen: wired for a single plant room, cellular or wireless mesh for multi-building sites
- IT security review completed for the sensor network
During installation
- Mounting surfaces cleaned and sensor positions photographed
- Each sensor labeled with the asset ID and measurement point
- Signal confirmed at the platform before moving to the next asset
- Nameplate data and operating speed recorded
After installation
- Healthy-state signatures captured across normal load ranges
- Vibration severity limits aligned to ISO 20816 guidance and the machine class
- Alert thresholds reviewed against your own baseline, not defaults alone
- Sensor battery and connectivity checks added as recurring tasks
The alert-to-work-order path
This is the part that decides whether the program changes behavior. Build it as a defined flow, then test it with a deliberately triggered alert.
- Signal crosses a ruleThe platform compares readings to the healthy-state baseline.
- Alert is tieredAdvisory, warning, or critical, based on rule and asset criticality.
- Reviewer confirmsThe reliability lead checks the trend before work is created.
- Work order is createdPre-filled with asset, signal, and suggested inspection.
- Technician inspectsFindings and photos are captured on a mobile device.
- Closeout with cause codeThe alert is marked confirmed, false, or deferred.
- Rule is tunedCloseout results feed the next threshold review.
| Alert tier | Meaning | Expected response | Work order type |
|---|---|---|---|
| Advisory | Trend has moved from baseline | Add to watch list, review weekly | None until confirmed |
| Warning | Sustained deviation on a critical signal | Inspect within the planning window | Planned inspection or corrective |
| Critical | Rapid change or limit exceeded | Same-shift inspection by a technician | Priority corrective |
Build your pilot inside the system your team already uses
Set up pilot assets, alert-driven work orders, and closeout codes in one maintenance platform, then walk the plan through with a specialist.
Days 61 to 90: coach the team and hold the routine
Technology is installed by day 60. Habits are not. The last phase is about making the new routine easier than the old one.
Without coaching
- Alerts arrive by email and are read when convenient
- Technicians close orders with no cause code
- Planners do not know which alerts were confirmed
- Thresholds never change after commissioning
- The pilot owner becomes the only person who understands it
With coaching
- A weekly 30-minute alert review has a fixed agenda
- Closeout codes are short, clear, and required
- Planners schedule warning-tier work like any other job
- Threshold changes are logged with a reason
- Two or more people can run the triage meeting
What changes for each role
| Role | What changes | Coaching move |
|---|---|---|
| Technician | Inspects on evidence and reports what was found | Ride-along on the first confirmed alert, then ask which signal helped |
| Planner | Schedules condition-driven work in the weekly plan | Practice converting a warning alert into a planned job with parts |
| Supervisor | Protects time for inspections and reviews closeouts | Review five closed alerts together for code quality |
| Manager | Reads leading and lagging indicators together | Brief on one dashboard page, not a data dump |
| Vendor | Supports tuning rather than only hardware | Set a monthly tuning call with a written action list |
Good technicians already know which machines sound wrong. Ask them to compare their instincts with the data. Their feedback improves the rules, and their involvement builds trust in the alerts.
The day-90 gate: scale, adjust, or stop
Judge the pilot on leading indicators that prove the process works and on lagging indicators that show financial effect. Early on, leading indicators carry more weight.
Leading indicators
- Alert-to-inspection conversion rate
- Share of alerts confirmed versus false
- Time from alert to technician inspection
- Closeouts with a usable cause code
Lagging indicators
- Emergency work orders on pilot assets
- Unplanned downtime hours
- Corrective repair spend
- Overtime and contractor callouts
Matching technology to the failure mode
No single sensor covers a whole building. The pilot works best when each technique is chosen for the failure it can realistically see, and when the team knows what it will not see.
| Technique | Typical facility assets | What it can reveal | Limit to plan for |
|---|---|---|---|
| Vibration monitoring | Motors, fans, pumps, compressors | Imbalance, misalignment, looseness, bearing wear | Needs a stable mounting point and a baseline for each speed |
| Infrared thermography | Electrical panels, switchgear, motor connections | Loose or overloaded connections and hot spots | Needs load on the circuit and safe inspection access |
| Ultrasound | Steam traps, compressed air, bearings, valves | Leaks and early friction or lubrication problems | Needs trained operators and a consistent route |
| Motor current analysis | Pumps, fans, and drives with accessible conductors | Electrical and some mechanical faults without touching the machine | Interpretation depends on load stability |
| Temperature and pressure trending | Chillers, boilers, heat exchangers, water systems | Fouling, flow restriction, efficiency drift | Needs calibrated sensors and context such as outdoor conditions |
| Oil and fluid analysis | Gearboxes, compressors, hydraulic systems | Wear particles, contamination, fluid degradation | Results arrive after sampling, not in real time |
If a failure mode leaves no measurable trace, keep it on time-based or inspection-based maintenance. Predictive maintenance extends a good program. It does not replace the basics of lubrication, filter changes, and visual inspection.
Risks to manage during the 90 days
How a CMMS keeps the rollout from drifting
Condition monitoring creates information. A maintenance management platform turns that information into scheduled, tracked, and measured work.
- Asset management keeps one record per asset so sensors, history, and manuals line up
- Work orders carry alert context, photos, parts, and closeout codes into a single history
- Preventive maintenance schedules can be adjusted once condition data shows an interval is too short or too long
- Inventory links to confirmed failure modes so likely parts are on the shelf
- Dashboards and reporting show leading and lagging indicators in one place
- Mobile workflows let technicians record findings at the machine
Facility PdM rollout questions
How long should a facility PdM pilot run before scaling?
Ninety days produces a working routine and first validated findings. Some assets need longer, so scale on process health plus early results.
How many assets should the pilot include?
Three to five critical assets keeps effort manageable and still gives enough evidence. Add more only after the first alerts become work orders.
Do we need a new CMMS to start?
Not necessarily, but alerts must create work orders and asset IDs must match. You can test the workflow in Oxmaint first.
What should we measure at day 90?
Compare emergency work orders, downtime, and repair spend to the 90-day baseline, plus alert confirmation rate and time to inspection.
Who should own the program?
A reliability lead or maintenance planner with authority over work orders. Book a call to map ownership for your team.
Put your first predictive work order on the schedule this quarter
Start a rollout plan with pilot assets, alert tiers, and closeout codes in place, or review your 90-day map with a maintenance software specialist.