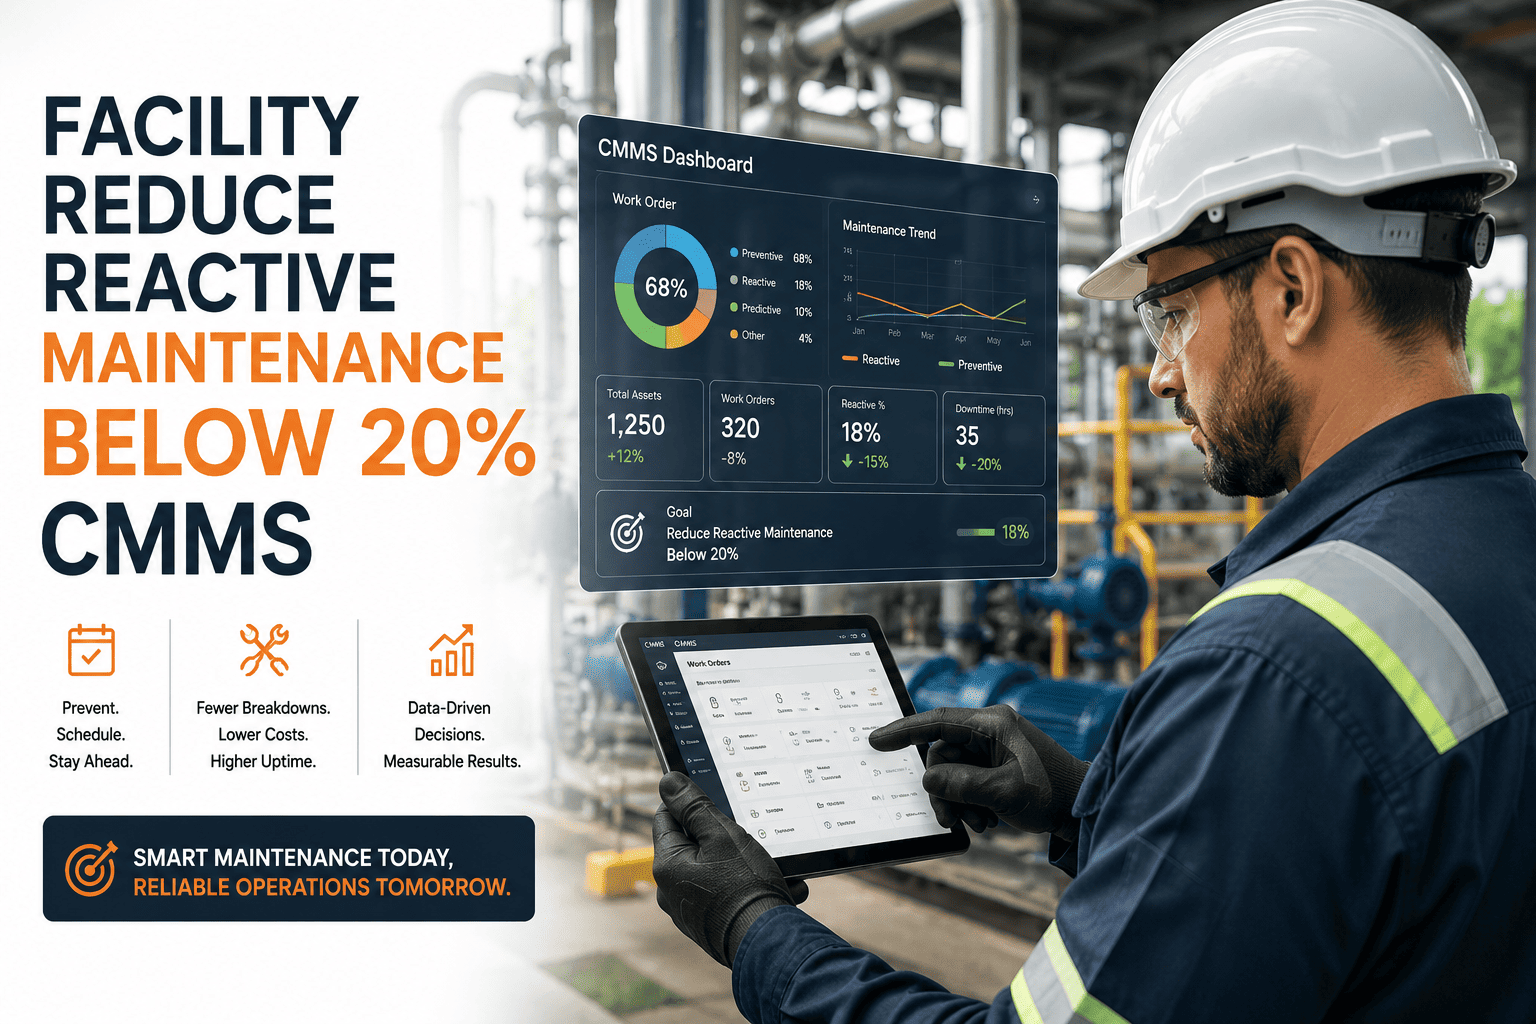
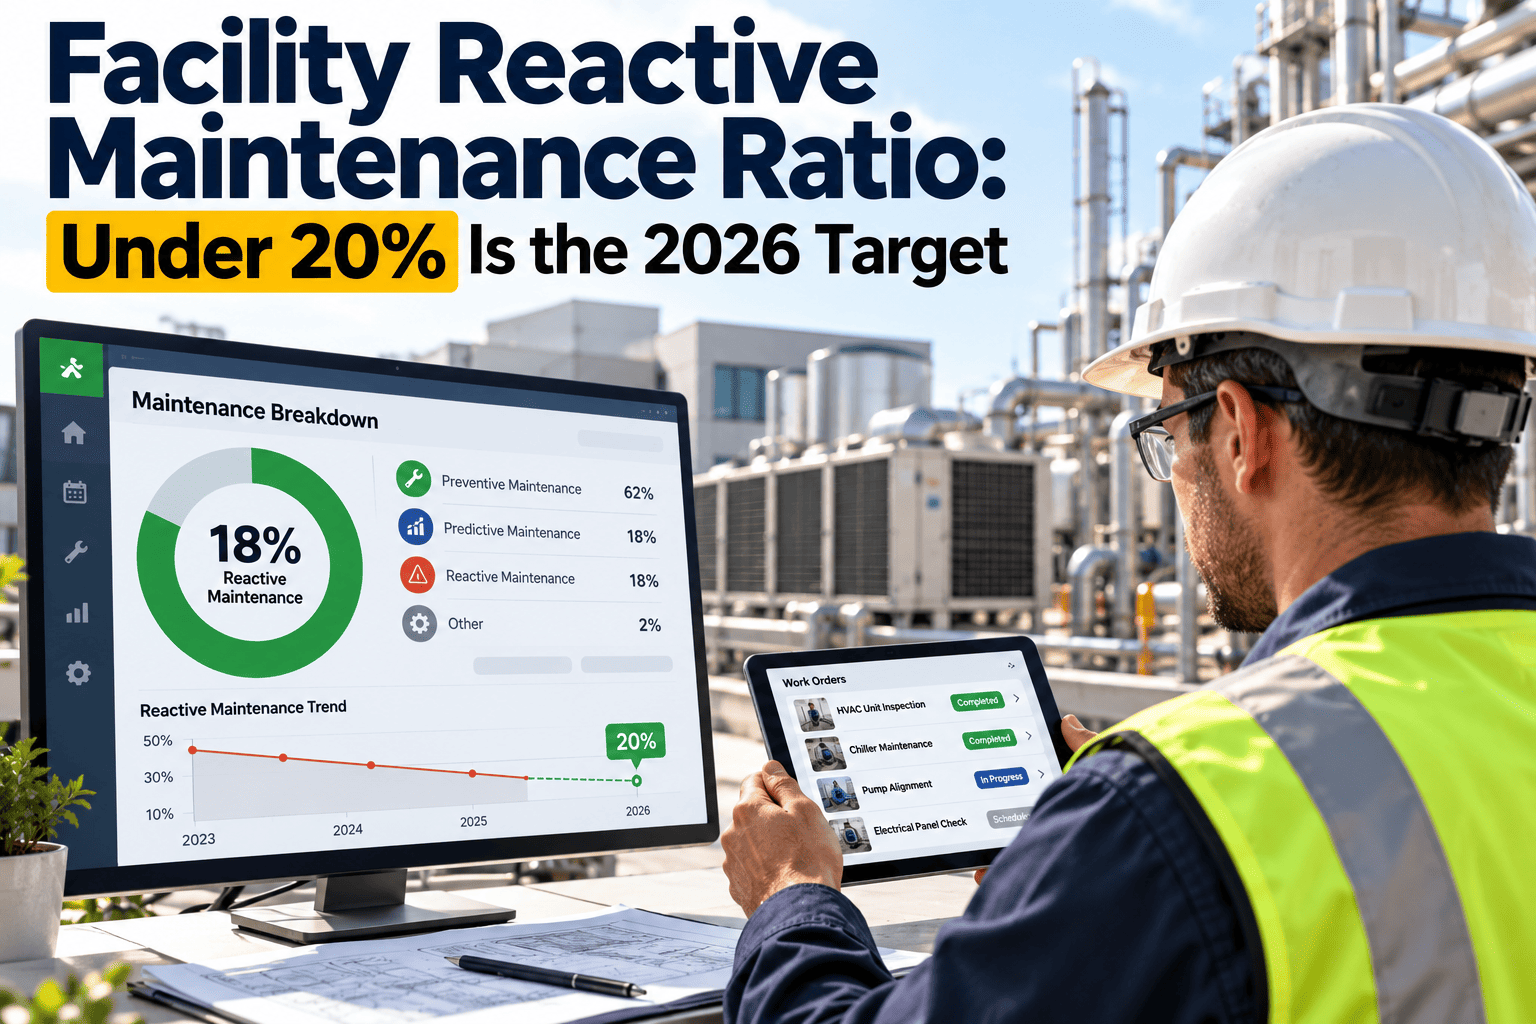
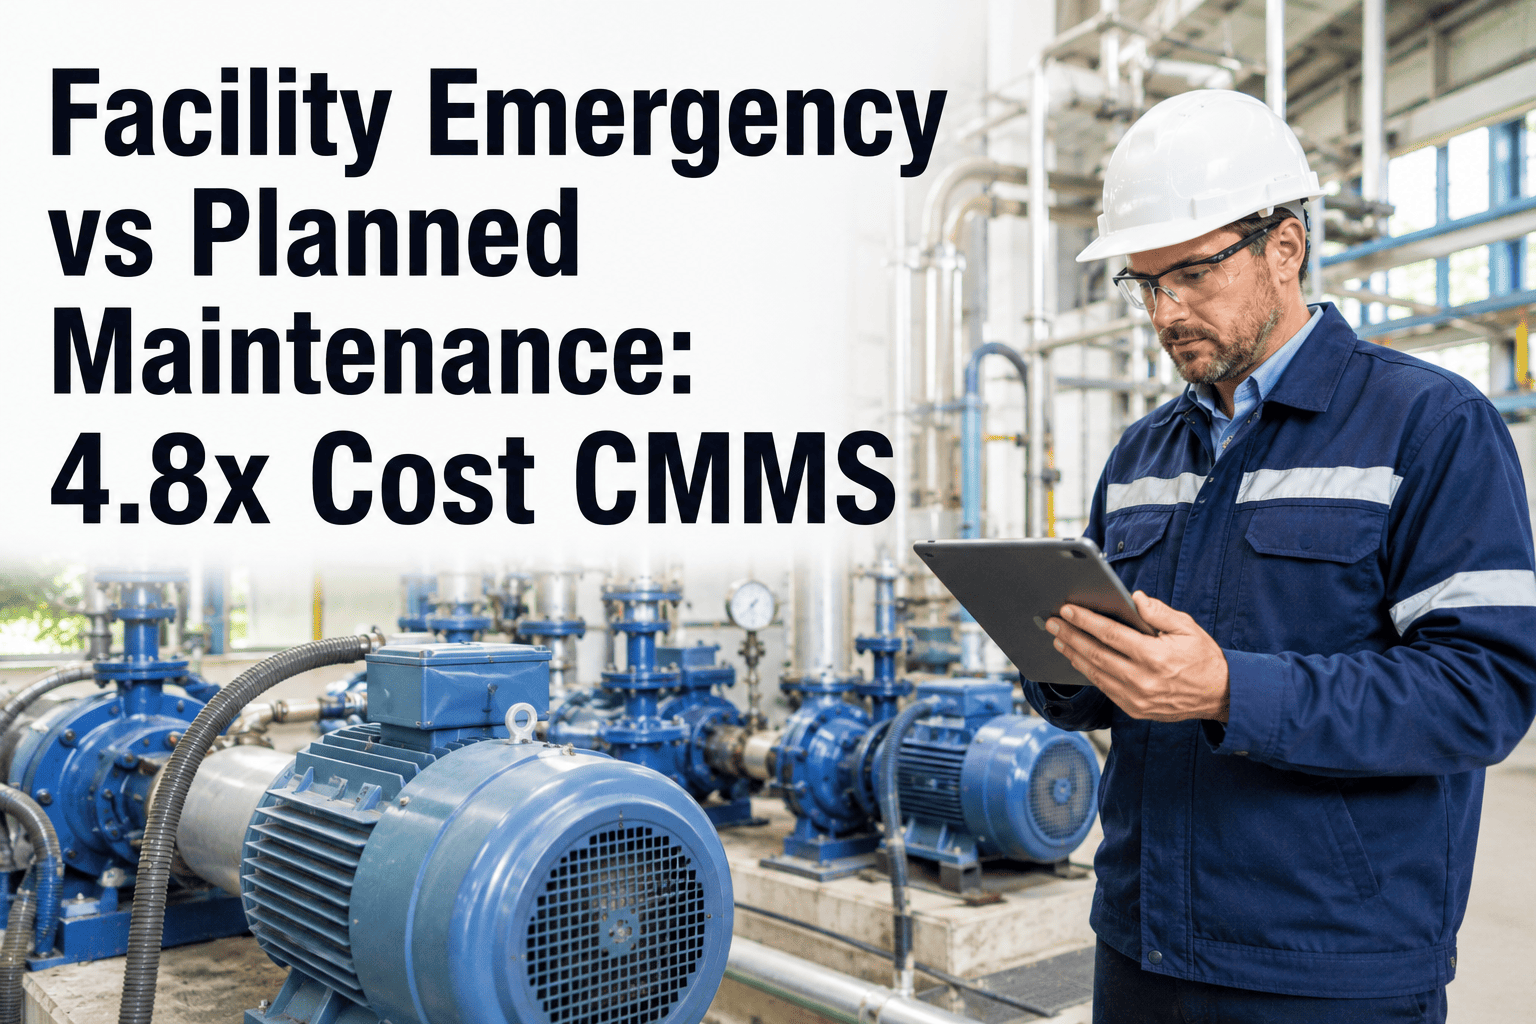
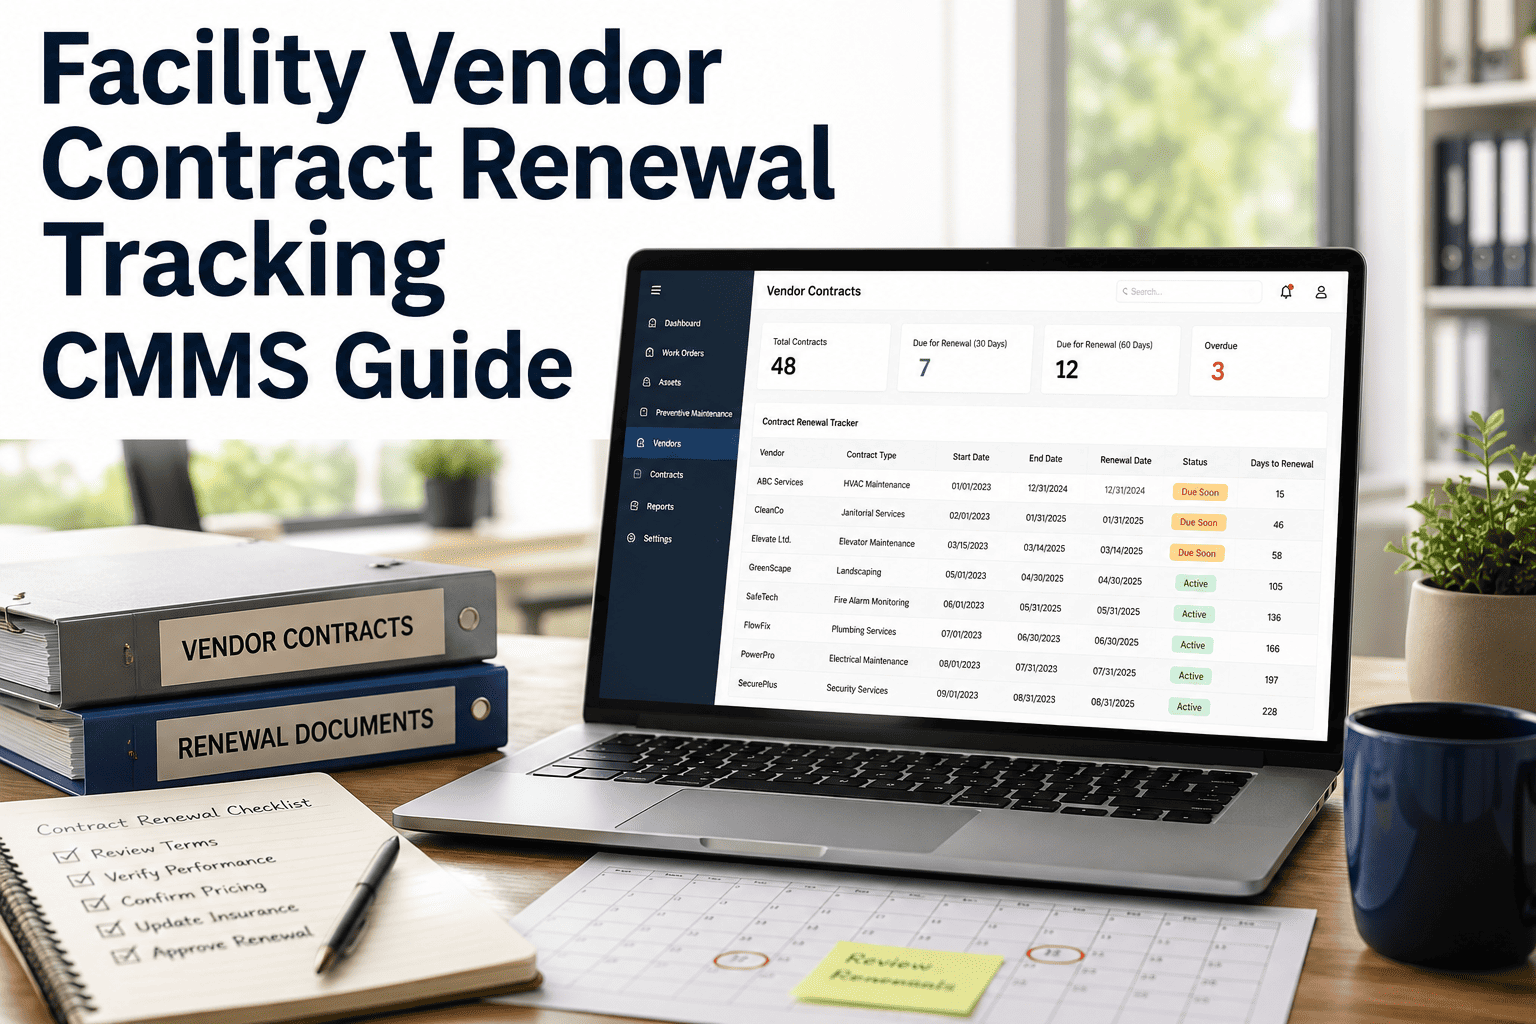
Every facility manager has lived this Monday: the PM schedule is set, technicians are assigned, and by 9 a.m. a chiller trips, a rooftop unit alarms, and the plan is gone. Reactive work is not bad luck — it is a measurable ratio, and most facilities sit between 36% and 50% planned work instead of the 80% that separates ordinary buildings from best-in-class ones. That gap costs real money, because emergency repairs run three to five times more than the same job done on a schedule, and every unplanned callout displaces the very PM task that would have prevented the next one. The facilities that break the cycle do it with structure, not more headcount — a system that tracks the ratio, schedules PMs automatically, and shows exactly where reactive work drains the budget, which is exactly what OxMaint's preventive maintenance module is built to do.
Reactive Maintenance Ratio Check
See your planned-vs-reactive split before you fix it
OxMaint calculates the ratio automatically from your existing work order data — no spreadsheet required.
Planned-to-reactive ratio that defines best-in-class facility maintenance
3–5x
Higher cost of an emergency repair compared to the identical planned job
50%+
Reactive share where facilities enter the danger zone of compounding failures
The Ratio That Predicts Whether You're In Control
Planned maintenance percentage is the single number that tells you whether your team is managing assets or being managed by them. It is the share of maintenance labour hours spent on scheduled PM and planned repair work versus emergency callouts and breakdown response.
Where Facilities Sit on the Reactive-to-Planned Scale
20–40%
Reactive Facility
60–65%
Improving
80%
Best-in-Class
85–90%
World-Class
Planned maintenance share of total labour hours — most facilities never measure this until costs force the question
What 50%+ Reactive Actually Costs You
A high reactive ratio doesn't just mean more work orders. It changes the economics of every repair on the floor.
Planned repair
1x baseline cost
Reactive repair
3–5x baseline cost
Emergency labour, expedited parts, and secondary asset damage stack on top of the base repair — the same job, done unplanned, rarely costs less than triple.
Overtime & Emergency Labour
After-hours callouts and rush contractor rates push labour cost per repair well above scheduled-shift rates.
Expedited Parts
Next-day freight and emergency vendor sourcing routinely double the parts line on a breakdown work order.
Secondary Damage
A failure caught late rarely stays contained — one bearing failure can take out a motor, a belt, and a downstream asset.
Budget Unpredictability
Reactive-heavy facilities can't forecast spend — every quarter closes with an unbudgeted variance to explain.
Most teams don't need more staff to fix this — they need visibility into where reactive work is actually coming from.
The Four-Stage Path from Firefighting to Best-in-Class
Facilities that move their ratio don't do it in one leap. The shift happens in stages, and each one has a different cost impact and typical timeframe.
Stage
Planned Ratio
Cost per Repair Impact
Typical Timeframe
Reactive Facility
20–40%
Highest — constant emergency premium
Starting point
Structured Response
60–65%
Moderate — backlog under control
30–60 days
Best-in-Class
80%
Low — repairs mostly scheduled
90 days
World-Class
85–90%
Lowest — predictable, budgeted spend
12 months
What a Structured PM Program Looks Like in OxMaint
The ratio doesn't move because a team tries harder. It moves when the scheduling, tracking, and visibility work is handled by the system instead of memory.
Automatic PM Scheduling
PM tasks generate on a calendar, meter reading, or condition trigger — no technician has to remember what's due this week.
Live Planned-to-Reactive Ratio
The ratio recalculates from every closed work order, by site, by asset class, updated in real time instead of a monthly report.
Overdue PM Alerts
Managers see a PM the moment it ages past due, not at the end of the reporting cycle when the asset has already failed.
Cost per Repair Tracking
Planned versus reactive cost per work order is captured automatically, giving finance the number that justifies the PM budget.
Asset Failure History
Every breakdown is logged against the asset record, so recurring failure patterns are visible instead of repeated blind.
Mobile Work Orders
Technicians close out PM and reactive work from the floor, keeping the ratio accurate without end-of-day paperwork.
80%
Planned maintenance target for best-in-class facilities
60%
Fewer emergency callouts once PM compliance stabilises
70%
PM compliance rate typical in facilities running OxMaint scheduling
90 days
Typical time to shift a facility from reactive toward best-in-class
We thought a 48% planned ratio was normal because the team was busy and requests were getting handled. The benchmark told us we were firefighting, not maintaining. Once PM compliance climbed and the reactive calls dropped by roughly 25 a month, our cost per repair fell in step.
Best-in-class facilities keep reactive work at 20% or below, meaning 80% of labour hours go to planned PM and scheduled repair. Above 50% reactive is considered a danger zone. See where your facility stands by connecting your work order history.
Divide total reactive labour hours by total maintenance labour hours for the period, then multiply by 100. Most teams underestimate this until it's pulled directly from closed work orders rather than memory or spreadsheets.
Most facilities see a meaningful shift within 90 days of structured PM scheduling, with world-class ratios of 85–90% typically reached within 12 months of sustained compliance.
Tracking is the first step, but automatic PM scheduling, overdue alerts, and mobile work order closure are what actually prevent the breakdowns that create reactive work in the first place. Book a demo to see the scheduling engine in action.
Measure your current ratio before changing anything — you can't fix what you haven't quantified. From there, PM compliance on the highest-failure assets delivers the fastest visible improvement.
Reactive Maintenance — OxMaint
Find out your reactive ratio. Then bring it below 20%.