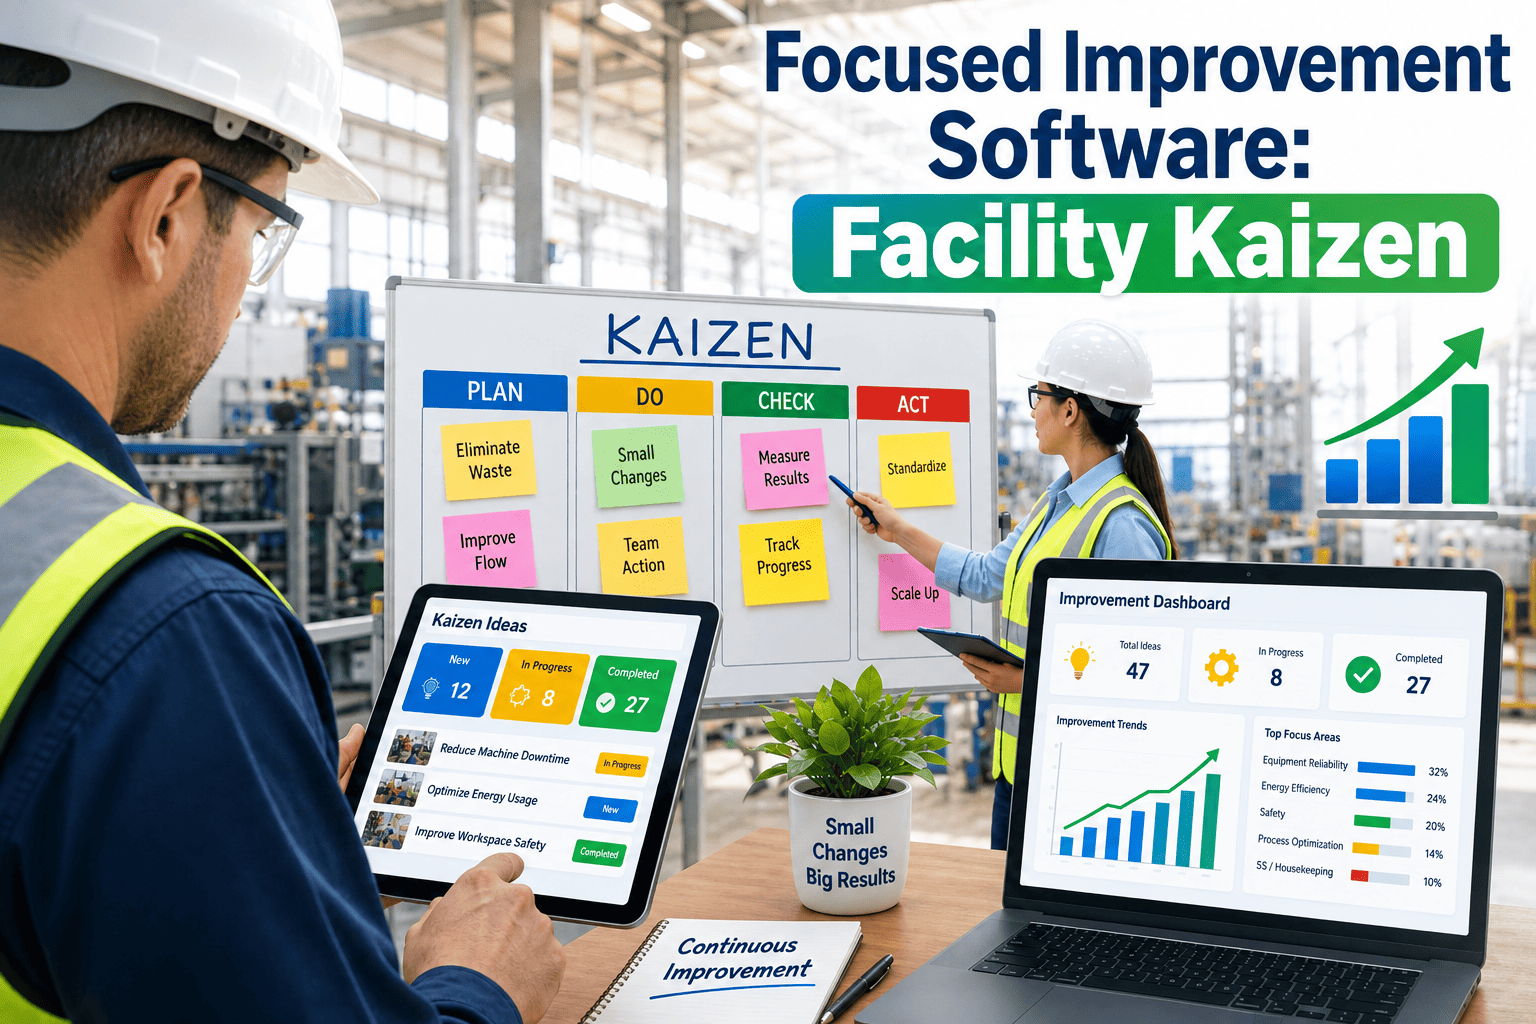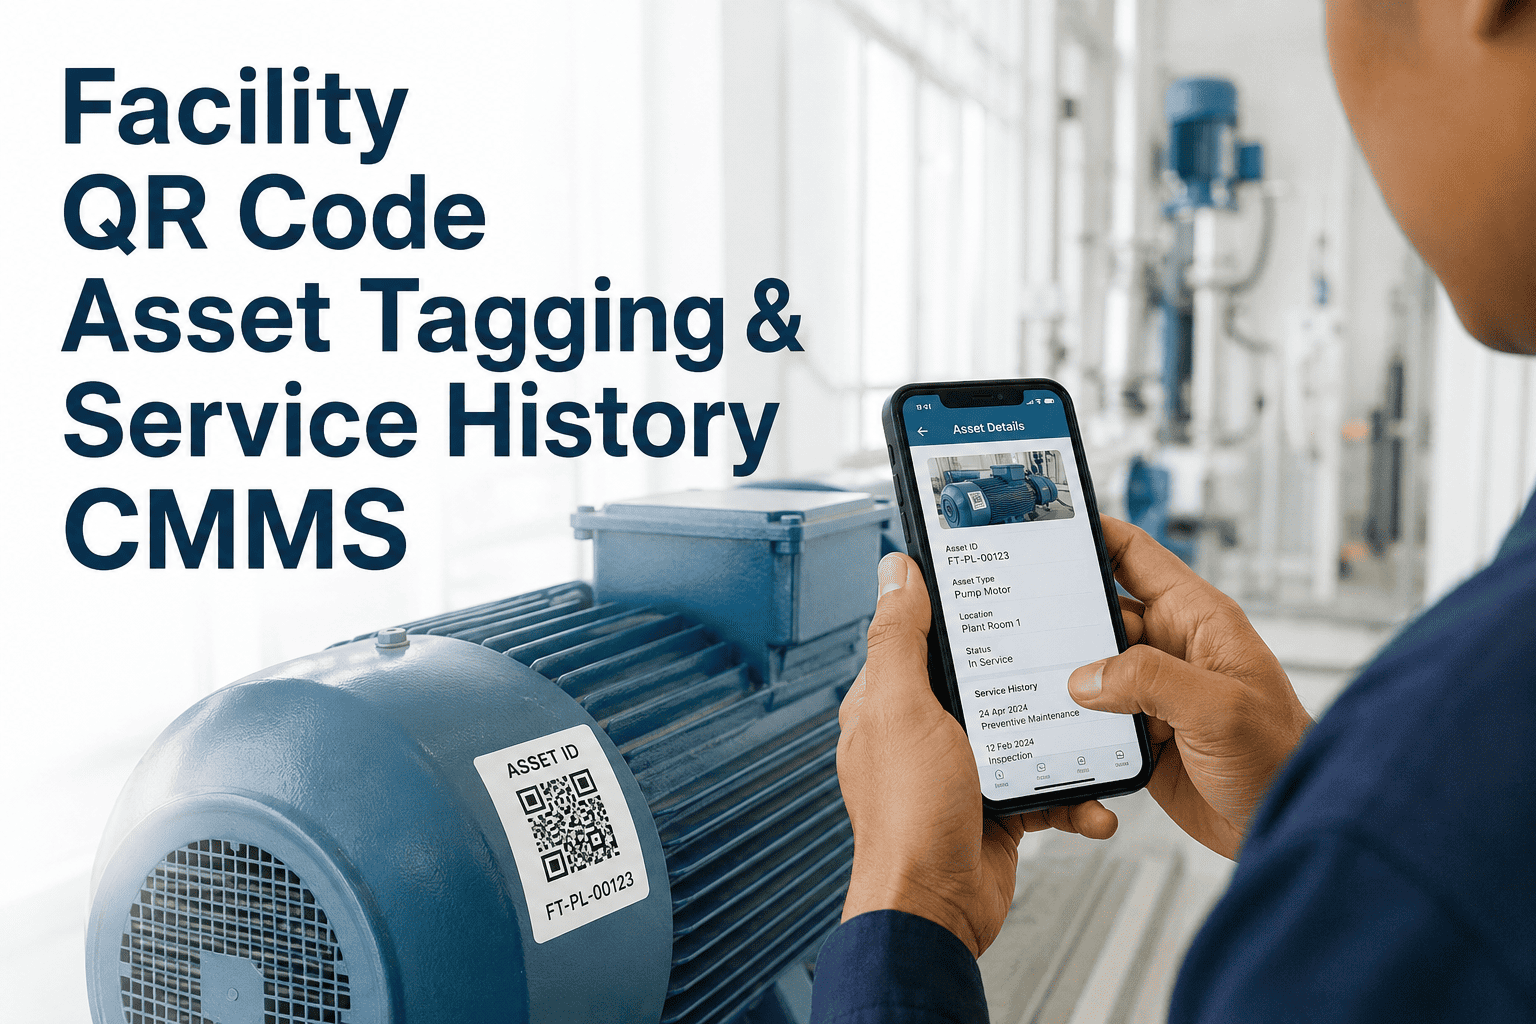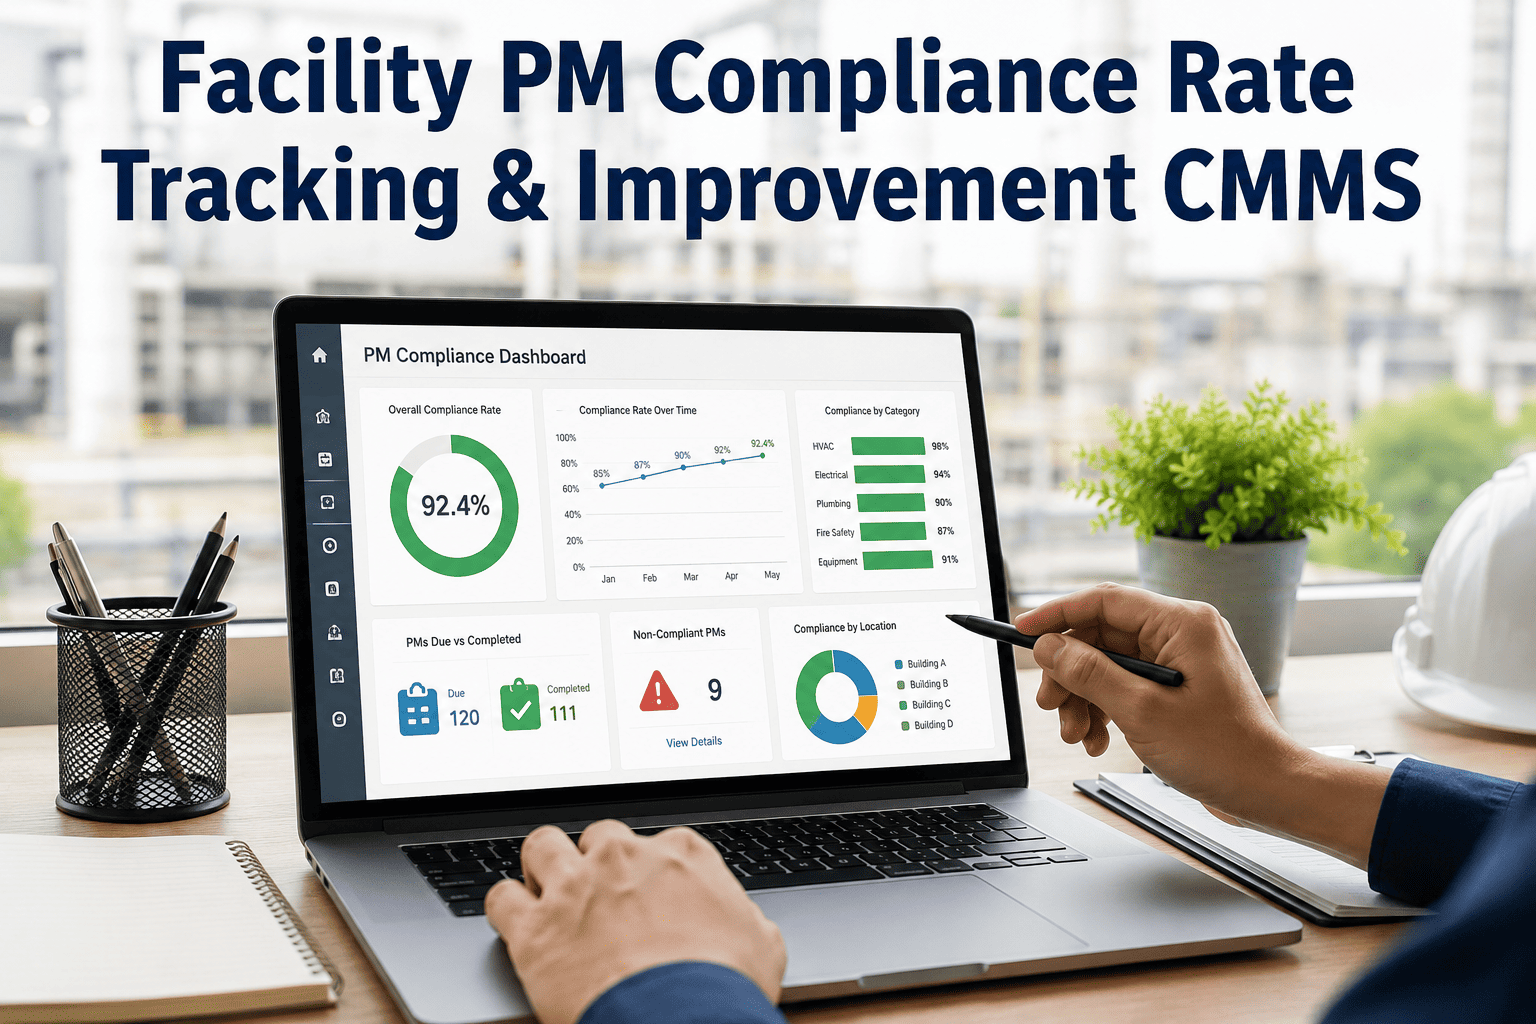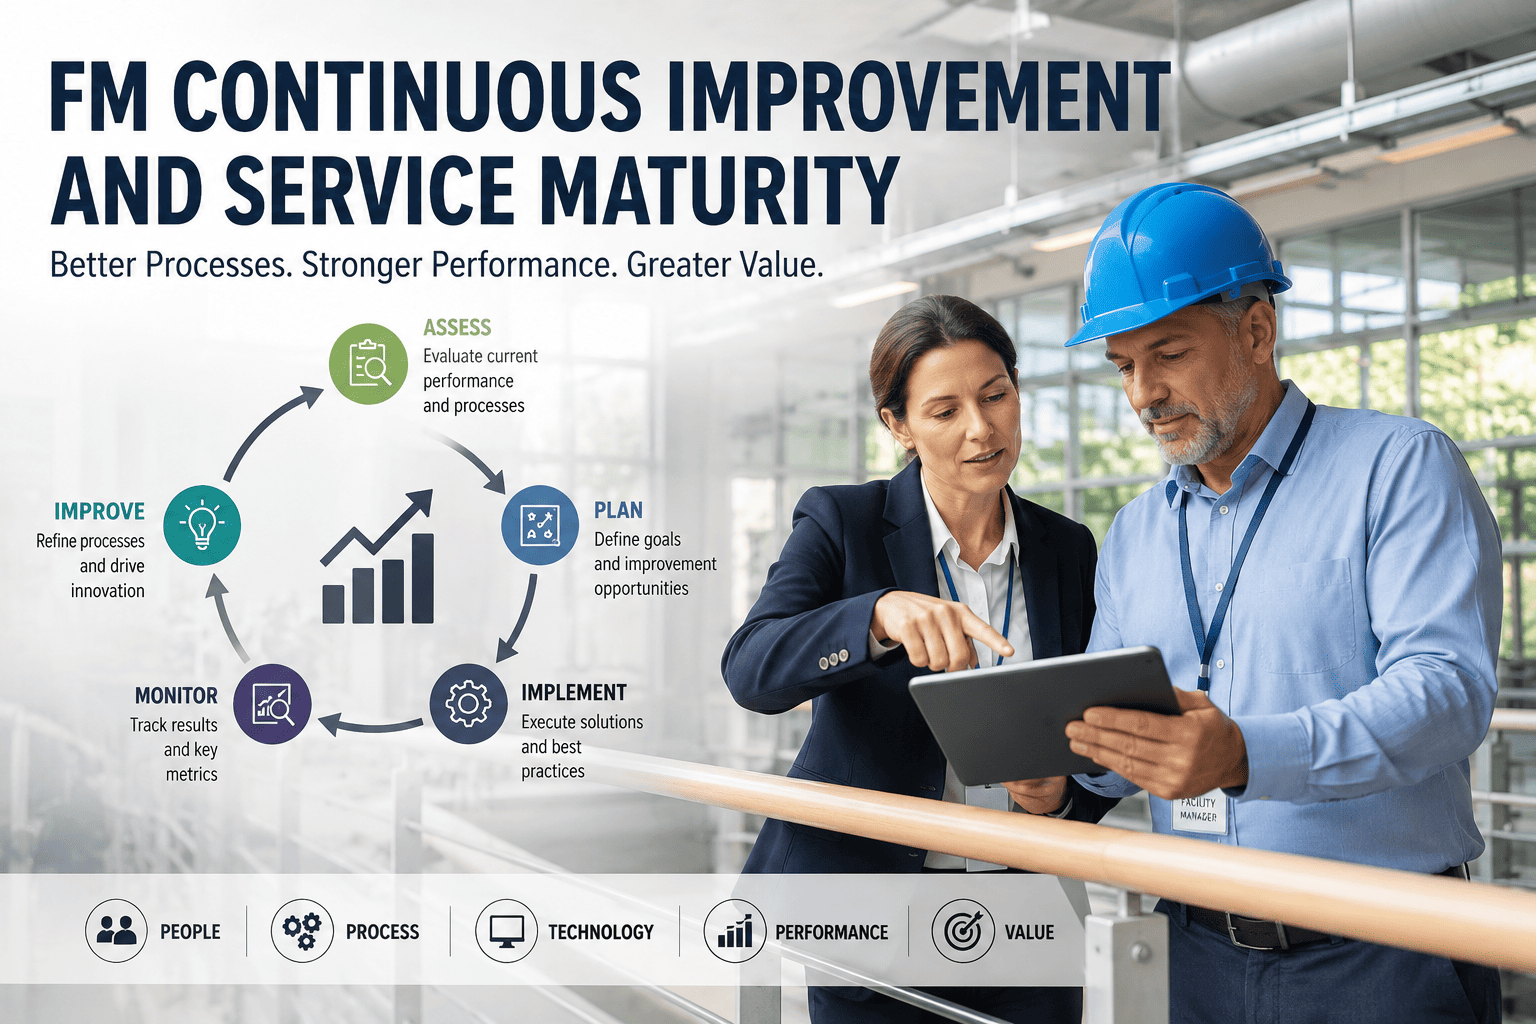
FM continuous improvement is the disciplined practice of making many small, measurable gains in facility service delivery rather than waiting for a single transformational overhaul — and pairing it with a facility service maturity model gives teams a structured roadmap to move from reactive firefighting to predictive, data-driven operations. Most facilities management organizations stagnate not because they lack effort, but because they lack a framework to assess where they are and decide what to fix next. By applying continuous improvement to facility management alongside a formal FM maturity assessment, teams can systematically close capability gaps in work order execution, preventive maintenance compliance, and asset reliability. The result is lower downtime, tighter cost control, and demonstrable service excellence — and a platform like Start Free Trial makes it possible to operationalize that framework from day one.
FM SERVICE MATURITY GUIDE
Where does your facility operation sit on the maturity curve — and what is it costing you to stay there?
Over 60% of FM teams remain stuck in reactive or scheduled-planned stages, losing an average of $50K–$120K annually per site to unplanned downtime, overtime, and premature asset replacement. Moving up one maturity tier typically cuts maintenance costs 15–25% within the first year. The path starts with knowing exactly where you are today.
FACILITY SERVICE MATURITY MODEL
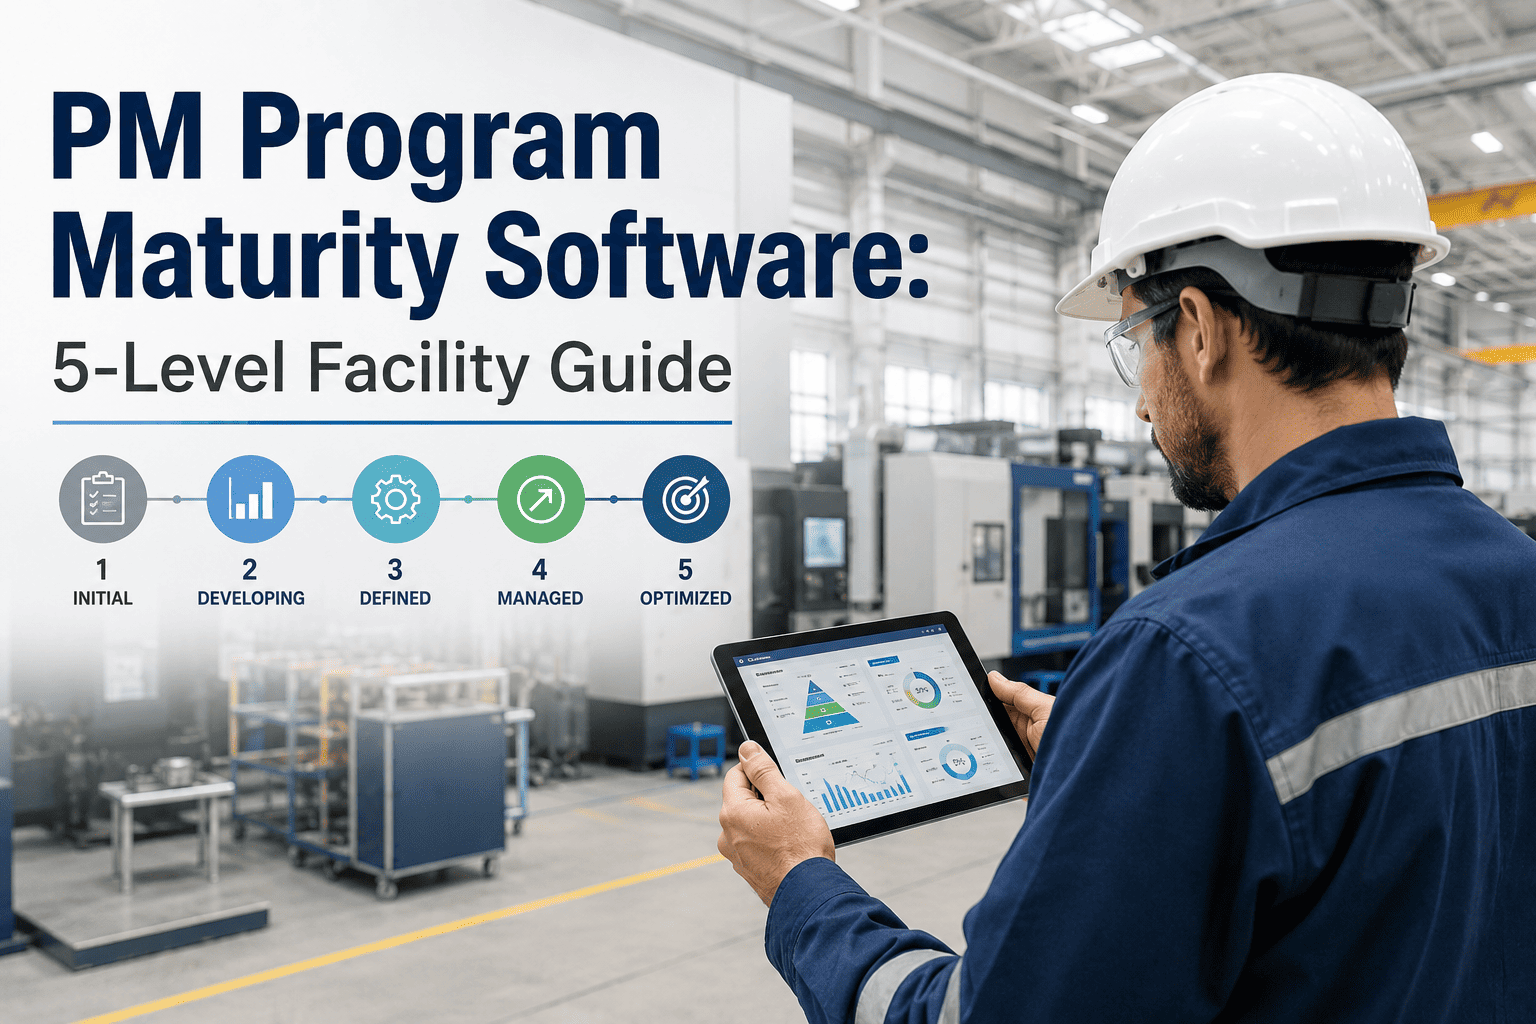
The 4-stage FM maturity model: from reactive to predictive
A facility service maturity model gives you a diagnostic yardstick. Most FM organizations can be placed into one of four stages based on how work is triggered, tracked, and analyzed — and each stage carries a predictable cost and risk profile.
Reactive
Break-fix culture. Work is triggered by complaints and failures. Paper logs or spreadsheets. No PM schedule compliance tracking. MTBF is unknown.
Planned
Basic CMMS in place. Scheduled PMs exist but compliance hovers around 50–65%. Work orders are digital but not yet optimized. Spare parts tracked manually.
Managed
PM compliance exceeds 85%. KPIs like MTBF, MTTR, and OEE are tracked. Inventory is tied to assets. Continuous improvement rituals are formalized quarterly.
Predictive
AI-driven condition monitoring predicts failures before they happen. PM compliance 95%+. Work is auto-generated from sensor data and degradation models. CI is weekly and data-led.
A 180-asset manufacturing facility spending $42K/yr on maintenance was assessed at Stage 1 (Reactive). After implementing a structured FM improvement program with OxMaint, the team reached Stage 3 (Managed) in 7 months: PM compliance rose from 38% to 91%, unplanned downtime dropped 34%, and emergency work orders fell from 60% of volume to under 15% — saving an estimated $28,500 in the first year alone.
CONTINUOUS IMPROVEMENT FRAMEWORK
How to build an FM continuous improvement program that actually moves the needle
Facility continuous improvement fails when it is treated as a slogan instead of a system. The CI framework below — adapted from Lean, TPM, and ISO 55000 principles — turns FM process improvement into a repeatable cycle tied to measurable outcomes.
Run a baseline FM maturity assessment
Audit 6 domains: work order management, PM program, asset registry, spare parts inventory, data quality, and analytics maturity. Score each 1–4. The composite score is your starting point and your benchmark for every future improvement cycle.
Target the highest-leverage gaps first
Use a Pareto analysis on downtime hours and maintenance cost by asset. Typically 20% of assets drive 70% of cost. Focus the first CI cycle on those assets — not on every asset at once. Quick wins build momentum and free budget for deeper changes.
Implement targeted FM process improvements
Roll out specific changes: digitize remaining paper work orders, build PM checklists for top-failure assets, set min/max on critical spares, establish a weekly KPI review. Each change is scoped to be completable in 4–6 weeks with a defined before/after metric.
Quantify impact against baseline KPIs
Compare PM compliance, MTBF, MTTR, unplanned downtime hours, and maintenance cost as % of asset replacement value against the Month 1 baseline. Document what worked, what did not, and which gains are sustainable without constant oversight.
Lock in gains and begin the next cycle
Codify successful changes into standard operating procedures. Update the maturity scorecard. Select the next improvement focus area. This cadence — assess, prioritize, execute, measure, standardize — is what separates FM operational maturity from ad-hoc firefighting.
CI IMPACT FORMULA
The maintenance maturity ROI formula
Use this formula to estimate the annual financial impact of moving your FM operation up one maturity tier. It captures both hard savings (reduced downtime, labor, parts) and soft savings (extended asset life, reduced compliance risk).
Facilities moving from reactive to managed maturity typically cut unplanned downtime by a third within 12 months.
Teams digitizing PM schedules and tracking compliance in a CMMS see compliance roughly double — from ~45% to 90%+.
Managed/predictive FM operations spend $0.08–$0.11 less per sq ft on maintenance than reactive peers, per industry benchmarks.
With a structured CI program and the right CMMS, most FM teams move up one maturity stage in 6–9 months.
HOW OXMAINT HELPS
How OxMaint accelerates your FM service improvement journey
OxMaint is an AI-powered CMMS and EAM platform designed to close the gap between where your FM operation is today and where it needs to be. Each capability maps directly to a maturity-stage barrier — so you are not just tracking work, you are systematically advancing up the curve.
Digital work order management
Eliminate paper work orders and spreadsheet tracking. OxMaint captures every request, assignment, completion, and feedback in a single audit-ready system — the foundational step for moving from Stage 1 to Stage 2.
Preventive maintenance automation
Build, schedule, and auto-assign PMs by asset, calendar, or meter reading. Real-time compliance dashboards show which PMs are overdue and which assets are trending toward failure — the engine behind Stage 2 to Stage 3 advancement.
Predictive maintenance with AI
OxMaint's AI models analyze asset history, vibration, temperature, and usage patterns to predict failures before they happen — auto-generating work orders when degradation thresholds are crossed. This is the defining capability of Stage 4 maturity.
Maintenance analytics & KPI dashboards
Live MTBF, MTTR, OEE, PM compliance, and cost-per-asset dashboards eliminate manual reporting. Built-in maturity scorecards let you benchmark progress monthly — making continuous improvement facility management a data-driven discipline, not a guess.
FM MATURITY ASSESSMENT CHECKLIST
Quick self-assessment: where is your FM operation today?
Run this 8-point facility service maturity assessment on your own operation. If you cannot confidently answer "yes" to six or more, you are likely at Stage 1 or Stage 2 — and leaving significant savings on the table.
See exactly where your operation sits — and get a roadmap to the next tier
Book a 30-minute demo and our team will walk you through an FM maturity assessment on your own asset data, showing you precisely which OxMaint capabilities will move you up the curve fastest.
FREQUENTLY ASKED QUESTIONS
FM continuous improvement & maturity model: common questions
Real answers to the questions maintenance and reliability leaders ask when evaluating an FM improvement program and maturity framework.
What is an FM maturity model and why does it matter?
An FM maturity model is a 4-stage framework — reactive, planned, managed, and predictive — that benchmarks how mature your facility maintenance operation is across work order management, PM compliance, asset tracking, and analytics. It matters because you cannot improve what you cannot measure: the model tells you exactly where you are, what the next tier looks like, and what capabilities you need to build to get there, turning aspirational operational excellence into a structured improvement roadmap.
How long does it take to move up one maturity tier?
With a structured FM improvement program and the right CMMS in place, most facilities move up one maturity tier in 6–9 months. The first transition — reactive to planned — can happen in as little as 90 days by digitizing work orders and building a basic PM schedule. Moving from managed to predictive takes longer (12–18 months) because it requires sensor integration and historical data depth, but you can accelerate this with OxMaint's AI-driven analytics — book a demo to see how.
What are the biggest cost savings from FM continuous improvement?
The largest savings come from reducing unplanned downtime (typically 30–50% reduction), cutting emergency work orders (60%+ reduction), extending asset life by 20–30% through consistent PM compliance, and reducing overtime by shifting from reactive to planned work. A mid-sized facility (100–250 assets) can expect $45K–$85K in year-one savings when moving from Stage 1 to Stage 2, with additional $20K–$40K gains at each subsequent tier transition.
How is continuous improvement in facility management different from general CI?
Continuous improvement in facility management applies Lean, TPM, and Kaizen principles specifically to asset reliability, work order workflows, PM optimization, and spare parts management — rather than production lines or manufacturing processes. The KPIs are different (MTBF, MTTR, PM compliance, downtime hours) and the improvement cycles are tied to asset performance data and condition monitoring rather than cycle time or defect rate.
Can we implement FM continuous improvement without replacing our current system?
You can begin the assessment and prioritization phases with your current tools, but sustained CI requires a CMMS that captures clean data, automates PM scheduling, and provides real-time KPI dashboards — spreadsheets and paper cannot support the measurement cadence that maturity advancement demands. Most teams find that switching to a purpose-built platform like OxMaint is the single highest-leverage step in their improvement program. You can start a free 14-day trial to pilot it on a subset of assets before committing.
Stop firefighting. Start advancing up the maturity curve.
Every month you stay in reactive mode costs more than a year of OxMaint. Join the FM teams using AI-powered CMMS to drive measurable continuous improvement — cut downtime 30–50%, hit 90%+ PM compliance, and turn maintenance from a cost center into a strategic advantage.
Free 14-day trial · No credit card