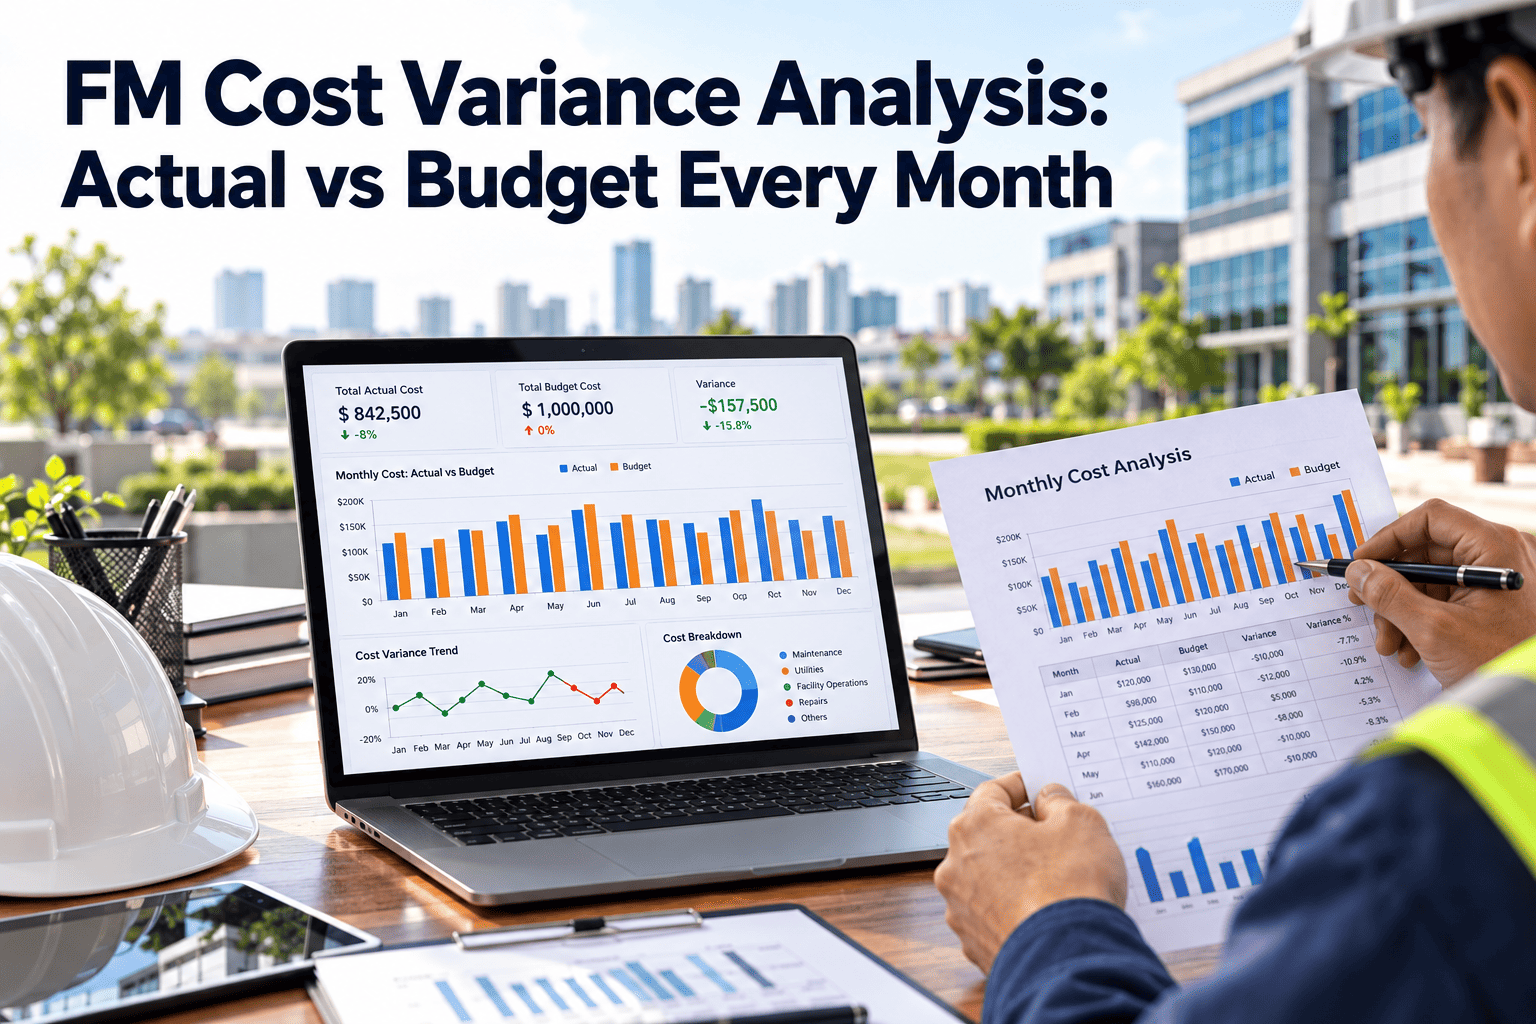
Most facility budgets are not missed in December. They are missed in February, when a snow season, an HVAC repair or a contract escalator pushes one category over plan and nobody reviews it until the quarter closes. Monthly variance analysis compares actual spend with budget by category, explains the gap, and decides what to do while there is still time to act. Pairing those reviews with Oxmaint maintenance management software keeps the work order and cost data behind each variance easy to find.
Commercial FM | Cost per Sq Ft and Benchmarking
FM Cost Variance Analysis: Actual vs Budget Every Month
A monthly review format that shows where facility spend is drifting, why it is drifting, and who owns the correction, category by category.
Illustrative month: budget vs actual by category (sample figures)
Repairs and maintenance
Over plan
Utilities
Under plan
Janitorial
On plan
Grounds and snow
Over plan
Contracted services
On plan
BudgetActual
Why Facility Cost Drift Goes Unnoticed
The year-end miss usually starts early
- Invoices arrive weeks after the work, so spend looks lower than it really is.
- Budgets are set annually but costs are seasonal, so a flat monthly budget hides real timing patterns.
- Reactive repairs are charged to broad lines, so the cause of an overrun is not visible.
- Finance and facilities review different reports, so variances are explained too late.
What a late variance review looks like
Month 1A repair runs over plan. No one flags it.
Month 3The overrun repeats. Quarter close shows a gap.
Month 6Reforecast requested. Corrective options are limited.
Month 12The year-end miss is explained, not prevented.
The Monthly Variance Format
| Column | What it holds | Why it matters |
|---|---|---|
| Category | Repairs, utilities, janitorial, grounds, contracts, projects | Keeps review at the level where someone owns the spend |
| Month budget | Phased budget for the month, not one-twelfth of the annual figure | Reflects seasonal cost patterns |
| Month actual | Invoiced spend plus accrued work completed but not billed | Avoids understating the month |
| Variance amount | Actual minus budget | Shows direction and size of the gap |
| Variance percent | Variance divided by budget | Allows comparison across small and large lines |
| Year-to-date variance | Cumulative actual minus cumulative budget | Shows whether the drift is a blip or a trend |
| Cause and owner | Short explanation, named owner, planned action | Turns the report into decisions |
Four Causes Behind Almost Every Variance
Price
Rates, contract escalators or utility tariffs differ from the budget assumption. The work is the same, the cost is not.
Volume
More or fewer repairs, call-outs, cleanings or kilowatt hours than planned. Usage, not price, moved the number.
Timing
Work or invoices landed in a different month than budgeted. The gap should reverse later in the year.
Scope
Unbudgeted work was approved, or planned work was deferred. This needs a decision, not just an explanation.
Category-Level Review Cadence
Weekly
- Open work orders with estimated cost above a set limit
- Emergency and after-hours repairs logged
- Pending approvals for unbudgeted work
Monthly
- Actual vs budget by category and by property
- Variance cause and owner for every flagged line
- Updated forecast for flagged categories
Quarterly
- Reforecast against annual budget
- Cost per square foot compared across the portfolio
- Review of contracts, rates and deferred projects
Variance Thresholds: When Does a Gap Need Action?
Monitor
Small variance within tolerance. Record the cause, confirm it is timing or volume, and review again next month.
Explain
Variance above the agreed percentage or amount. The category owner provides a written cause, expected duration and corrective plan.
Escalate
Repeated or year-to-date variance with no reversal in sight. Facilities and finance agree on a reforecast, a scope change or a funding request.
Keep Work Order Costs Tied to Every Budget Line
Track labor, parts and vendor work by asset and category so each variance has a source you can open in seconds.
A Worked Example With Round Numbers
| Category | Budget | Actual | Variance | Likely cause and next step |
|---|---|---|---|---|
| Repairs and maintenance | $40,000 | $48,000 | +$8,000 (20%) | Volume: rooftop unit failures. Review PM status and plan replacement. |
| Utilities | $45,000 | $42,000 | -$3,000 (7%) | Timing: mild weather. Hold the forecast, review next month. |
| Grounds and snow | $20,000 | $35,000 | +$15,000 (75%) | Volume: heavy season. Confirm contract terms and reforecast. |
| Janitorial | $30,000 | $31,000 | +$1,000 (3%) | Within tolerance. Monitor only. |
Common Variance Reporting Mistakes
Reports that only describe
- Totals only, with no category or property detail
- Annual budget divided evenly across twelve months
- Variance shown without a cause or owner
- Accruals ignored, so actuals look low
Reports that drive decisions
- Category and property views with year-to-date trend
- Phased budget that follows seasonal patterns
- Cause classified as price, volume, timing or scope
- Accrued work included, with a named action owner
The Monthly Review Meeting in Six Steps
- Close the month early with accruals included, and circulate the variance sheet before the meeting.
- Sort categories by variance amount and review only those beyond the agreed threshold.
- For each flagged line, confirm the cause class and whether the gap should reverse or persist.
- Check the work orders behind large variances for repeat failures, emergency premiums or scope creep.
- Agree corrective actions, owners and dates, and update the forecast for affected categories.
- Record decisions so the next review starts with open items rather than a blank page.
How Oxmaint Supports Variance Analysis
- Work order management records labor, parts and vendor costs against each job, so spend can be traced to its source.
- Asset management shows repair history by equipment, helping explain volume-driven overruns.
- Preventive maintenance scheduling reduces emergency repairs that push repair lines over plan.
- Reporting and dashboards summarize cost and work order activity by property, category and period.
- Inventory tracking helps explain parts spend and avoids rush purchases.
- Vendor and contractor jobs stay linked to work orders for cleaner accruals and invoice checks.
Frequently Asked Questions
What is FM cost variance analysis?
It compares actual facility spend with budget by category, explains the difference and assigns action. Oxmaint helps by keeping work order costs tied to assets.
How often should variance be reviewed?
Review open commitments weekly, full category variance monthly and reforecast quarterly. Monthly is the minimum for catching drift early.
What threshold should trigger an explanation?
Set both a percentage and a dollar limit, because a large percentage on a small line may not matter. Agree the numbers with finance.
How do work orders help explain variance?
They show which assets, vendors and failure types drove the spend. You can book a demo to see cost tracking by work order.
Should accruals be included in monthly actuals?
Yes. Completed work that has not been invoiced still belongs in the month, or variance will look better than it is.
Catch Facility Cost Drift While You Can Still Correct It
Connect work orders, asset history and cost data so every monthly variance review starts with answers instead of questions.