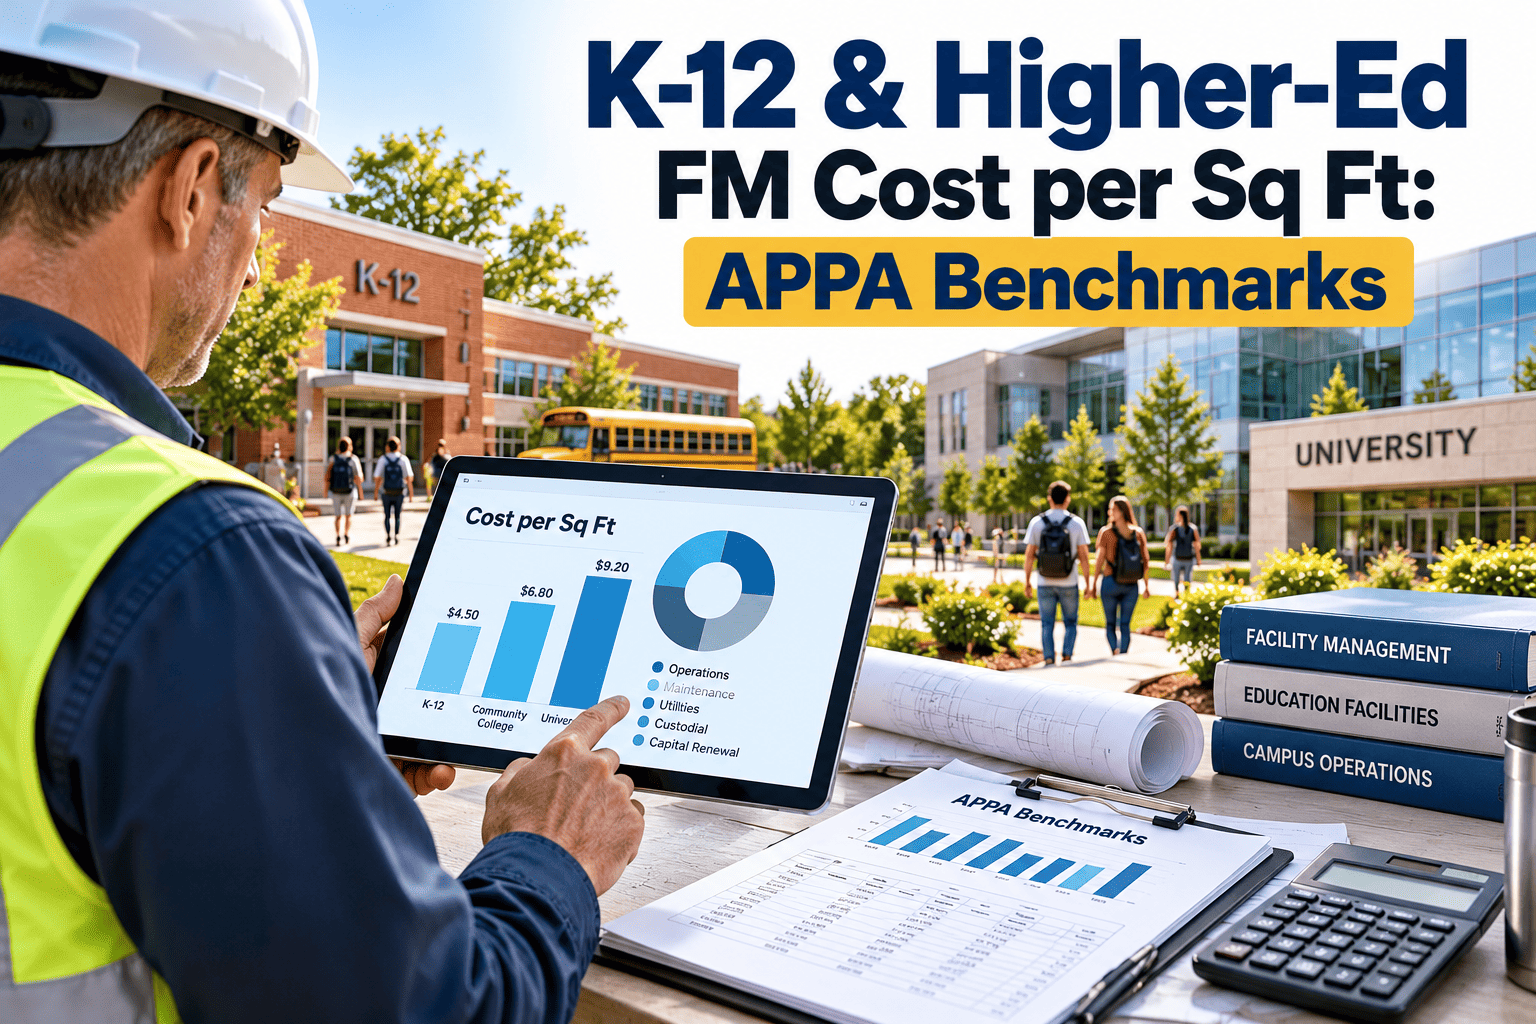
Facilities leaders on school and campus teams get asked the same question every budget cycle: what should facilities management cost per square foot, and are we in range? The honest answer depends on what the number includes, which building types sit behind it and which service level the institution has chosen to fund. Published sources define cost per square foot differently, so a K-12 figure, a university figure and an APPA benchmark often cannot be compared directly. This guide lays out what the sources actually say, where the commonly cited ranges come from and how to test them against your own data, using a clear maintenance management platform as the record system behind the number.
K-12 and Higher-Ed FM Cost per Sq Ft: What the APPA Benchmarks Show
Education facilities teams are measured on one ratio, yet the ratio hides scope, age and service-level choices. Learn how to read APPA-style benchmarks, compare K-12 and campus portfolios fairly and use preventive maintenance and centralized work-order dispatch to move your own cost per square foot in the right direction.
The Benchmark Ruler: Where Published Figures Sit
One scale, $0 to $15 per square foot, different scopes
Every bar below is plotted on the same $0 to $15 scale. Read the label first: a bar that includes utilities is not the same measurement as a bar that excludes them.
What We Could and Could Not Verify
Found in sources
- APPA defines AFOE, Annual Facilities Operating Expenditure, as the cost of operating and maintaining facilities excluding purchased utilities and any capital expense.
- In an APPA Facilities Management article using the 2017-18 FPI database, all participants averaged about $5.55 per GSF, up from $5.00 in 2014-15.
- The same article showed seven large public research peers at $6.63 to $10.34 per GSF once purchased utilities were added to operating cost.
- The 2025 State of Our Schools report places K-12 maintenance and operations spend between $5.00 per gross sq ft in Utah and $14.77 in New York.
Not verified
- A K-12 range of $2 to $5 per sq ft. It sits below the state-level spending in the 2025 report and close to older American School and University style medians, so treat it as a commonly cited range, not a current norm.
- A higher-ed range of $4 to $9. It overlaps the APPA operating-cost average and the utility-inclusive research peers, but we found no APPA source that states this exact band.
- Any current published APPA median by Carnegie class. FPI detail is gated behind participation or access fees, so we do not quote numbers we could not read.
How to use the ranges responsibly
Use $2 to $5 for K-12 and $4 to $9 for higher education only as commonly cited starting points, then validate them against your own institution data and, where available, your APPA FPI peer group report. The difference between a stated range and a defensible target is almost always scope, so write the scope next to every number you present to a board.
K-12 vs Higher-Ed: Why the Comparison Is Not Like for Like
The two sectors share a vocabulary, but their portfolios behave differently. The table below summarizes the structural differences that explain why a single number cannot serve both.
| Dimension | K-12 districts | Higher education campuses |
|---|---|---|
| Commonly cited range (to validate) | $2 to $5 per sq ft | $4 to $9 per sq ft |
| Best-documented current source found | State of Our Schools 2025: $5.00 to $14.77 M&O spend per gross sq ft by state | APPA FPI: about $5.55 per GSF average operating cost, 2017-18 |
| Portfolio shape | Many similar buildings spread across a district, often one to three levels | Mixed portfolio: classrooms, labs, residence halls, athletics, libraries, central plants |
| Space intensity | Daytime occupancy, long summer and holiday breaks | Extended hours, residential 24/7 use and research spaces with tight environmental control |
| Typical cost pressure | Aging buildings, thin staffing, deferred maintenance, regional wage and utility differences | Lab and research mechanical intensity, central plant operation, service-level expectations |
| Cost definition risk | Surveys often fold in utilities, custodial and sometimes contracted services | APPA AFOE excludes utilities and capital; other sources add them back |
| Staffing model | Mix of in-house trades and contracted services, with limited specialists | Shops by trade, zone or building cluster, often with central dispatch |
Read the sector gap carefully
A higher-ed number looking larger than a K-12 number does not prove campuses overspend. Labs, residence halls and central plants carry more systems per square foot, and school districts often run lean with deferred work waiting behind the number. The 2025 report even frames the K-12 M&O gap as a shortfall of $5.01 per gross sq ft against recommended levels.
What Cost per Square Foot Actually Includes
APPA describes its Facilities Performance Indicators as peer-comparable data on custodial, maintenance, grounds, utilities and administration. A fair benchmark starts by agreeing which of those are in your numerator.
Maintenance
Labor, benefits, parts, materials and contracts needed to maintain buildings, as APPA describes the maintenance line.
Custodial
Cleaning labor, supplies and equipment. It carries a large share of K-12 spend, because cleaning scales with occupied space.
Grounds
Mowing, athletic fields, irrigation, snow removal and paving upkeep. Acreage, not building area, drives it.
Utilities
Purchased energy, water and waste. APPA AFOE leaves these out, so keep them as a separate line.
Administration
Supervision, planning, work-order coordination and facilities leadership overhead.
Capital
APPA AFOE does not include capital expenses. Keep renewal projects and deferred backlog in a separate ledger.
Why the historical category mix still helps
Older American School and University data from 2007-08 split the K-12 median total of $4.56 per sq ft into custodial at $1.61, maintenance at $0.53, grounds at $0.22 and utilities-related lines separately. The dollars are dated, but the lesson holds: custodial and payroll dominated, and maintenance alone was a small slice.
APPA Levels of Service: The Hidden Variable
Two campuses can spend very different amounts per square foot and both be efficient, because they funded different service levels. APPA publishes five levels for custodial, maintenance and grounds.
Showpiece Facility
Equipment is excellent, calls are answered immediately and upgrades keep pace with modern standards.
Comprehensive Stewardship
Equipment usually works, calls are handled promptly and updates are regular.
Managed Care
Occasional breakdowns occur, response times are inconsistent and upgrades do not fully offset wear.
Reactive Management
Equipment often fails, response is slow and wear outpaces repairs.
Crisis Response
Equipment routinely fails and deterioration goes unchecked.
Custodial and grounds use the same five-step idea
APPA custodial levels run from Orderly at Level 1 through Ordinary, Casual and Moderate to Unkempt Neglect at Level 5. Grounds levels step from daily-attention public spaces down to minimum care for severely budget-constrained sites, with mowing, litter and inspection frequency easing at each step.
The APPA research-peer example
In the APPA example of seven large public research peers, the institution with the lowest maintenance spend of $1.16 per GSF reported maintenance service Level 4, while peers spending $1.71 to $3.61 reported Level 3. That is the pattern to expect: a lower number can mean efficiency, or it can mean reactive operation.
Cost Drivers That Move the Number
Most variance between institutions traces back to a short list of drivers. Each is something you can measure, and several can be managed.
Building age and condition
APPA has long linked rising maintenance cost to aging college facilities. Its 1999-2000 comparative report noted that about 78 percent of campus buildings were built before 1980, and maintenance rose from 23 to 33 percent of operating costs between 1994 and 2000.
Climate and regional costs
Heating and cooling load, snow removal, labor markets and utility rates differ by region. The 2025 K-12 report cites utilities, labor, and the condition and age of infrastructure as contributors to state spread.
Deferred maintenance
Low current spend can reflect postponed work. The same report estimates a nearly $90 billion K-12 gap, including $34 billion in maintenance and operations.
Chosen service level
A Level 2 maintenance promise costs more than a Level 4 reality. Decide the level per building type, then budget to it.
In-house vs contracted delivery
Contracted work moves cost between payroll and contract lines. Compare total cost, not the line where it lands.
Space mix and intensity
Labs, kitchens, pools, residence halls and central plants carry more equipment per square foot than classroom blocks.
Three Levers That Lower Cost Without Lowering Service
Top-tier institutions do not win by cutting service levels. They reduce the cost of delivering a given level by trading emergency work for planned work and by running the operation as one system.
Preventive and predictive maintenance
Planned work on boilers, air handlers, chillers, roofs and life-safety systems costs less than a failure during a school day or exam week. Condition readings let teams act before a breakdown, not after it.
- Recurring PM schedules by asset and season
- Inspection findings turned into work orders
- Condition-based triggers for critical equipment
Centralized operations and dispatch
One request intake and one dispatch queue stops duplicated trips, lost calls and unmanaged backlog. Central visibility lets a supervisor balance crews across buildings, not within a single shop.
- Single intake for requests and emergencies
- Priority rules and response targets
- Backlog and aging reports per building
Standardization
Standard equipment, parts, task lists and asset naming shrink stock, speed repairs and make buildings comparable. A district with thirty similar schools gains most from a repeatable template.
- Common asset register and naming
- Reusable PM task lists
- Shared critical-spares inventory
Where a CMMS fits
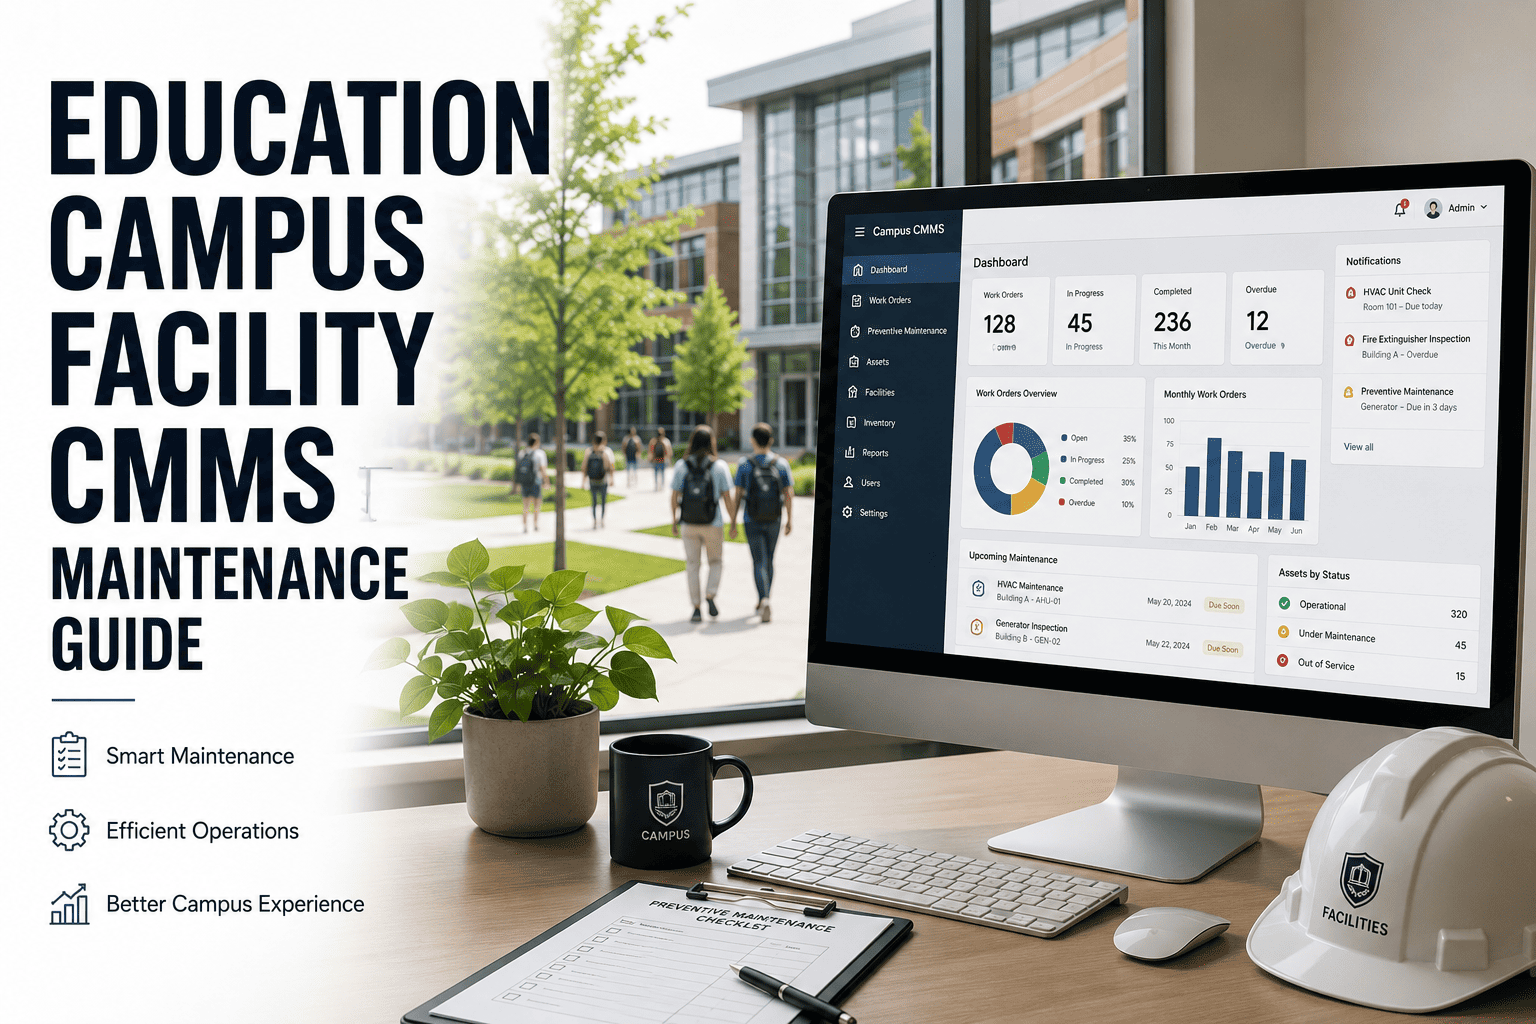
Oxmaint maintenance management software supports these levers with work orders, PM scheduling, an asset register, inventory, mobile workflows and reporting dashboards. It does not change the benchmark itself, but it gives you the records that make your number credible and show which lever is worth pulling first.
Put Your Own Cost per Square Foot on One Dashboard
Bring work orders, preventive maintenance and asset records into one system so your benchmark comparison starts from numbers you trust.
How to Normalize Your Own Cost per Sq Ft
Before you compare against anyone, rebuild your number on a defined scope. Follow these steps in order.
Fix the denominator
Use gross square feet from a single, current space inventory. Note owned, leased and unoccupied space separately.
Choose the cost scope
Decide whether you report APPA-style operating cost without utilities, or an all-in M&O figure with utilities. State it in writing.
Pull the numerator by category
Total maintenance, custodial, grounds and administration from the ledger, including labor, benefits, materials and contracts.
Remove capital and one-offs
Take out renewal projects, disaster recovery and grant-funded upgrades so they do not distort the run rate.
Divide and split
Compute total cost divided by GSF, then each category by GSF. Keep the split, because it shows where you differ from peers.
Record the service level
Note your current APPA level per category, then compare to peers of similar age, climate, size and space mix.
Data-Readiness Checklist
A benchmark is only as good as the records behind it. Confirm each item before you present a number.
Space inventory
Current GSF by building, type and ownership status.
Asset register
Major equipment listed by building with install date and criticality.
Labor capture
Work orders carry hours, craft and building for every job.
Material capture
Parts issued against work orders, tied to inventory records.
Contract spend
Vendor invoices mapped to buildings and cost categories.
PM vs reactive mix
Planned and unplanned work identified on every order.
Backlog ledger
Open and deferred work with age, risk and estimated cost.
Service-level tags
APPA level recorded by building type and category.
Utility data
Energy and water billing mapped to buildings, kept separate.
Turning Benchmark Gaps into a Maintenance Plan
Once the number is normalized, the gap to peers becomes a diagnostic prompt. These are the questions to ask, each paired with the records that answer it.
| If your number looks | Ask this | Records that answer it |
|---|---|---|
| Lower than peers | Is the gap efficiency, or is work being deferred under a Level 3 or 4 service level? | Backlog ledger, overdue PMs, emergency work share |
| Higher than peers | Is it scope, age, service level or avoidable reactive work? | Cost by category, asset age, planned vs unplanned hours |
| Rising each year | Is aging equipment moving from maintenance into replacement territory? | Repeat repairs per asset, asset condition, replacement forecast |
| Varies widely by building | Is standardization or dispatch coverage uneven? | Cost per building, response times, technician travel |
| Flat but complaints rise | Has service level slipped while spend held steady? | Request aging, repeat requests, satisfaction feedback |
Present the story, not just the ratio
Boards respond to a clear narrative: here is our scope, here is our service level, here is what the peer data implies and here is the plan. Backlog and risk make the case for funding more convincingly than a lone dollar figure.
Frequently Asked Questions
Is $2 to $5 per sq ft a reliable K-12 facilities cost?
Treat it as a commonly cited range, not a verified norm. The 2025 State of Our Schools report found state M&O spend from $5.00 to $14.77 per gross sq ft, so validate against your own data using a work order and asset system.
What does the APPA operating cost per GSF include?
APPA AFOE covers the cost of operating and maintaining facilities, excluding purchased utilities and capital expenses. Its FPI covers custodial, maintenance, grounds, utilities and administration as functional areas.
What are the APPA levels of service?
APPA defines five levels for maintenance, custodial and grounds. Maintenance runs from Showpiece Facility at Level 1 to Crisis Response at Level 5, and a lower dollar figure often reflects a lower level.
How does preventive maintenance reduce cost per sq ft?
It shifts work from emergency repair to scheduled tasks, so fewer failures interrupt classes and fewer costly rush jobs occur. You can book a demo to see PM scheduling and reporting in practice.
Can a CMMS prove whether we are inside the benchmark?
It supplies the labor, material and asset records that make your numerator and service-level evidence defensible. The comparison itself still depends on matching scope and peer group.
Know Your Real Cost per Square Foot
Capture labor, materials, PM compliance and backlog in one maintenance system, so every benchmark conversation starts from your own verified data.