The regional mall director receives three calls before 9 AM: anchor tenant threatening lease penalty over HVAC failure in their flagship store, food court operator documenting 4-hour response to grease trap overflow, and security contractor disputing response time calculations for weekend incidents. Each caller references different SLA terms, escalation procedures, and penalty clauses—none of which align with actual service delivery records scattered across email threads, paper logs and vendor spreadsheets.
Malls operate complex ecosystems where hard services (HVAC, electrical, plumbing, fire safety, elevators) and soft services (cleaning, security, landscaping, pest control, waste management) must perform seamlessly across 200,000+ square feet serving thousands of daily visitors. Without structured SLA frameworks and digital tracking, service failures become disputes, disputes become penalties, and penalties erode vendor relationships essential for operational excellence.
This troubleshooting handbook establishes comprehensive SLA design frameworks for mall facility management, integrating AI analytics and mobile inspections facility management to transform reactive service delivery into measurable, audit-ready performance. Malls implementing structured SLA programs with preventive maintenance facility management achieve 60-80% reduction in tenant complaints while cutting vendor dispute resolution time by 75%. Teams ready to standardize service agreements can sign up free to track SLA compliance and vendor performance.
What if every service request had clear response times, automatic escalations, and audit-ready documentation—eliminating tenant disputes before they start?
Understanding Hard vs. Soft Services in Mall Operations
Effective SLA design requires clear categorization of services by criticality, response requirements, and measurement methods. Hard services maintain building infrastructure and life safety systems; soft services ensure occupant experience and operational cleanliness. Each category demands distinct SLA structures, vendor qualifications, and performance metrics.
Transform Facility Management Reliability Using AI + IoT Data
SLA response tiers establish clear expectations for every service category, enabling consistent vendor performance measurement and automated escalation when thresholds breach. AI analytics transform raw response data into actionable insights, identifying patterns that predict SLA failures before they impact tenants.
SLA Response Tier Framework
SLA Metrics by Service Category
| Service Category | Response Time | Resolution Time | Uptime Target | Key Metrics |
|---|---|---|---|---|
| HVAC Systems | 30 min (emergency) | 4 hours standard | 99% | Temperature variance, energy efficiency, PM compliance |
| Electrical/Lighting | 15 min (safety) | 2 hours standard | 99.5% | Outage duration, lamp replacement rate, energy consumption |
| Plumbing | 30 min (flooding) | 4 hours standard | 98% | Leak response, drain clearance, fixture availability |
| Elevators/Escalators | 15 min (entrapment) | 2 hours mechanical | 99% | Availability, callback rate, entrapment incidents |
| Janitorial | 30 min (spills) | Immediate-ongoing | 95% | Inspection scores, restroom checks, complaint rate |
| Security | 5 min (emergency) | Varies by incident | 99.9% | Response time, patrol completion, incident resolution |
| Landscaping | 24 hours | Per schedule | 90% | Appearance scores, irrigation efficiency, seasonal compliance |
| Pest Control | 4 hours (active) | 24-48 hours | Zero tolerance | Sighting reports, treatment effectiveness, prevention compliance |
Troubleshooting Decision Framework
When SLA breaches occur, systematic troubleshooting identifies root causes and prevents recurrence. This decision framework guides facility teams through issue classification, escalation triggers, and resolution documentation per facility management CMMS best practices.
Tier 1 Emergency — Immediate vendor dispatch, management notification, incident documentation initiated
Proceed to impact assessment — Evaluate tenant effect, system scope, and time sensitivity
Tier 2 Urgent — Priority dispatch, SLA clock starts, stakeholder communication required
Tier 3-4 — Standard work order creation, scheduled response per SLA terms
Document all timestamps: report time, dispatch time, arrival time, resolution time. Attach photos, technician notes, and parts used. Close work order with tenant verification when applicable.
Common SLA Failures and Resolutions
Symptom: Vendor claims 30-minute response; tenant reports 2-hour wait
Root Cause: Manual logging, unclear "response" definition (dispatch vs. arrival)
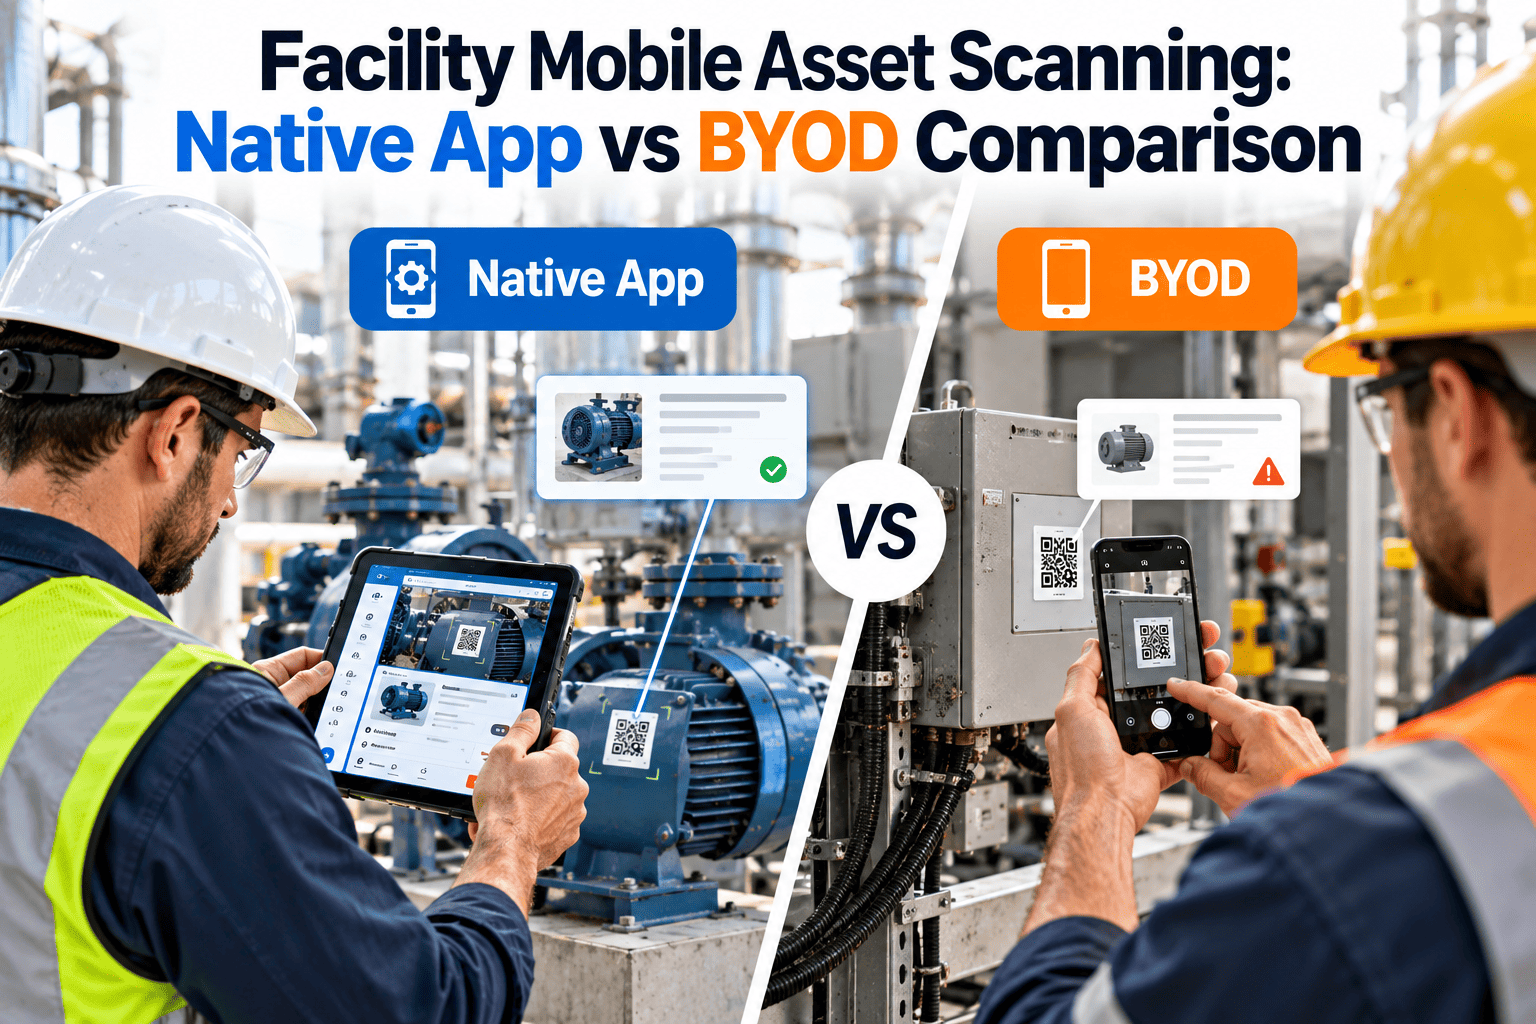
Resolution: Implement barcode/QR check-in at arrival, GPS-verified dispatch, digital timestamps
Symptom: Same tenant reports temperature issues weekly despite "resolved" work orders
Root Cause: Treating symptoms not causes, inadequate PM compliance
Resolution: Require root cause documentation, link to predictive maintenance facility management triggers
Symptom: Weekend/holiday incidents exceed SLA by 200-400%
Root Cause: Unclear on-call procedures, understaffed coverage, communication delays
Resolution: Define explicit after-hours SLAs, automated escalation paths, on-call verification
Symptom: Restroom complaints spike despite staffing levels met
Root Cause: No objective quality metrics, inspection gaps, staff rotation issues
Resolution: Mobile inspections with photo documentation, randomized audits, performance scorecards
Making Audits Painless — A Facility Management Action Plan with Digital Logs
Compliance logs and audit trail documentation prove SLA performance during lease negotiations, vendor reviews, and regulatory inspections. Digital systems eliminate manual record-keeping while creating searchable, tamper-proof documentation per facility management compliance requirements.
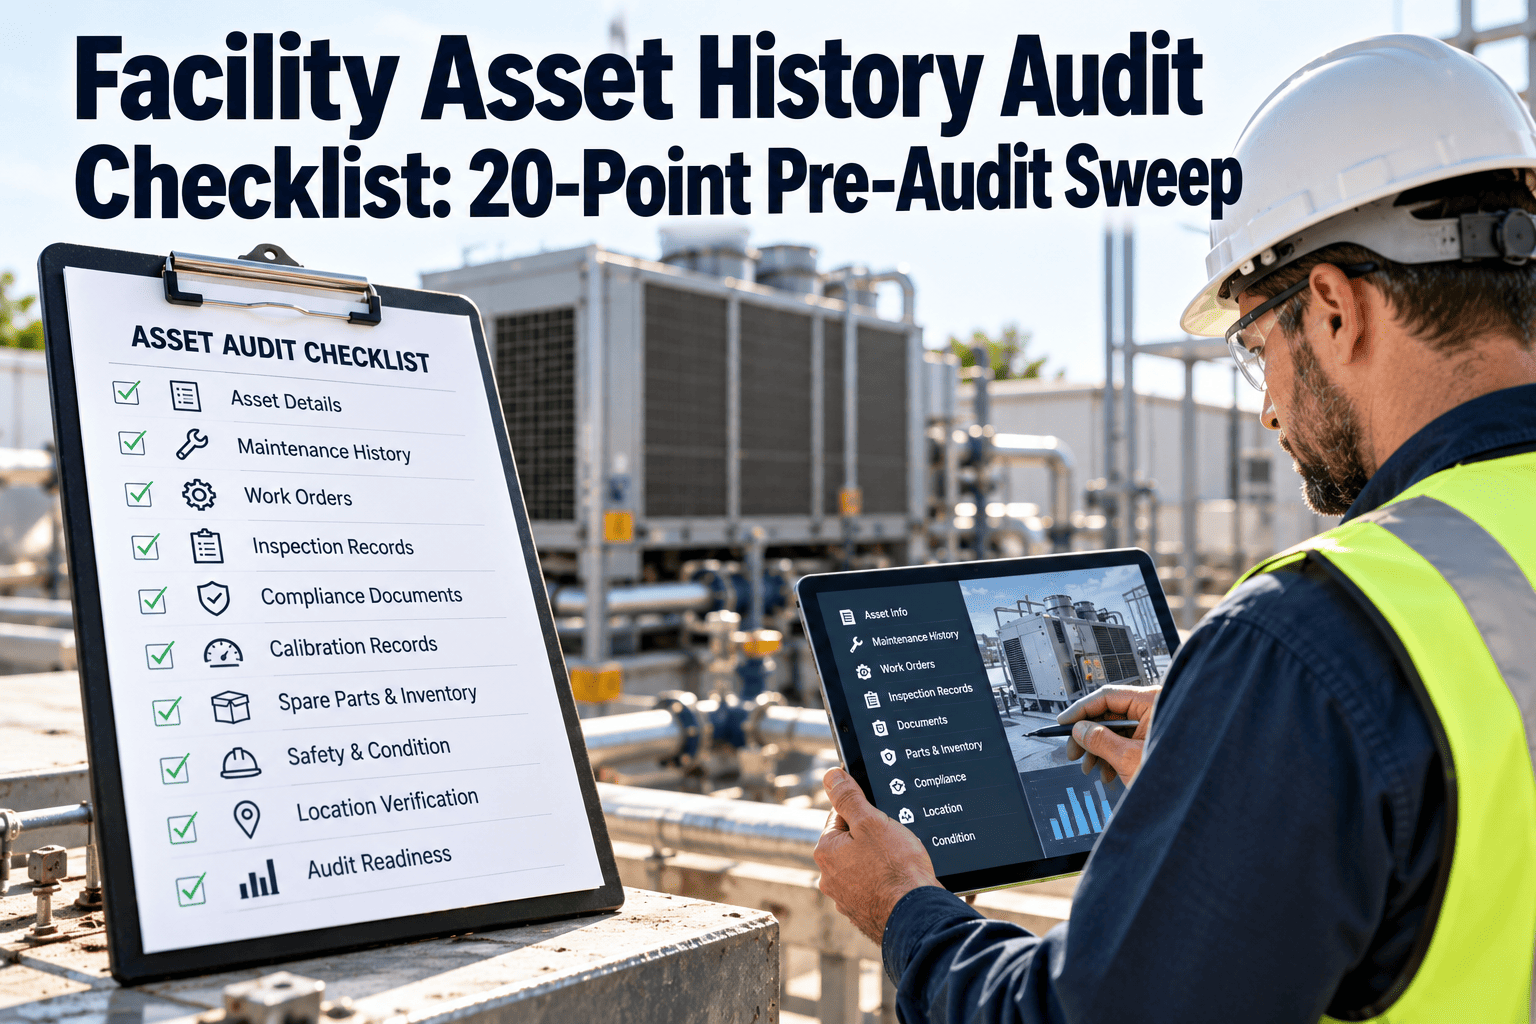
SLA Audit Documentation Checklist
Vendor Performance Scorecard
Monthly Vendor Evaluation Framework
| Performance Category | Weight | Excellent (90-100) | Acceptable (70-89) | Needs Improvement (<70) |
|---|---|---|---|---|
| Response Time Compliance | 30% | 95%+ within SLA | 85-94% within SLA | Below 85% |
| Resolution Quality | 25% | <5% callback rate | 5-10% callback rate | >10% callback rate |
| Documentation Completeness | 20% | 100% with photos | 90-99% complete | Below 90% |
| PM Schedule Adherence | 15% | 98%+ on schedule | 90-97% on schedule | Below 90% |
| Safety & Compliance | 10% | Zero incidents | Minor issues only | Any serious violation |
KPI Dashboard
Percentage of work orders resolved within defined SLA timeframes
Mean time from request to vendor arrival by priority tier
Service-related complaints per 100,000 sq ft
Work orders resolved without callback within 30 days
Scheduled preventive maintenance tasks completed on time
Weighted average across all vendor scorecards
Implementation Roadmap
Catalog all hard and soft services, current vendors, and existing contract terms
Define response tiers, resolution targets, and penalty structures by service category
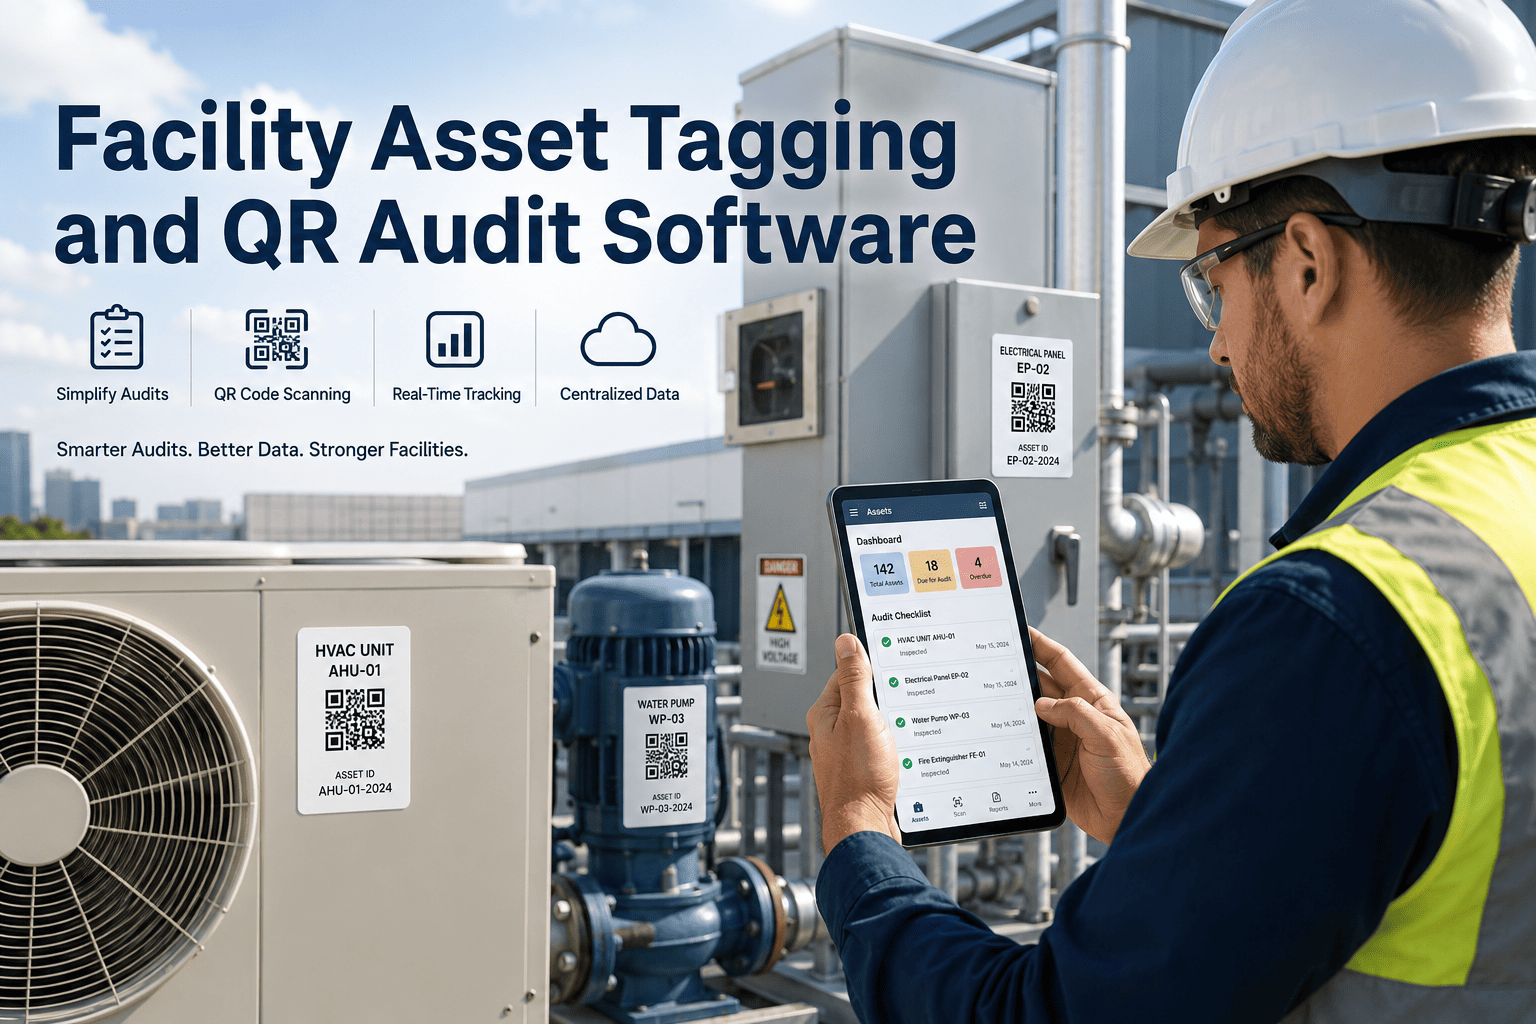
Configure asset tracking facility management with barcode/QR identification for all equipment
Train vendors on digital work orders, mobile check-in, and documentation requirements
Collect 60-90 days of performance data to establish benchmarks and identify gaps
Monthly scorecard reviews, SLA adjustments, and multi-site rollouts across portfolio
ROI Summary — 500,000 Sq Ft Regional Mall
Stop losing money to SLA disputes and tenant complaints. Start measuring what matters with digital service tracking.