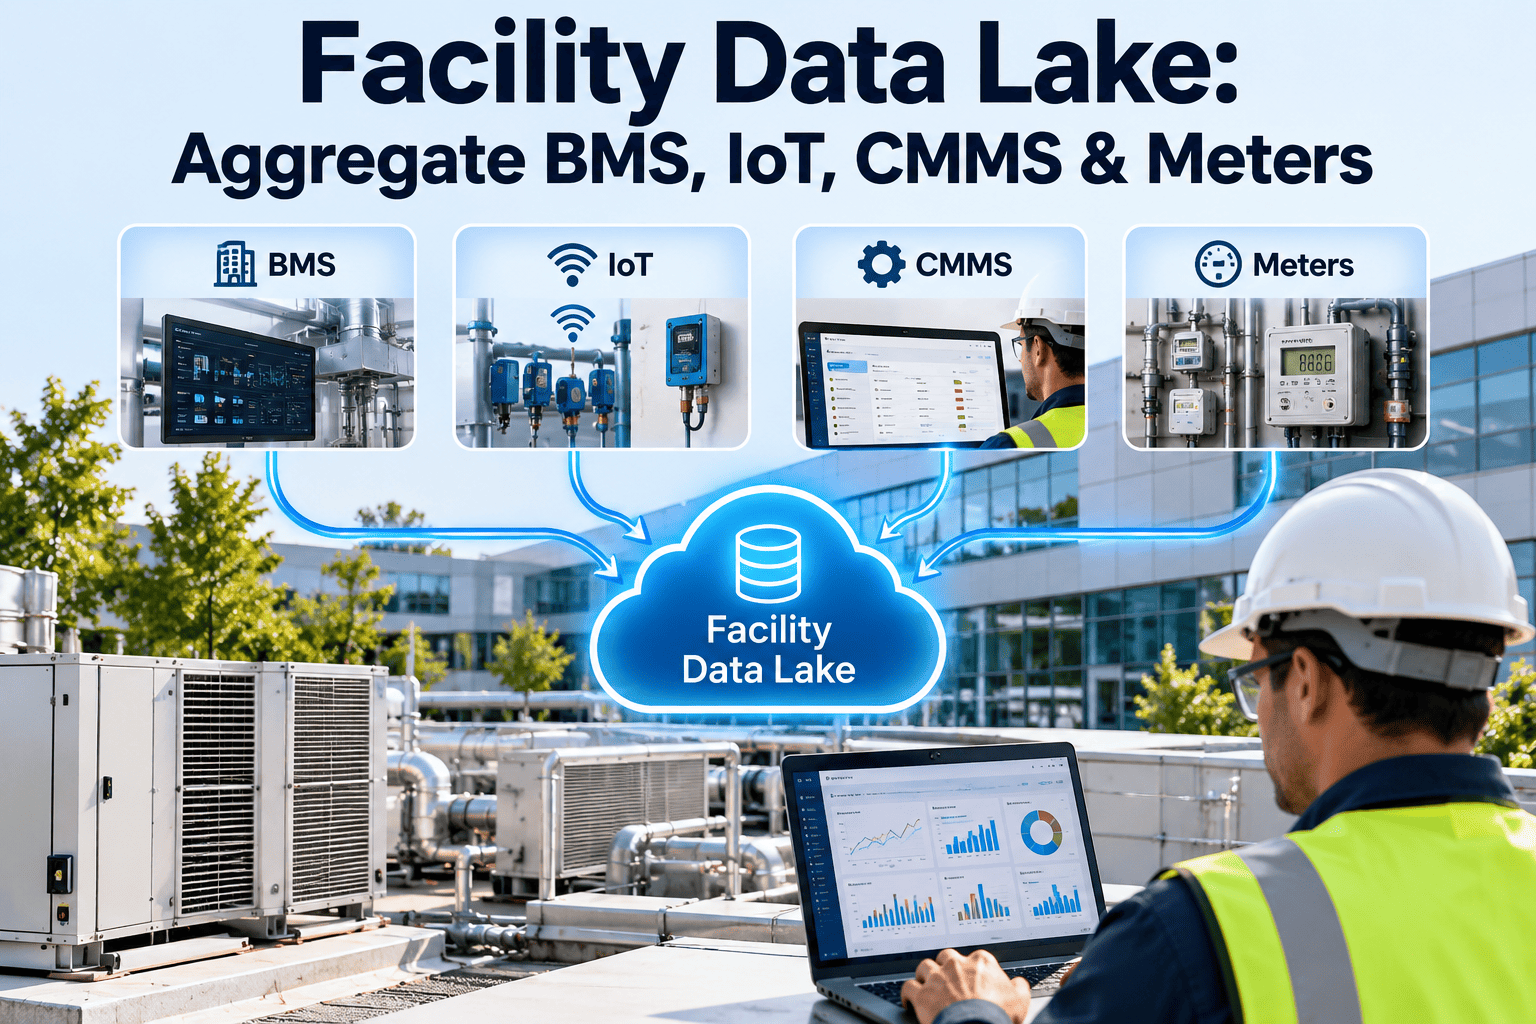
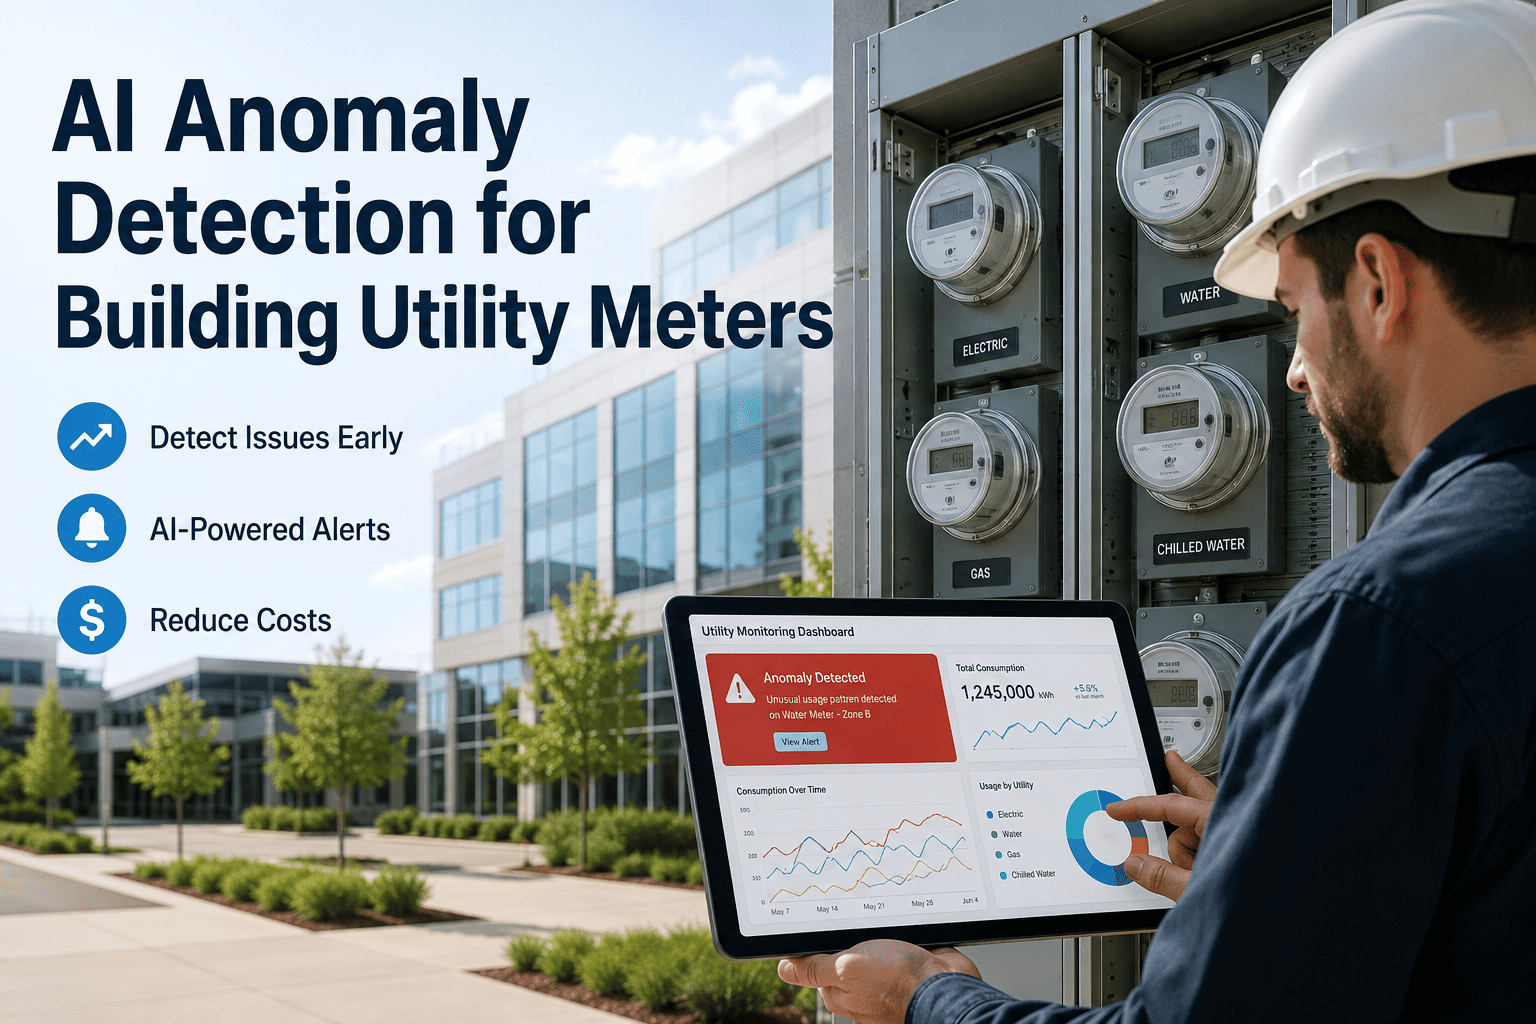
A single utility bill tells a facility team that the building used 480,000 kWh last month — and nothing else. It does not say whether the chiller plant, the server room, or a floor of vacant offices drove that number, so every energy conversation starts with a guess instead of a fact. Sub-metering breaks that one number into dozens of measured streams, one per system, floor, or tenant, and turns "our utility spend went up" into "the west chiller is running 30% longer cycles than its twin." Facilities that install sub-metering typically recover the investment within 18 to 30 months purely from waste that a single building meter could never have shown them. OxMaint's utility analytics module ingests sub-meter data directly and flags abnormal consumption before it shows up on next month's invoice.
Energy Intelligence · Facility Management
Sub-Metering and Utility Data Granularity
One building meter hides every problem inside it. Sub-metering shows exactly which system, floor, or tenant is driving the bill.
18–30 mo
Typical payback period on a sub-metering program
10–20%
Energy waste commonly hidden inside whole-building bills
4 levels
Typical metering hierarchy from utility main to end system
The Metering Hierarchy
Granularity is a design choice, not an accident. Each layer below the utility main isolates a smaller and more actionable slice of consumption.
Level 1
Utility Main Meter
Whole-building total. What the utility company bills — and the only number most facilities ever see.
Level 2
Building / Zone Meters
Splits consumption across multiple buildings or major zones within one campus or site.
Level 3
Floor / Tenant Meters
Enables accurate tenant billing and isolates which floor is driving off-hours consumption.
Level 4
System / Equipment Meters
Chillers, air handlers, and server rooms metered individually to catch equipment-level drift.
Level 5
Circuit / Panel Meters
The finest granularity, used for high-value loads like data racks or medical equipment where every circuit needs its own audit trail.
Where Sub-Metering Pays Off Fastest
Not every system needs its own meter on day one. These are the use cases that recover the cost of installation soonest.
Central Plant Optimization
Isolates which chiller or boiler is running inefficiently against its rated performance curve.
Tenant Cost Recovery
Replaces estimated square-footage billing with measured consumption tenants cannot dispute.
After-Hours Waste Detection
Flags equipment still running at full load outside scheduled operating hours.
Capital Planning Evidence
Rising baseline consumption on a single system builds the business case for early replacement.
Before and After Granular Metering
The same building, the same equipment — but a completely different ability to act on what the data shows.
Without Sub-Metering
One number per month, 30 days after the fact
No way to isolate which system is wasting energy
Tenant billing based on estimated square footage
Equipment drift goes unnoticed for months
Capital requests backed only by age, not performance data
Sustainability reporting relies on rough estimates
With Sub-Metering
Hourly or daily data per system, floor, or tenant
Abnormal consumption flagged within days, not months
Tenant billing based on actual measured usage
Equipment drift caught before it becomes a failure
Capital requests backed by measured performance decline
Sustainability reporting built on verified metered data
Implementation Path
Sub-metering programs succeed or fail based on where meters get placed first, not on how sophisticated the analytics platform is.
1
Consumption Audit
Identify the highest-cost systems and zones as first candidates for metering, using existing utility bills as the starting baseline.
2
Meter Selection
Match meter type — electric, thermal, water — to each system's utility type and required reporting interval.
3
Installation
Meters wired into panels and equipment with minimal operational downtime, scheduled around occupied hours where needed.
4
System Integration
Meter data streamed into the CMMS for real-time visibility, alongside the asset and work order history for that system.
5
Analytics & Alerts
Baseline consumption established per system, with automatic flags the moment a reading drifts outside its normal range.
6
Ongoing Review
Quarterly review of consumption trends to catch slow equipment degradation that single alerts would miss.
Expert Review
Every facility director I have worked with already believes they have an energy waste problem somewhere — they just cannot point to it. A single utility bill is a monthly average of hundreds of decisions made by dozens of pieces of equipment, and averages hide exactly the outliers you need to find. The first sub-meter installation almost always pays for itself by exposing one piece of equipment that has been running wrong for years without anyone noticing.
Priya Nair, CEM — Certified energy manager, 15 years in commercial building energy programs
Stop guessing which system is driving the bill. OxMaint ingests sub-meter data automatically and flags abnormal consumption before it becomes next month's invoice surprise.
Frequently Asked Questions
Where should we install the first sub-meters if budget is limited?
Start with the highest-cost systems identified in a consumption audit — usually central plant equipment and any 24/7 loads like server rooms.
Book a demo to prioritise your first meters.
Can sub-meter data feed directly into tenant billing?
Yes, once floor or tenant-level meters are in place, billing can move from estimated square footage to actual measured consumption.
Sign up free to set up measured tenant billing.
How quickly does abnormal consumption get flagged?
Once a baseline is established, deviations are typically flagged within days rather than waiting for the next monthly utility bill to reveal the problem.
Do sub-meters require a separate software platform to view data?
No, meter data streams directly into the CMMS alongside work orders and asset records, so consumption trends sit next to the equipment history that explains them.
Start free to see unified consumption and asset data.
What is a realistic payback period for a sub-metering investment?
Most programs pay back within 18 to 30 months through identified waste alone, before accounting for improved tenant billing accuracy or maintenance planning benefits.
Turn One Monthly Number Into Actionable Data
Sub-meter data streamed straight into your CMMS with automatic alerts the moment consumption drifts from baseline.