Real-Time Facility Energy Anomaly Work Orders

By Lewis Abbott on June 7, 2026

real-time-facility-energy-anomaly-work-orders

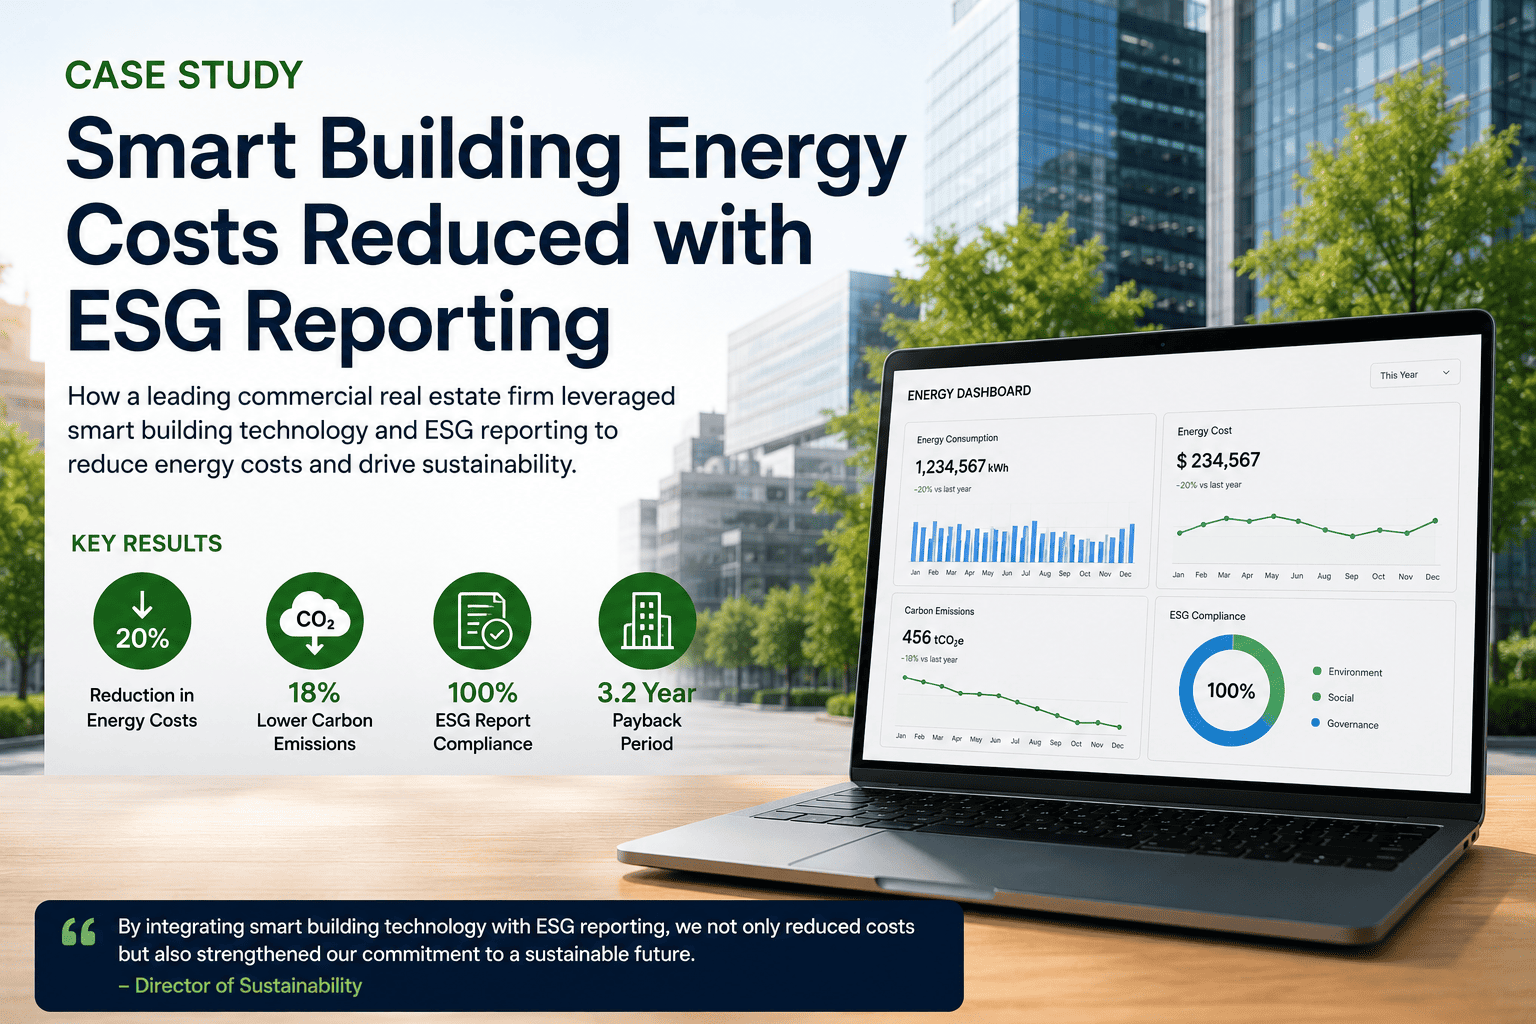
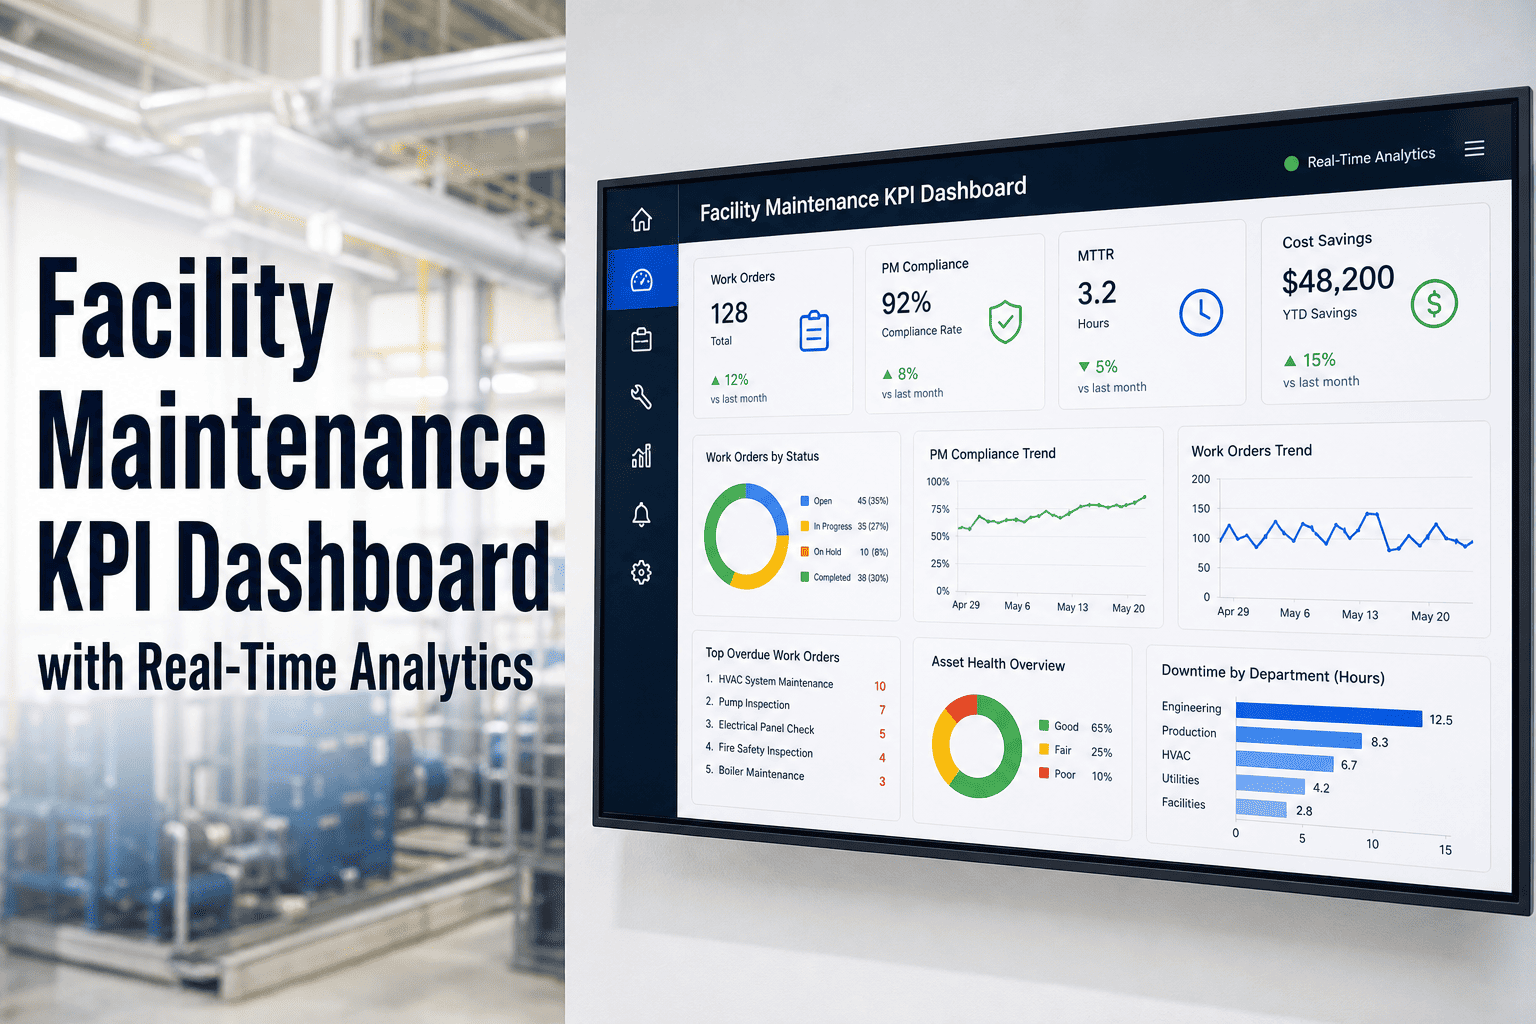
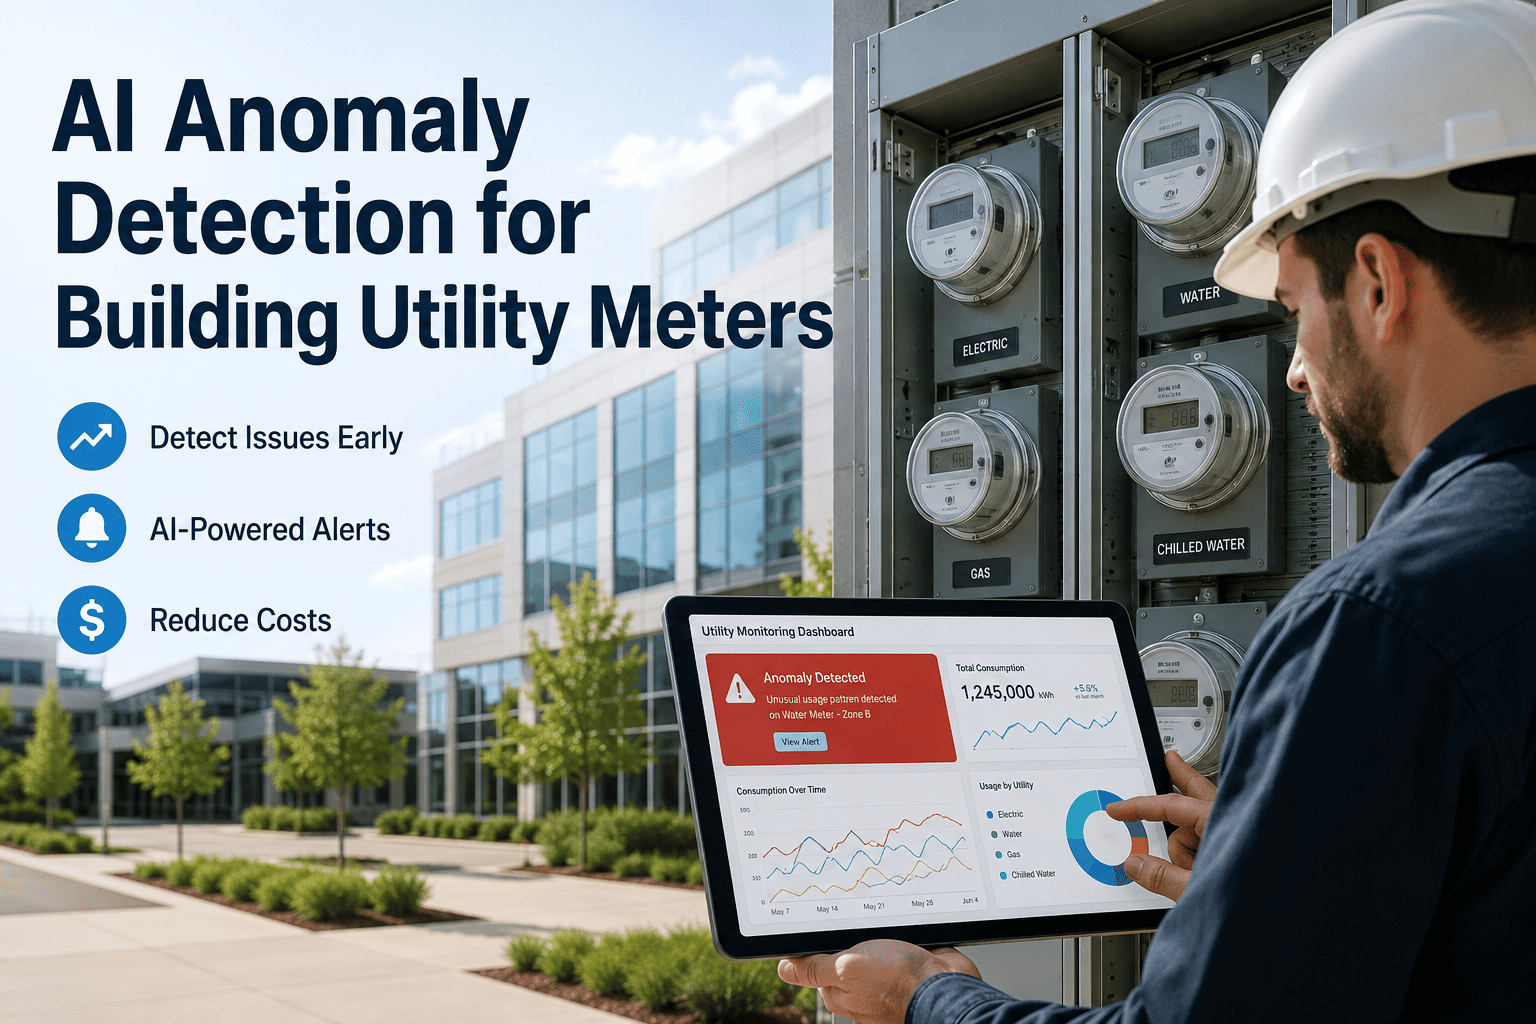
Energy waste in commercial facilities rarely announces itself — it accumulates quietly in off-hours consumption spikes, sub-meter drift, and equipment inefficiency until it shows up as a utility bill surprise. OxMaint AI detects energy anomalies the moment they occur, assigns corrective work orders automatically, and builds a savings audit trail your operations team can actually stand behind.

Analytics & Reporting

Stop Discovering Energy Waste on the Utility Bill

Buildings that rely on monthly bills to detect energy problems are always 30 days behind. OxMaint monitors consumption in real time, flags anomalies within minutes of occurrence, and generates corrective work orders before waste compounds into a significant cost event.

Live Anomaly Feed
Tower A — Floor 6
HVAC off-hours draw
+34%
WO Created
Annex B — Lighting
Unoccupied zone active
+18%
Scheduled PM
Chiller Plant — Main
COP degradation pattern
+41%
Urgent WO

7 Energy Anomaly Types OxMaint Detects and Acts On

Each anomaly type has a defined detection threshold, a default work order template, and a savings tracking rule attached.

01
Off-Hours Consumption Spike
HVAC, lighting, or plug loads drawing more than 30% above baseline during unoccupied hours — typically indicating scheduling errors, equipment left running, or sensor failure.
Avg. waste: $180/event/day
02
Chiller or Boiler Efficiency Drop
COP or efficiency ratio falling more than 12% below seasonal baseline, indicating fouling, refrigerant loss, or mechanical wear that increases energy consumption per ton of cooling.
Avg. waste: $320/day per unit
03
Sub-Meter to Main Meter Gap
Unexplained difference of more than 5% between sub-meter totals and the main meter, indicating metering errors, untracked loads, or an unlisted circuit drawing power.
Avg. billing error: $2,400/year
04
Peak Demand Creep
15-minute interval peak demand trending upward over three consecutive billing cycles, increasing demand charge exposure even when total consumption remains stable.
Demand charges: 30-50% of bill
05
Lighting Zone Occupancy Mismatch
Lighting circuits active in zones that sensors and booking systems indicate are unoccupied — a common source of 8 to 15% lighting energy waste in office and mixed-use buildings.
Avg. savings when corrected: 11%
06
Power Factor Degradation
Power factor falling below 0.90 sustained over 48 hours, indicating reactive power waste from aging motors, degraded capacitors, or VFD faults — driving utility penalty charges.
Utility penalty risk: 5-12%
07
Simultaneous Heating and Cooling
HVAC zones where both heating and cooling systems are active concurrently — a well-known control fault that can account for 10 to 20% of HVAC energy waste in large commercial buildings.
HVAC waste: up to 20%

Energy Anomaly Detection ROI — Real Data

Measured savings outcomes from OxMaint deployments across commercial office, healthcare, and mixed-use facility types.

Facility Type Annual Waste Before Detected by OxMaint Corrected via WO Annual Savings
250,000 sq ft Office Tower $91,000 est. $74,000 81% $60,000
Regional Hospital (3 buildings) $210,000 est. $168,000 79% $133,000
University Campus (12 buildings) $380,000 est. $310,000 76% $236,000
Industrial Facility — 180,000 sq ft $140,000 est. $112,000 83% $93,000
OxMaint AI — Energy Analytics Platform

Every day an energy anomaly goes undetected is money your facility budget cannot recover. OxMaint finds it in minutes and sends the right person to fix it.

Expert Perspective


The single most common mistake facility teams make in energy management is treating anomaly detection as a reporting function. They wait for the monthly energy report to identify a problem, and by the time it appears in a chart, four weeks of waste have already been billed. The teams that genuinely reduce their energy costs are the ones that close the loop in real time — detect the anomaly, generate the work order, fix the root cause, and document the savings in the same workflow. That closed-loop process is what separates a building with 15% energy waste from one with 3%.

Energy Manager, LEED AP
Commercial Building Energy Optimization — 17 Years Experience

Frequently Asked Questions

OxMaint connects to smart meters, sub-meters, and utility AMI data via Modbus, BACnet, and direct utility API integrations including Green Button Connect. The platform also supports manual interval data uploads in CSV format for facilities with legacy metering infrastructure. Anomaly detection becomes active after a 14-day baseline period that establishes occupancy-adjusted consumption patterns by hour, day type, and season. Book a demo to map your current metering infrastructure against OxMaint's energy data ingestion capabilities.
Every corrective work order generated from an energy anomaly includes a pre-repair and post-repair consumption comparison period. OxMaint aggregates these comparisons into a savings register that shows cumulative energy avoided (kWh), cost avoidance ($), and estimated carbon reduction (kgCO2e) by building, system type, and time period. This register exports in formats compatible with ENERGY STAR Portfolio Manager, GRI reporting, and standard ESG frameworks. Start your free trial to preview the savings documentation dashboard.
OxMaint's portfolio energy dashboard provides a cross-building anomaly view ranked by estimated waste impact, with drill-down to individual building, system, and meter level. Portfolio managers can set anomaly alert thresholds by dollar impact or percentage deviation, and configure escalation rules that notify regional managers when anomalies exceed defined cost thresholds. Building-level energy performance is benchmarked against portfolio average and equivalent-use building baselines. Book a demo to see multi-building energy analytics in action.
Yes. Each OxMaint energy anomaly work order includes the affected system or zone, the anomaly type and threshold exceeded, a 7-day consumption trend chart for the anomalous meter or circuit, the asset's service history, and a pre-populated investigation checklist based on the most likely root causes for that anomaly type. Technicians can resolve most energy anomalies using only the work order information without logging into a separate BMS or energy management system. Start your free trial to inspect a sample energy anomaly work order template.
OxMaint AI — Facility Energy Intelligence

Real-time anomaly detection. Automatic work orders. Documented savings. OxMaint closes the loop between energy data and maintenance action.

Energy anomaly detection across all building systems. Multi-building portfolio view. ESG-ready savings documentation.

Share This Story, Choose Your Platform!