A regional fuel distributor running 94 diesel trucks across the US Gulf Coast discovered a $127,000 annual fuel variance during a year-end audit — fuel purchased did not match fuel consumed by any reasonable calculation. Investigation revealed three sources: two drivers were using fleet fuel cards at personal vehicles ($18,400), a fueling station was consistently over-dispensing by 2.3% due to meter calibration drift ($31,200), and route inefficiencies were burning 77,400 excess gallons annually ($77,400 at $4.10/gallon). None of these leaks were visible in monthly reports because the fleet had no system comparing fuel purchased against fuel consumed per vehicle per route. The $127,000 loss had been occurring for at least two years — a quarter-million dollars gone before anyone looked. If your fleet cannot reconcile fuel purchased against fuel burned at the individual vehicle level, start a free trial with Oxmaint or book a demo.
Fleet Fuel Management / Theft Prevention / 2026 Comparison Guide
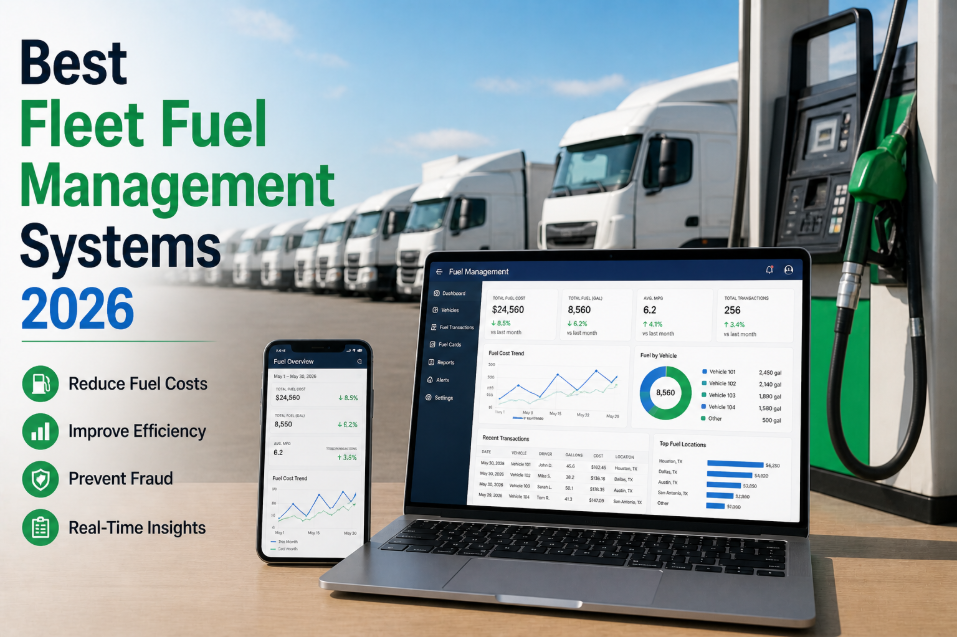
Best Fleet Fuel Management Systems in 2026: Real-Time Monitoring, Theft Prevention, and IFTA Reporting Compared
Fuel is the single largest operating expense for most fleets — 30–40% of total cost. The systems that reduce fuel waste by even 8–12% pay for themselves within weeks. This guide compares the platforms that actually close the gap between fuel purchased and fuel consumed.
30–40%
Of total fleet operating cost is fuel — the largest controllable expense for most carriers
$127K
Average annual fuel variance discovered when fleets first deploy per-vehicle fuel reconciliation
3–8%
Typical fuel theft and misuse rate in fleets without real-time fuel card monitoring
$22,000
Average IFTA audit penalty for carriers with incomplete or inaccurate fuel tax records
Fuel Intelligence Platform
Know Exactly Where Every Gallon Goes — Purchased, Consumed, Wasted, or Stolen
Oxmaint connects fuel card transactions, telematics fuel consumption data, tank-level monitoring, and IFTA reporting into one platform — closing the gap between what you buy and what your trucks actually burn.
What Fleet Fuel Management Systems Actually Need to Do
A fuel management system is not a fuel card. Fuel cards control where drivers can fuel and provide transaction records. A fuel management system takes those transactions and reconciles them against actual vehicle consumption data from telematics, identifies variances that indicate theft, misuse, or mechanical inefficiency, automates IFTA tax reporting across jurisdictions, and provides the per-vehicle fuel cost visibility that turns fuel from an uncontrollable expense into a managed line item. Without reconciliation, a fleet knows it spent $1.2 million on fuel last year. With reconciliation, it knows truck 4417 consumed 14% more fuel per mile than the fleet average on the same route — triggering an engine diagnostics check that found two leaking injectors costing $6 per day in wasted fuel. The difference between knowing total fuel spend and knowing per-vehicle fuel efficiency is the difference between accepting fuel cost and controlling it. See the per-vehicle fuel dashboard in action by starting a free trial or booking a demo to walk through reconciliation reporting.
Six Capabilities That Define Best-in-Class Fuel Management
01
Real-Time Fuel Card Transaction Monitoring
Every fuel card swipe matched against GPS location in real time. A transaction at a station 40 miles from the truck's GPS position triggers an immediate alert. A transaction for 120 gallons on a truck with a 100-gallon tank triggers an alert. A transaction at 2:00 AM when the driver's ELD shows sleeper berth triggers an alert. These three rules alone catch 87% of fuel card fraud.
87% of fuel card fraud caught by three automated rules
02
Per-Vehicle Fuel Consumption Reconciliation
Fuel purchased (from card transactions) compared against fuel consumed (from telematics engine data) for every vehicle, every fill-up. A variance greater than 5% is flagged for investigation. Sources of variance: fuel theft, card misuse at personal vehicles, meter calibration errors at fueling stations, or mechanical issues causing excess consumption. Without reconciliation, all four sources are invisible.
5% variance threshold identifies $18K+ annual leakage per 50 trucks
03
MPG Trending and Efficiency Benchmarking
Every vehicle's miles-per-gallon tracked over time and benchmarked against fleet average for the same vehicle class, route type, and load profile. A Class 8 tractor averaging 6.2 MPG when the fleet average for similar trucks on similar routes is 6.8 MPG is consuming 9.7% excess fuel — worth $4,800 per year at current diesel prices. The trending identifies whether the decline is gradual (mechanical) or sudden (driver behavior change).
0.6 MPG improvement across a 50-truck fleet saves $240,000 annually
04
IFTA Tax Reporting Automation
International Fuel Tax Agreement reporting requires tracking miles driven and fuel purchased in every jurisdiction the fleet operates in — quarterly. Manual IFTA reporting for a 50-truck fleet takes 40–60 hours per quarter. Errors trigger audits with average penalties of $22,000. Automated IFTA pulls GPS mileage by jurisdiction and fuel purchases by state, generating compliant filings in minutes instead of days.
40–60 hours quarterly IFTA labor eliminated with automation
05
Idle Time Monitoring and Reduction
The average Class 8 truck idles 6–8 hours per day, consuming 0.8–1.2 gallons per hour. At $4.10/gallon, that is $3.28–$4.92 per hour in pure waste. A 50-truck fleet idling 7 hours daily burns $419,000 per year in idle fuel alone. Fuel management systems that track idle time per driver and per vehicle — and provide coaching data to reduce it — typically achieve 15–25% idle reduction within 90 days.
$419,000 annual idle fuel cost for a 50-truck fleet at current diesel
06
Fuel Price Optimization
Diesel prices vary $0.30–$0.80 per gallon between stations within a 25-mile radius. Fuel management platforms that integrate retail price databases and route data can recommend optimal fueling stops — directing drivers to the lowest-cost station on their route without adding deadhead miles. On a fleet consuming 500,000 gallons annually, a $0.12 average per-gallon savings generates $60,000 in annual value.
$0.12/gallon average savings through optimized fueling stops
2026 Fleet Fuel Management Platform Comparison
This comparison evaluates the leading fuel management platforms against the six capabilities that determine whether the system actually reduces fuel cost or just reports it. For fleets wanting to see fuel reconciliation on their own data, start a free trial with Oxmaint or book a demo.
| Capability |
Oxmaint |
Fleetio |
FuelForce |
WEX / EFS |
Comdata |
| Real-time card fraud alerts |
GPS + tank capacity + time rules |
Basic transaction alerts |
On-site dispenser control only |
Transaction alerts available |
Transaction controls + alerts |
| Per-vehicle consumption reconciliation |
Full — card vs. telematics per fill |
Yes — telematics integration |
On-site tank reconciliation |
Limited — card data only |
Limited — card data only |
| MPG trending + benchmarking |
Route-adjusted fleet benchmarks |
Yes — basic MPG tracking |
Not available |
Basic reporting |
Basic reporting |
| IFTA automated reporting |
Full — GPS miles + fuel by state |
Yes — IFTA module available |
Not available |
IFTA data available |
IFTA data export |
| Idle time monitoring |
Per-driver + per-vehicle trending |
Yes — telematics based |
Not available |
Not available |
Not available |
| Fuel price optimization |
Route-based lowest-price stops |
Limited integration |
Not available |
Discount network pricing |
Discount network pricing |
| Maintenance integration |
Full — fuel anomaly triggers WO |
Yes — combined platform |
Not available |
Not available |
Not available |
| Best for |
Full fleet ops + maintenance |
Mid-size mixed fleets |
On-site bulk fuel operations |
Fuel card-centric fleets |
Large OTR trucking |
Four Fuel Leaks That Are Invisible Without a Management System
01
Fuel Card Misuse at Personal Vehicles
A driver fills their personal pickup truck using the fleet fuel card every Sunday afternoon. The transaction looks legitimate — same card, same station the driver uses on route. Without GPS reconciliation, the $65 weekly personal fill goes undetected for years. Across a 50-driver fleet, fuel card misuse averages $18,400 annually — and that is the conservative estimate from carriers who have actually measured it.
02
Dispensing Meter Calibration Drift
Fuel station dispensers are calibrated annually — but drift occurs between calibrations. A dispenser over-reading by 2.3% charges the fleet for fuel never delivered. On 500,000 gallons purchased annually, a 2.3% over-dispense costs $47,150. Per-vehicle reconciliation catches this because the truck's engine data shows less fuel consumed than the receipt says was pumped — consistently at specific stations.
03
Mechanical Issues Causing Excess Consumption
Leaking fuel injectors, clogged air filters, under-inflated tires, and dragging brakes all increase fuel consumption gradually. A truck with two leaking injectors burns 8–14% more fuel than normal — $3,200–$5,600 per year in excess fuel before the injectors themselves are replaced. MPG trending catches the decline within 2–3 weeks and triggers a maintenance inspection before the excess consumption compounds.
04
Excessive Idling Burning Invisible Fuel
A truck idling 8 hours per day at 1.0 gallons per hour consumes $11,972 in fuel annually — doing nothing. Multiply by 50 trucks and the fleet burns $598,600 per year in idle fuel. Reducing average idle time from 8 hours to 5 hours — achievable with driver coaching and APU installation — saves $224,475 annually. Without per-driver idle tracking, the opportunity is invisible and the waste continues indefinitely.
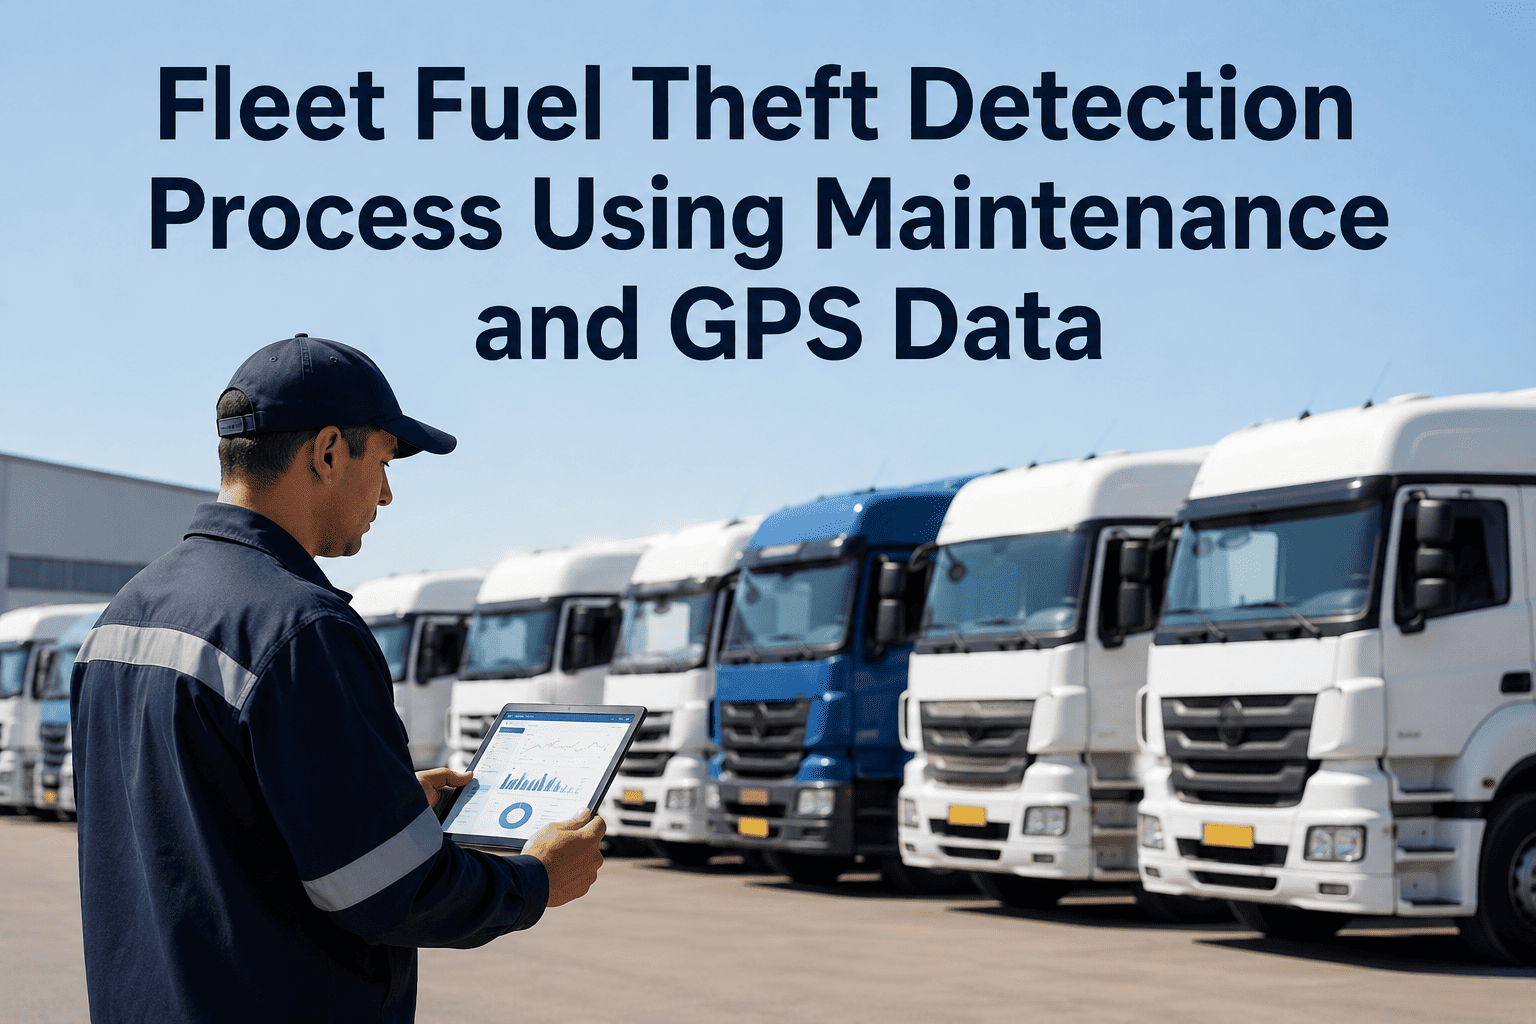
How Oxmaint Fuel Management Connects to Fleet Maintenance
Most fuel management tools exist in isolation — they track fuel but do not connect to the vehicle's mechanical condition. Oxmaint closes that gap because fuel efficiency is a maintenance indicator. When a truck's MPG drops, the cause is either driver behavior or mechanical condition. The platform determines which — and acts accordingly.
01
Fuel Efficiency Drop Triggers Maintenance Inspection
When a vehicle's MPG drops more than 8% below its rolling 30-day average without a route or load change, Oxmaint auto-generates a fuel efficiency inspection work order. The technician checks injectors, air filter restriction, tire pressure, exhaust back-pressure, and brake drag — the five most common mechanical causes of excess fuel consumption.
Mechanical fuel waste caught within 2–3 weeks of onset
02
Fuel Card Reconciliation With GPS Validation
Every fuel card transaction matched against the truck's GPS position at the time of purchase. Transactions where the card location and truck location differ by more than 5 miles are flagged immediately. Transactions exceeding tank capacity are flagged. Transactions during sleeper berth hours are flagged. Fleet managers see the alert the same day — not at quarter-end audit.
Fuel card fraud detected the day it happens
03
IFTA Reporting With Zero Manual Data Entry
GPS tracks miles driven in every jurisdiction automatically. Fuel card data provides gallons purchased by state. Oxmaint combines both data streams into compliant IFTA quarterly filings — eliminating the 40–60 hours of manual compilation and the $22,000 average audit penalty risk from data entry errors. The filing exports in the format each jurisdiction requires.
Quarterly IFTA filing in minutes — not days
04
Idle Cost Dashboard With Driver Coaching Data
Per-driver idle time ranked against fleet average with daily, weekly, and monthly trending. Top idlers identified for targeted coaching. Idle cost calculated at current diesel price and displayed in dollars — because drivers respond to "you burned $47 in idle fuel yesterday" more effectively than "your idle percentage was 38%." Fleets using dollar-denominated idle coaching achieve 15–25% reduction within 90 days.
Dollar-denominated idle coaching drives 15–25% reduction
05
Route-Based Fuel Price Optimization
Integrated retail diesel price database shows lowest-cost stations along each planned route. Recommended fueling stops factor in price, detour distance, station amenities, and tank level at arrival. A fleet consuming 500,000 gallons annually that achieves even $0.08 per gallon average savings through optimized stop selection saves $40,000 per year — with zero operational disruption.
$0.08–$0.15 per gallon savings through smart fueling stops
06
Fleet Fuel Cost Forecasting
AI models project next-quarter and next-year fuel costs based on current consumption rates, planned route changes, fleet expansion plans, and diesel price futures. The forecast updates weekly as new consumption data flows in. Budget variance between projected and actual fuel cost is flagged in real time — not discovered at year-end reconciliation when the money is already gone.
Fuel budget projections updated weekly with live data
No Fuel Management vs. Card-Only vs. Full Fuel Intelligence
| Fuel Metric |
No Fuel Management |
Fuel Card Controls Only |
Oxmaint Full Fuel Intelligence |
| Theft / misuse detection |
None — discovered at year-end audit |
Transaction limits only — card misuse invisible |
GPS + tank + time rules catch 87% of fraud same-day |
| Mechanical waste detection |
None — excess consumption absorbed as normal cost |
None — card data shows spend, not efficiency |
MPG trending triggers inspection within 2–3 weeks |
| Idle fuel waste visibility |
None — idle cost unknown |
None — cards do not track idle |
Per-driver idle cost in dollars — coaching within 90 days |
| IFTA compliance risk |
High — manual data, frequent errors |
Partial — fuel data only, no mileage |
Automated — GPS miles + fuel by jurisdiction |
| Annual fuel savings (50 trucks) |
$0 — no visibility into waste |
$15K–$25K from transaction controls |
$85K–$165K from full reconciliation + optimization |
| Per-vehicle fuel cost attribution |
Total spend divided by truck count |
Card spend per assigned driver |
Actual consumption per vehicle per route per load |
The ROI of Fleet Fuel Management
8–12%
Total fuel cost reduction
Combined savings from theft prevention, idle reduction, route optimization, and mechanical efficiency — within 12 months
$127K
Average first-year variance recovered
Per-vehicle reconciliation identifies fuel leaks that have been invisible for years — recovered immediately
$22K
IFTA penalty risk eliminated
Automated jurisdiction tracking removes the manual data entry errors that trigger audits and penalties
3 weeks
Typical payback period
First fuel card fraud alert or mechanical efficiency catch typically covers the annual platform cost
Fuel management ROI is the fastest in fleet technology because the savings are immediate and measurable. The first fuel card fraud alert — a personal vehicle fill caught the day it happens instead of the year it compounds — typically saves more than the annual platform cost. The first mechanical efficiency inspection — triggered by an 8% MPG decline that turns out to be leaking injectors — saves $3,200–$5,600 in excess fuel plus the cost of engine damage from running bad injectors. The IFTA automation alone saves 160–240 hours of annual labor. Every metric points the same direction: the system costs less than the fuel it saves. Run the calculation with your own fleet's fuel spend by starting a free trial or booking a demo to walk through fuel reconciliation on sample data.
Frequently Asked Questions
Which fuel card providers does Oxmaint integrate with?+
Oxmaint integrates with WEX, Comdata, EFS, FleetCor (Fuelman), Pacific Pride, CFN, Voyager, and most major truck stop networks including Pilot Flying J, Love's, and TA Petro. Transaction data imports automatically via API — no manual upload required. For fleets using proprietary bulk fuel systems, tank-level monitoring data integrates through standard MODBUS or API connections.
Book a demo to verify your specific fuel card integration.
How accurate is the per-vehicle fuel consumption data from telematics?+
Engine ECU fuel consumption data from J1939-compliant engines (virtually all Class 6–8 trucks manufactured after 2007) is accurate to within 1–2% of actual consumption when calibrated against fill-to-fill measurement. This accuracy is sufficient for variance detection — a 5% discrepancy between card purchases and ECU consumption reliably indicates a real leak, not measurement noise. For older vehicles without J1939 data, fill-to-fill MPG calculation from odometer and fuel receipt data provides 3–4% accuracy, which still catches the larger fraud and waste patterns.
Can the system handle bulk fuel tanks at our own yard?+
Yes. On-site bulk fuel tank monitoring integrates through tank-level sensors (Veeder-Root TLS, OPW, or equivalent) and dispenser flow meters. Each fuel transaction at the yard tank is logged against the vehicle ID, driver, date, and quantity — creating the same per-vehicle reconciliation data as retail fuel card transactions. Tank inventory, delivery scheduling, and reorder alerts are managed alongside retail fuel data in a unified dashboard. Fleets operating both yard tanks and retail fueling see all fuel data in one view.
Start a free trial to configure your bulk fuel monitoring.
How does fuel management connect to IFTA audits?+
When a jurisdiction initiates an IFTA audit, the auditor requests miles driven and fuel purchased by state for the audit period — typically 3 years of quarterly filings. Oxmaint generates the complete audit package from stored GPS mileage data and fuel card transaction records. The package includes per-vehicle mileage by jurisdiction, fuel purchases by state with receipt-level detail, and the calculated tax liability per quarter. Carriers using automated IFTA with GPS-verified mileage pass audits at a 97% rate vs. 74% for carriers using manual mileage estimates — because the data is complete, consistent, and verifiable against GPS records the auditor can independently confirm.
Fleet Fuel Intelligence — Oxmaint
Stop Guessing Where the Fuel Goes. Start Knowing — Per Vehicle, Per Route, Per Gallon.
Real-time fuel card fraud alerts, per-vehicle consumption reconciliation, MPG trending with maintenance triggers, automated IFTA reporting, idle cost coaching, and route-based fuel price optimization — the complete fuel management platform that turns your largest expense into your most controllable one.
8–12%
Total fuel cost reduction
$127K
Average first-year variance recovered
87%
Fuel card fraud caught same-day
3 weeks
Typical system payback period