A truck used to sit for fifteen minutes while a driver walked around it with a flashlight, checking tires, lights, and leaks by eye. Today a growing number of yards replace that walk with a lane: the truck rolls through a tunnel of cameras at a few miles per hour, and a full inspection report lands on a fleet manager's screen before the driver even parks. Fleets running these lanes at scale report processing roughly 60 trucks an hour through a single lane, a throughput number that manual inspection can never approach. This page breaks down how drive-through inspection lanes are built, what they cost, and what the payback actually looks like across fleet sizes — starting with the case for building one at Oxmaint.
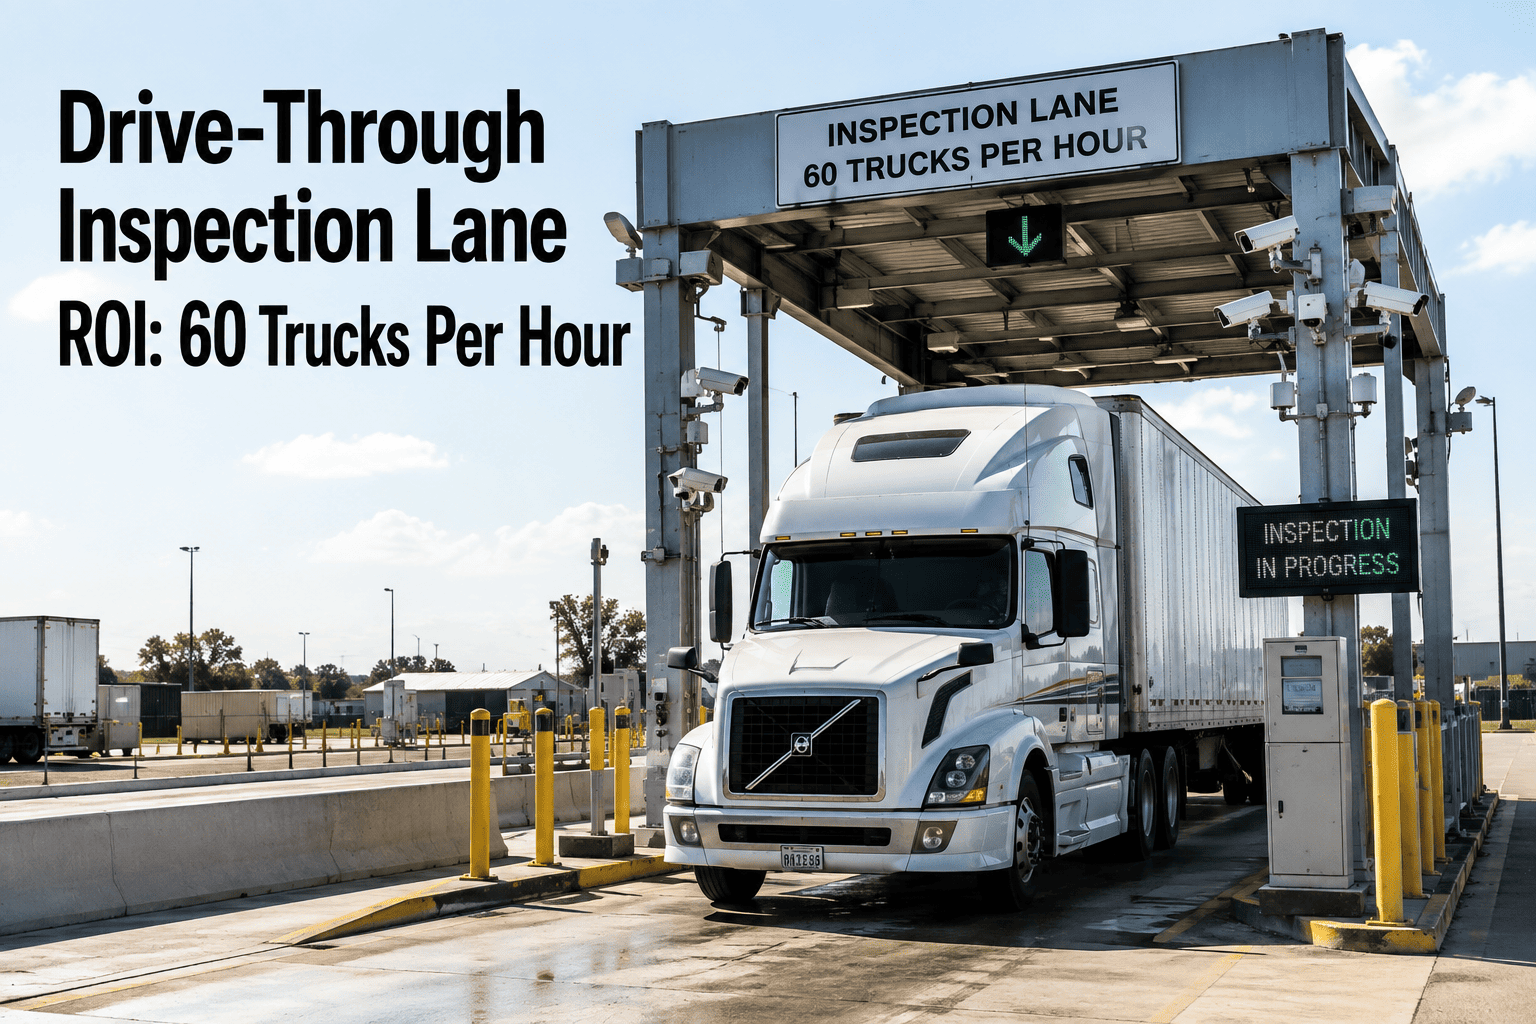
Drive-Through Inspection Lane ROI: 60 Trucks Per Hour
How camera-array inspection tunnels replace the 15-minute walkaround, what a lane costs to build at each fleet size, and the payback math fleet managers use to justify one.
Why the Walkaround Inspection Can't Scale With a Growing Fleet
A trained inspector spends ten to fifteen minutes on a thorough pre-trip or post-trip walkaround, checking tread depth by eye, feeling for soft spots in hoses, and scanning the undercarriage with a flashlight. That pace works for a ten-truck yard. It breaks down completely once a fleet runs fifty, one hundred, or several hundred vehicles through the same gate every shift change, because inspection time scales linearly with fleet size while yard labor and daylight do not.
Queues form at the gate. Drivers rush the checklist to keep their hours. Inspectors skip steps they know will hold up the line, and the items most likely to get skipped — underbody leaks, tire sidewall damage, brake component wear — are exactly the ones that turn into roadside breakdowns and DOT violations. A drive-through inspection lane removes the tradeoff between speed and thoroughness by inspecting every truck the same way, in seconds, regardless of how many are waiting behind it.
Inside the Camera Array: How a Lane Scans a Truck in Seconds
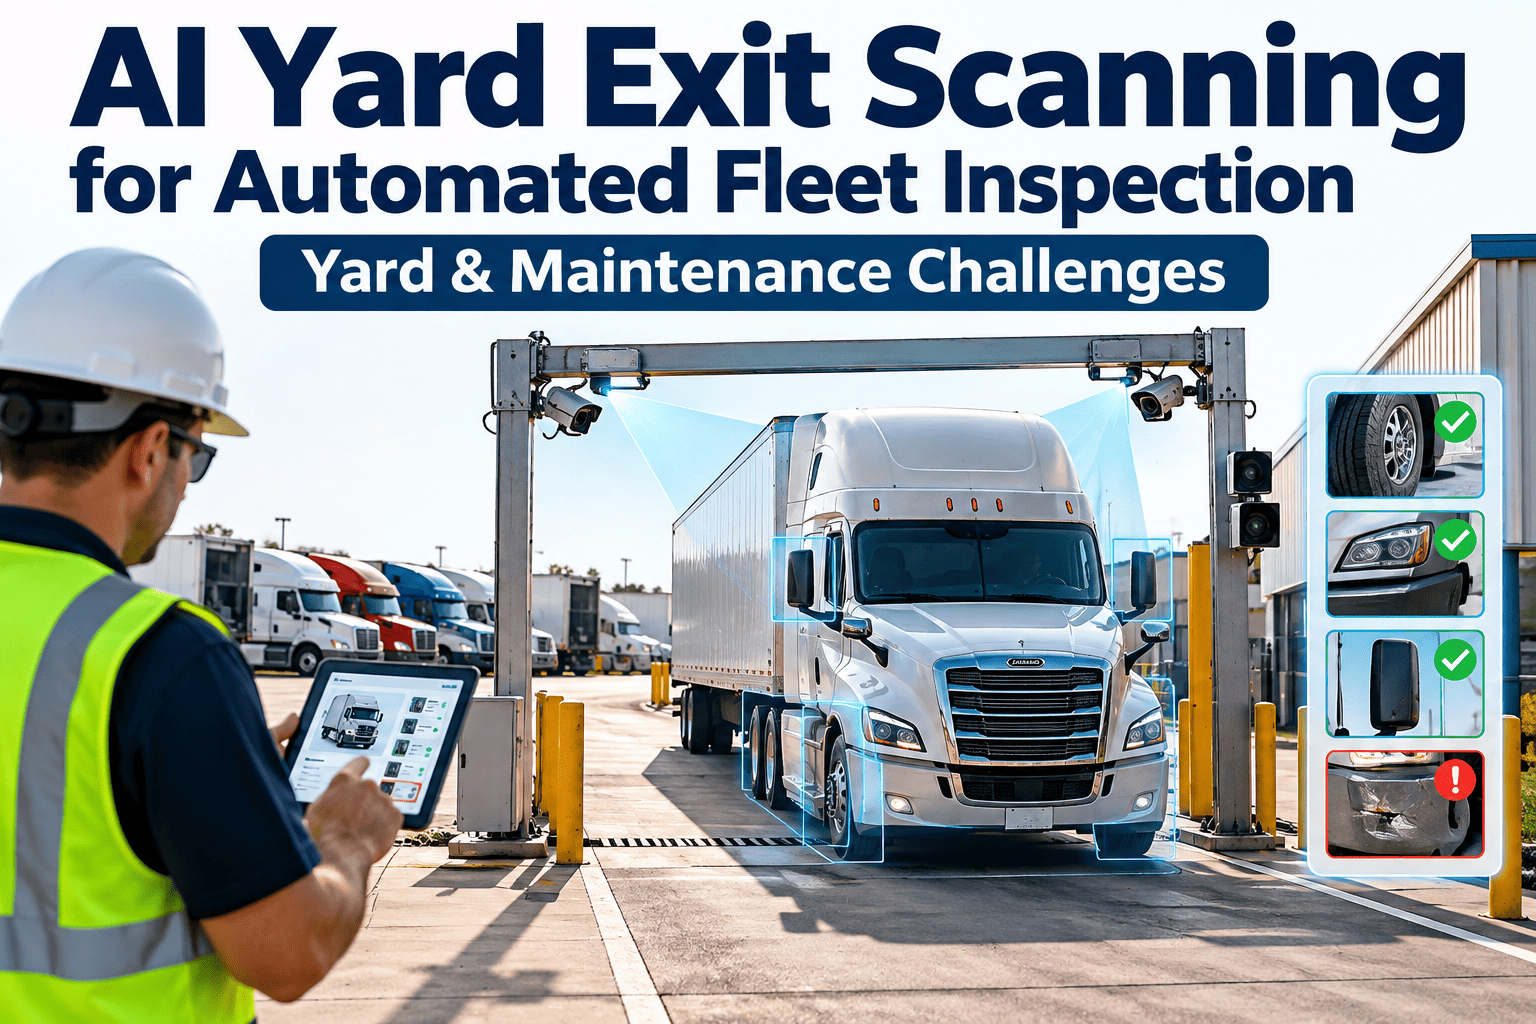
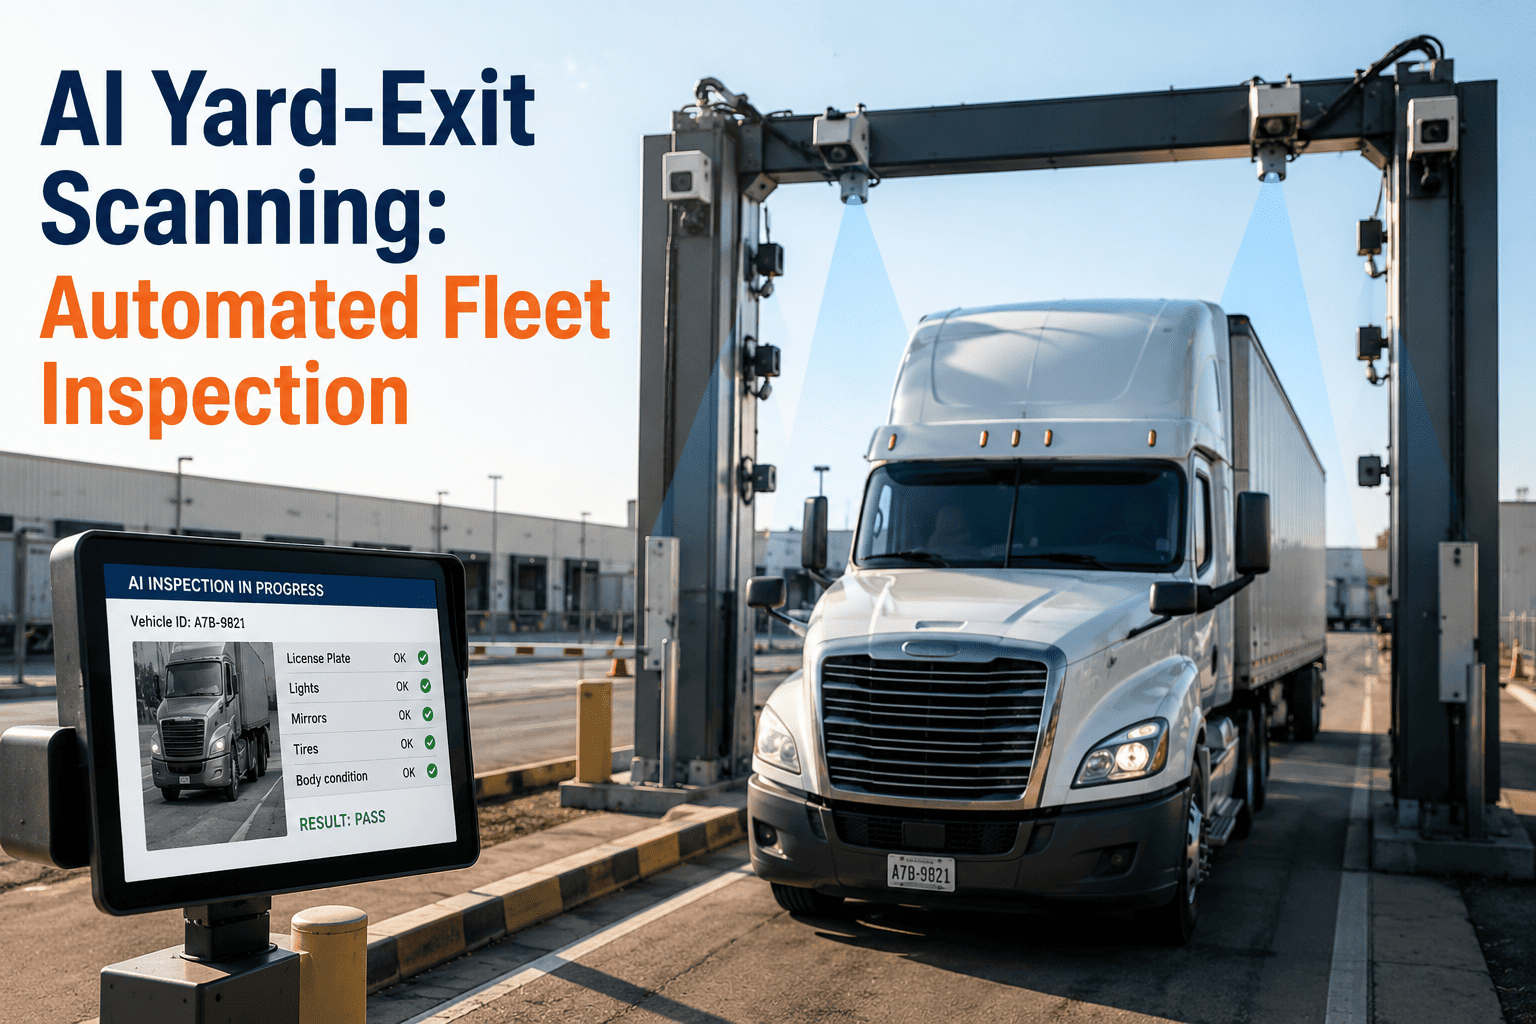
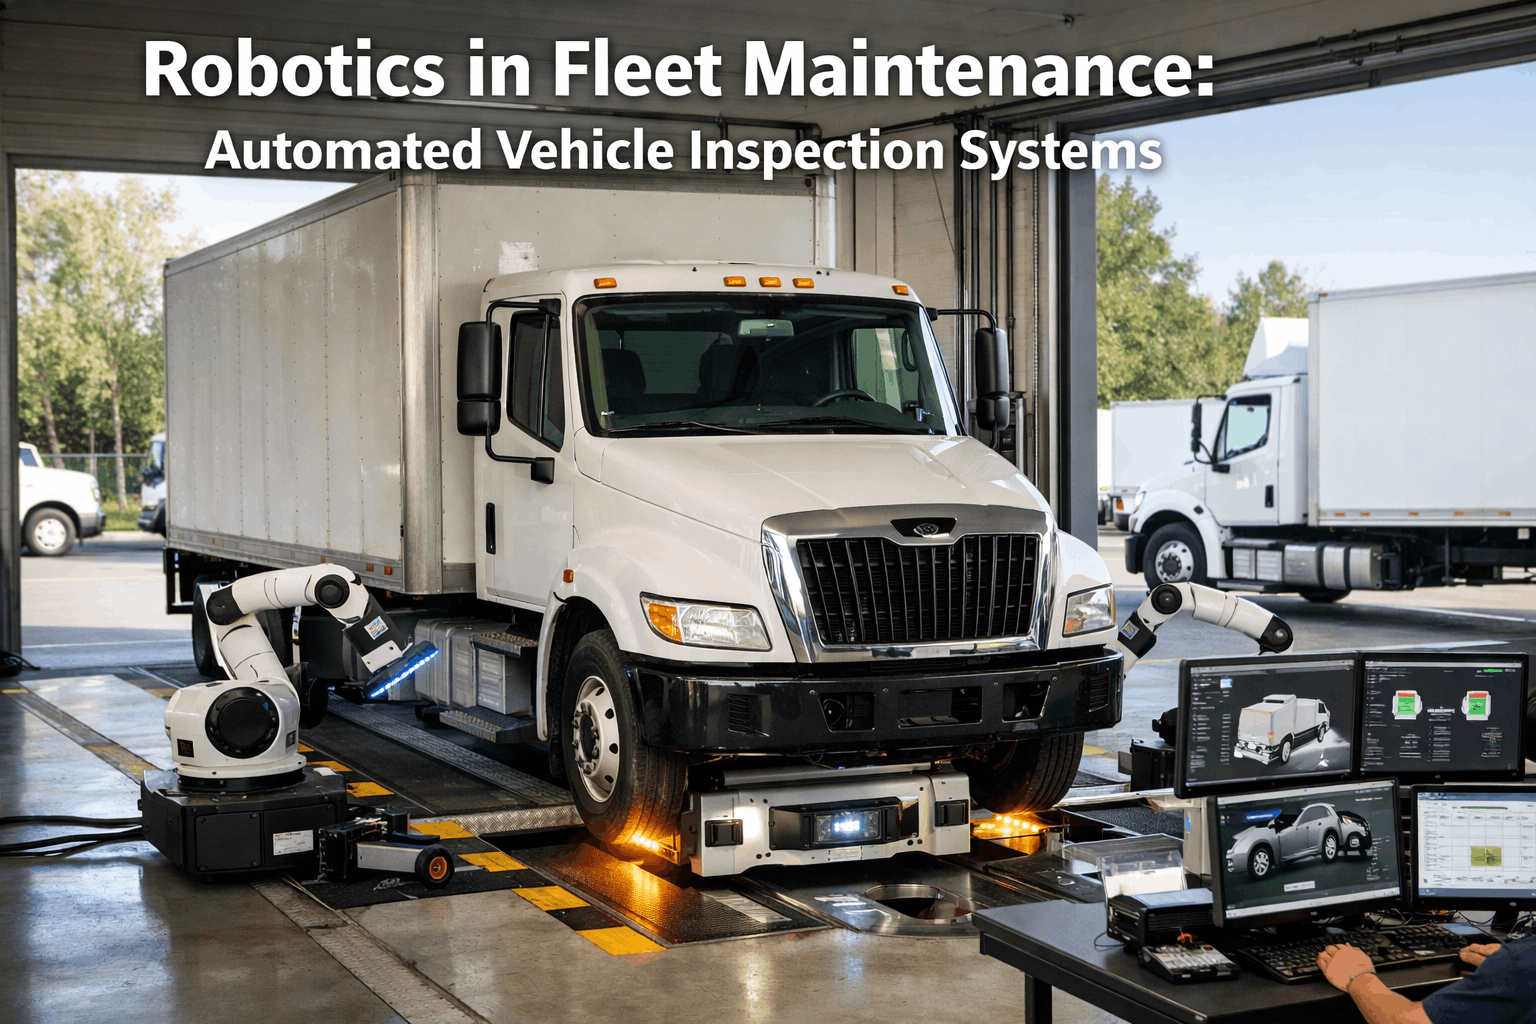
A drive-through lane is not a single camera pointed at a doorway. It is a coordinated array positioned around a short tunnel or gantry, each camera assigned to a zone of the vehicle. As the truck rolls through at low speed, the system captures thousands of high-resolution images and stitches them into a complete 360-degree condition record, then runs each image through a trained defect-detection model in real time.
Captures roof, cab, box panels, and door seals for dents, cracked glass, and body damage as the vehicle passes beneath the gantry.
Ground-level cameras angled upward capture the chassis, exhaust, driveline, and fluid lines to catch leaks and corrosion invisible from a standing walkaround.
A ring of cameras around wheel height reads tread depth, sidewall cuts, and embedded debris across every tire position in one pass.
Front and rear arrays confirm functioning lights, reflective tape condition, and required DOT markings are present and legible.
Controlled lighting inside the tunnel keeps image quality consistent regardless of the time of day or weather outside, which is part of why detection accuracy holds steady on a 6 a.m. winter shift the same as it does at noon in summer.
See a Drive-Through Lane's Data Flow Into a Live CMMS
Oxmaint turns every lane scan into a structured record: defects route straight to work orders, DVIR history stays audit-ready, and fleet managers see condition trends instead of a folder of photos.
Getting to 60 Trucks an Hour: The Lane Speed Breakdown
The 60-truck figure comes from lane speed, not magic. Vehicles roll through the tunnel at roughly 3 to 5 miles per hour, the scan itself completes in a few seconds once the full vehicle has passed the array, and the report generates while the truck continues to the next gate checkpoint. Add reasonable spacing between vehicles for safe following distance and the math lands close to one truck per minute — 60 an hour — for a single well-designed lane running continuously.
Two lanes running in parallel roughly double effective throughput, which is how larger terminals process several hundred vehicles across a single shift change without a queue ever forming at the gate.
What Cameras Catch That a Human Walkaround Misses
Fleets that have run both inspection methods side by side consistently find that camera arrays surface a different mix of defects than a human inspector working the same vehicle. Tire condition dominates the findings — sidewall tears, punctures, and uneven wear frequently account for over a third of everything a lane flags, largely because a driver's fifteen-second glance at a tire cannot match a ring of cameras reading full tread depth across all eighteen positions in one pass.
Sizing a Lane to Your Yard: Configuration and Space Requirements
Lane specifications differ by vehicle class and by how much of the inspection you want automated versus paired with driver confirmation. The table below covers the common configuration tiers fleets choose between when planning a lane installation.
| Configuration | Camera Count | Tunnel Length | Best Fit |
|---|---|---|---|
| Entry-Level Scan | 8-12 cameras | 20-25 ft | Exterior body and light checks only |
| Standard Fleet Lane | 16-20 cameras | 30-35 ft | Exterior, tire, and undercarriage combined |
| Full 360 Tunnel | 24-32 cameras | 35-40 ft | Complete multi-point scan with tread depth analytics |
| Dual-Lane Terminal | 2x standard array | 2 parallel bays | Shift-change surges above 300 vehicles per day |
| Mobile / Portable Rig | 10-14 cameras | Trailer-mounted | Multi-site fleets without a fixed terminal |
Most standard-fleet lanes need a straight approach of roughly 60 to 80 feet total, including staging distance before and after the gantry, and level ground with stable lighting conditions or a lighting hood built into the tunnel itself.
Payback Timelines by Fleet Size
A drive-through lane is a fixed infrastructure investment, so payback speed depends almost entirely on how many vehicles pass through it. Smaller fleets can still justify a lane through reduced roadside breakdowns and insurance impact, but the fastest payback comes from high-volume terminals where the same lane inspects vehicles around the clock.
The savings behind these numbers come from three places at once: fewer roadside breakdowns caught early instead of on the highway, materially reduced inspection labor per vehicle, and insurance and compliance benefits tied to a documented, consistent inspection record across the whole fleet.
From Camera Data to Work Order: Closing the Loop
A lane that produces photos nobody acts on is a very expensive camera hobby. The value shows up when a flagged defect turns into a scheduled repair automatically, without a fleet manager manually reviewing every scan. Oxmaint connects to lane inspection systems so that a flagged tire, brake, or leak triggers a work order the moment the scan completes, with the annotated images attached directly to the vehicle's maintenance record.
Defects above a configured severity threshold create a work order instantly, assigned to the right technician with the flagged images attached for reference.
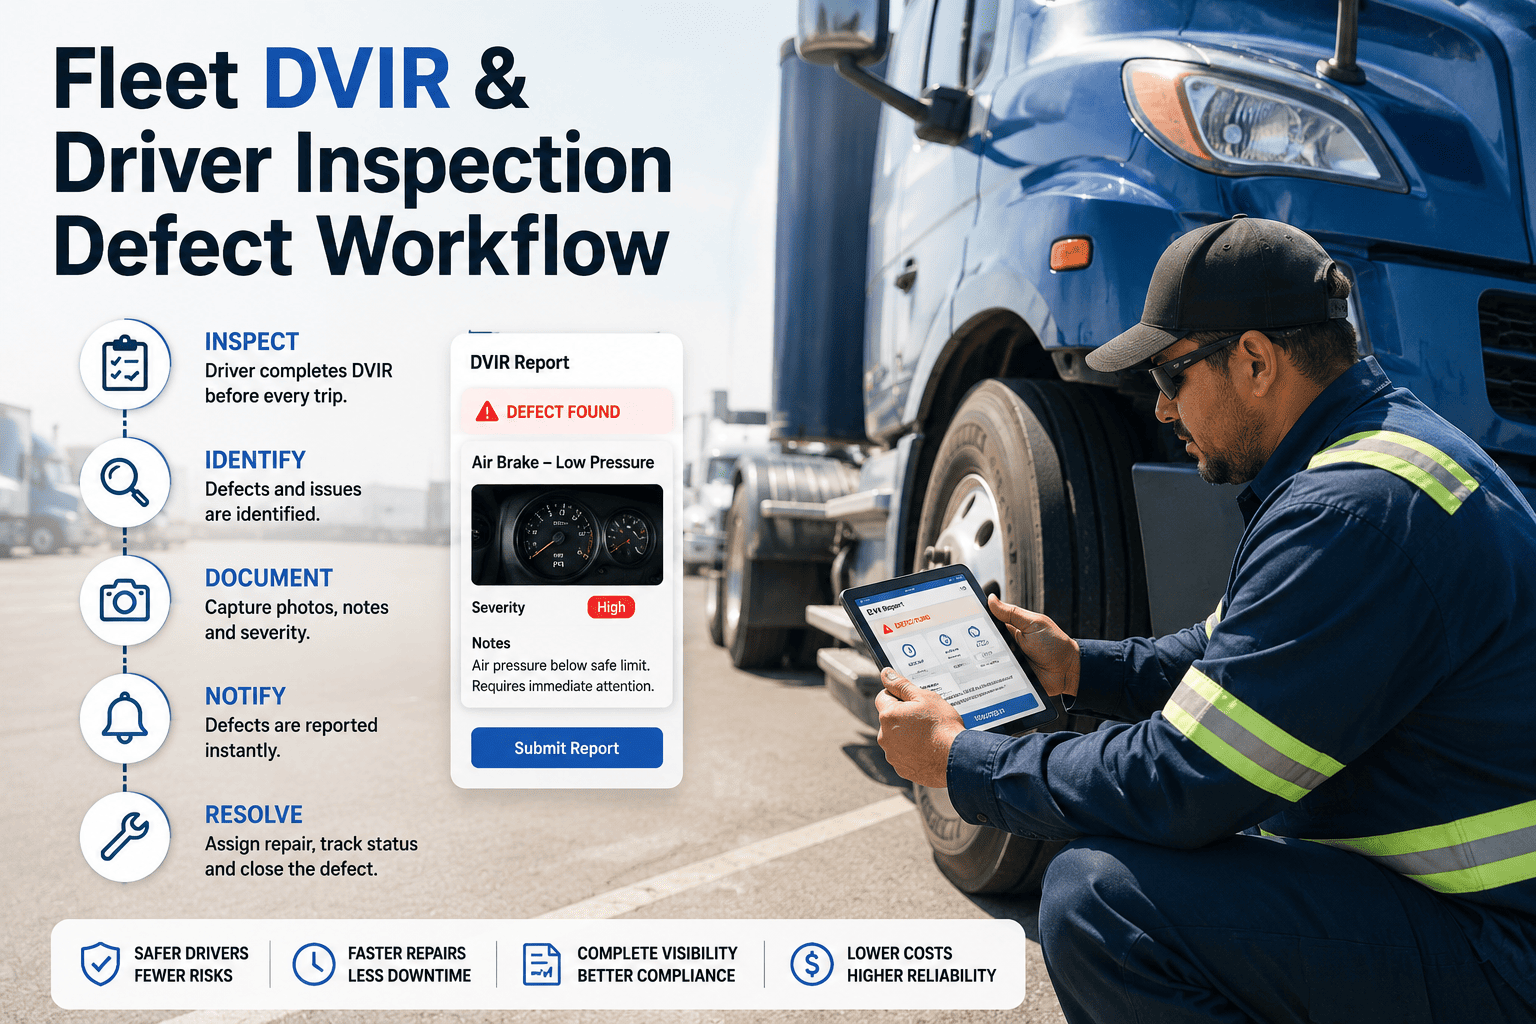
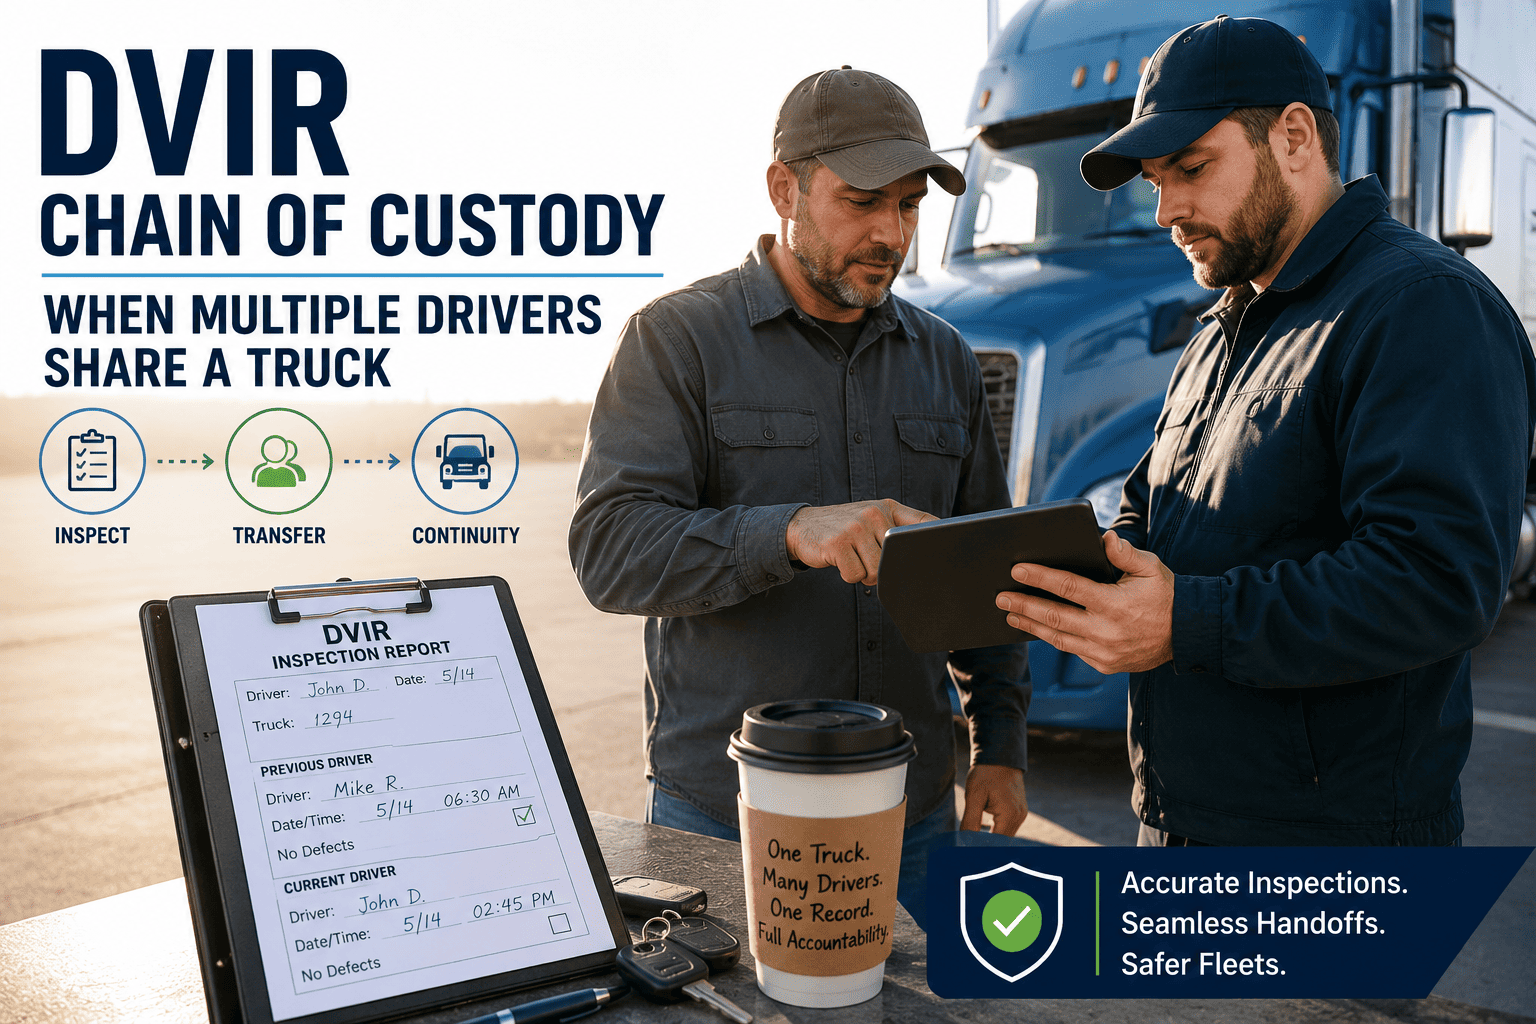
Every lane pass becomes a timestamped inspection record tied to the asset, replacing paper DVIR forms and closing gaps auditors flag most often.
Tread depth, panel condition, and undercarriage findings trend over time per vehicle, surfacing units degrading faster than the fleet average.
Pre-trip and post-trip scans on the same vehicle give an objective before-and-after record, settling damage disputes without guesswork.
Aggregated scan data highlights recurring defect types by route, terrain, or vehicle model to guide preventive maintenance scheduling upstream.
Lane data from every terminal feeds into one fleet-wide view, so a multi-yard operation manages inspection compliance from a single dashboard.
Frequently Asked Questions
How fast do trucks actually drive through the lane?
Most lanes run vehicles through at roughly 3 to 5 miles per hour, slow enough for camera arrays to capture sharp images but fast enough to avoid creating a bottleneck. Book a demo to see lane speed and layout for your yard.
Is a fixed lane worth it for a fleet under 50 trucks?
Smaller fleets often start with a portable, trailer-mounted rig instead of a fixed tunnel, capturing most of the same defect detection benefit without the fixed infrastructure cost. Start a free trial to model the numbers for your fleet size.
Does the lane replace driver pre-trip inspections entirely?
No. Cameras catch what eyes miss on tires, undercarriage, and body panels, but drivers still confirm items a camera cannot check, like brake feel, unusual noises, or dashboard warning lights.
What happens to the images and reports after a scan?
Each scan generates an annotated report tied to the vehicle record. When connected to a CMMS, flagged defects can trigger work orders automatically instead of sitting in an inbox unreviewed.
How accurate is AI defect detection compared to a trained inspector?
Deployed systems report detection accuracy around 95 percent on trained defect categories, though most fleets still pair camera findings with driver confirmation on borderline flags during the rollout period.
Stop Losing Hours to the Walkaround — Move Your Fleet Through a Lane
Oxmaint connects drive-through inspection scans directly into work orders, DVIR records, and fleet-wide defect trends, so every truck that rolls through the gate is already being managed the moment it clears the lane.