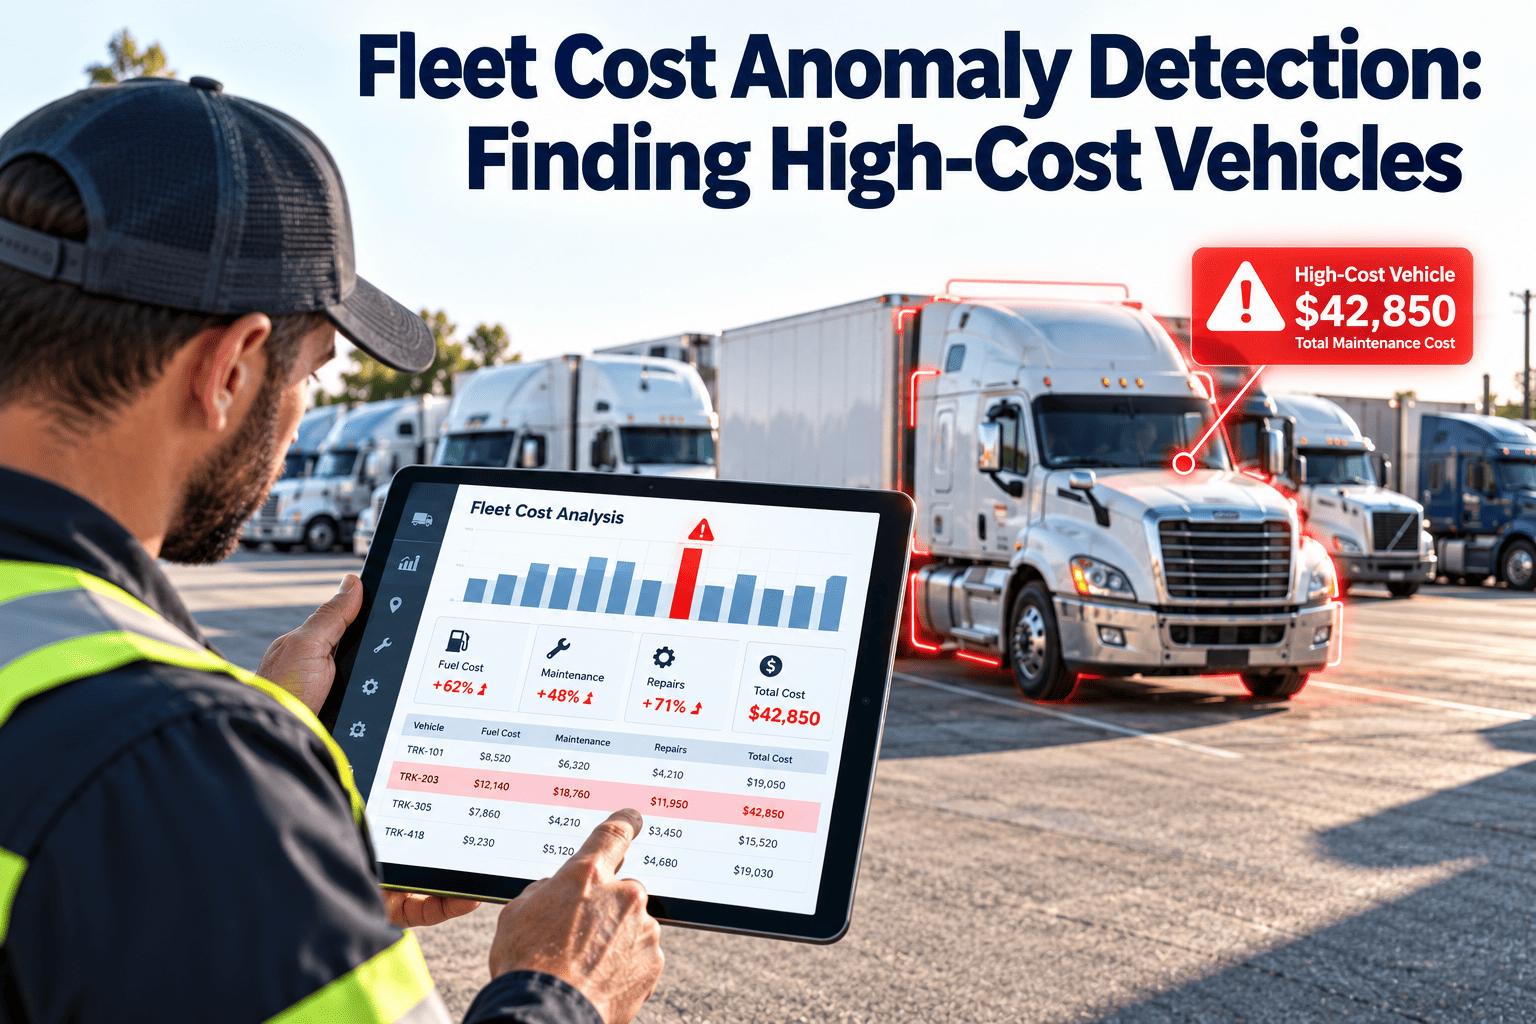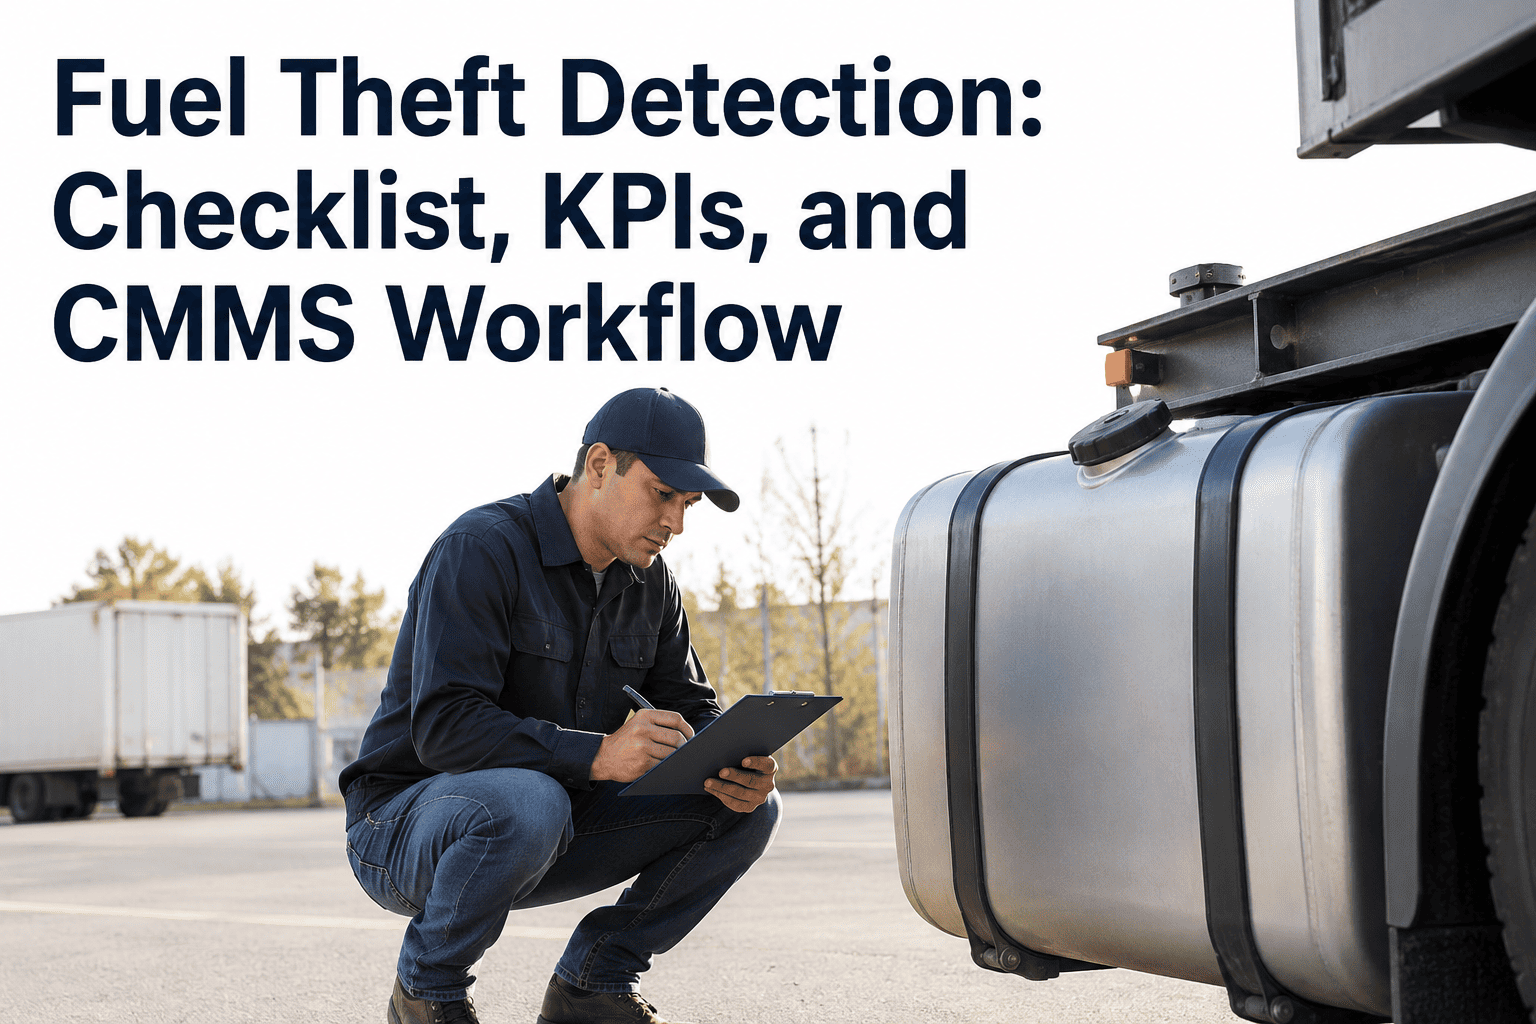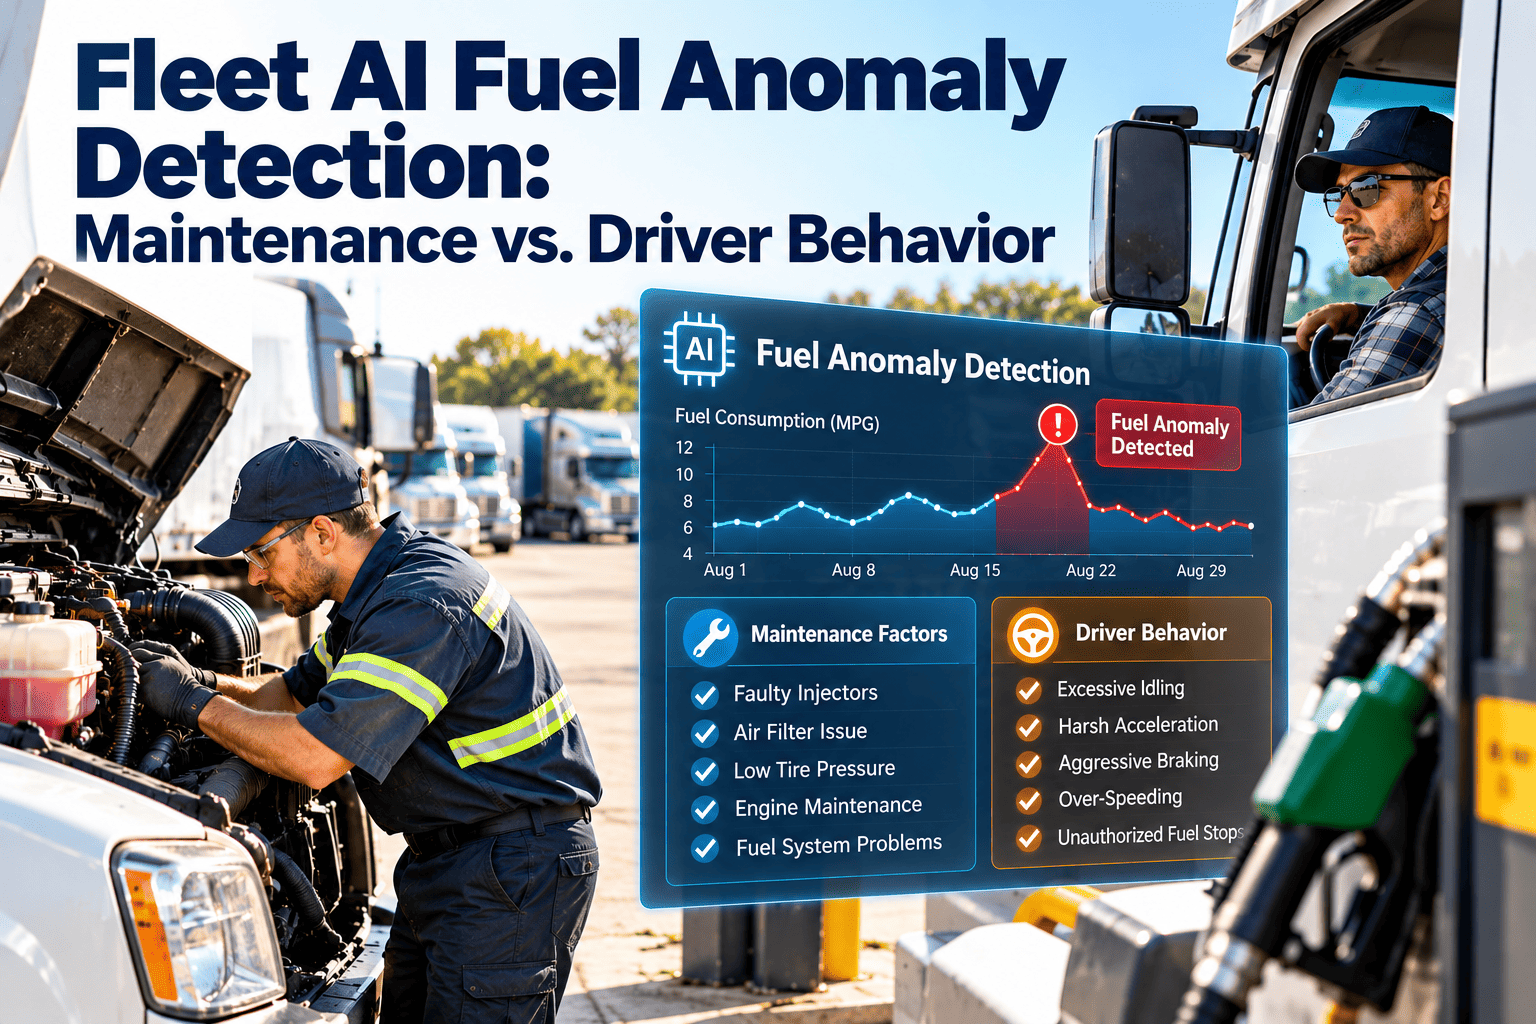
A fuel alert tells you that a vehicle burned more than expected. It does not tell you why. The cause may be a worn injector, soft tires, or a stuck regeneration cycle, or it may be long idling and heavy acceleration. Fleets that guess usually coach a driver for a mechanical fault or ignore a behavior problem that needs coaching. This guide shows how to separate the two with data patterns, inspections, and records, and how Oxmaint fleet maintenance software keeps every flagged anomaly tied to a work order.
Fleet AI Fuel Anomaly Detection: Maintenance vs Driver Behavior
AI can spot fuel variance within days. The savings come from sorting each flag into a repair or a coaching conversation, then proving the fix worked.
Why one fuel alert has two possible owners
Mechanical waste and behavioral waste look the same on a monthly fuel report: more fuel bought than the miles justify. Each has a different owner, a different fix, and a different cost.
Maintenance-owned fuel loss
- Follows the vehicle, no matter who drives it
- Builds gradually as parts wear or restrict
- Often comes with fault codes, pressure loss, or service overdue
- Gets worse until a technician repairs the cause
- Fix: inspect, repair, verify, record the finding
Behavior-owned fuel loss
- Follows the driver, shift, or route across different trucks
- Shows in idle time, harsh events, and speed profiles
- Vehicle passes inspection and has no open faults
- Improves with feedback, targets, and dispatch changes
- Fix: coach, set targets, review route, follow up
The cost of guessing wrong
- Coaching a driver for a failing injector damages trust and leaves the leak open.
- Sending a healthy truck to the shop wastes labor and downtime.
- Treating every flag as theft turns a maintenance backlog into a security investigation.
- Ignoring a behavior pattern lets fuel waste become normal practice.
Reading the shape of the anomaly
Before assigning blame, look at how the anomaly developed and how far it spreads. Shape and scope narrow the likely owner quickly.
| Pattern | What the data shows | Likelier owner | First check |
|---|---|---|---|
| Gradual slide over weeks | Fuel per mile creeps up on one unit | Maintenance | Tire pressure, filters, alignment, fuel system codes |
| Sudden step change | Baseline jumps after a specific date | Maintenance | Last work order, part swap, software update, sensor fault |
| One unit versus similar units | One vehicle stands out in its class | Maintenance first | Inspect that unit, then compare with its peers |
| Fleet-wide slow decline | Many similar units drift together | Process problem | PM intervals, deferred service, missed tire checks, fuel quality |
| Follows one driver | Anomaly moves from truck to truck with the person | Behavior | Idle share, harsh events, speed profile, route deviation |
| Rising idle share | More engine hours per mile, no route change | Either | Separate driver idle from HVAC, charging, or shutdown faults |
| Fill volume above tank size | Purchase does not match tank capacity or level change | Records or fraud | Card data, tank size on record, fuel level sensor |
What AI adds, and where it stops
AI detection is a faster, more consistent way to notice variance. It is not a diagnosis, and it needs maintenance context to be useful.
- Learn the baselineEach vehicle gets its own normal fuel use by duty cycle, load, and season, not just a fleet average.
- Normalize the noiseTerrain, PTO use, cold starts, and route type are separated from real drift.
- Flag the varianceStatistical models mark units that move outside their own range, often before a driver notices.
- Add contextOpen faults, PM status, tire records, and driver history narrow the likely cause.
- Hand off to peopleA technician or supervisor confirms the cause and records the result.
Limits worth stating plainly
- A model cannot see a worn injector. It sees fuel per mile rise and points to likely causes.
- Poor input data produces false flags, from wrong tank sizes to unreliable odometer readings.
- Thresholds that are too tight create alert fatigue; thresholds that are too loose miss slow drift.
- Any score applied to a person should be backed by evidence the vehicle was healthy.
Mechanical causes behind fuel anomalies
Specifications and limits come from manufacturer service information. This table turns a fuel flag into a targeted inspection.
| Cause | Why fuel use rises | Inspection check | Corrective action |
|---|---|---|---|
| Low tire pressure | Higher rolling resistance makes the engine work harder | Cold pressure on every position, including duals and trailers | Inflate, find leaks, review TPMS records |
| Injector wear or fouling | Poor spray pattern disrupts combustion | Fault codes, balance data, fuel trim | Diagnose and repair or replace |
| Fuel pressure loss | Weak delivery changes the air-fuel mix | Fuel pressure readings, filter condition | Replace filter, test pump and regulator |
| Restricted air intake | Engine breathes poorly and compensates | Air filter restriction and housing seals | Replace filter, correct leaks |
| Alignment or wheel-end drag | Extra friction at tires and bearings | Tire wear pattern, hub temperature, brake drag | Align, service bearings, adjust brakes |
| Wrong oil grade | Higher internal friction | Service record against specification | Correct grade at next service |
| Failing sensors | Control unit works from bad data | Oxygen, temperature, and pressure sensor codes | Test and replace the sensor |
| Aftertreatment issues | Frequent regeneration burns extra fuel | Regeneration history beside the fuel trend | Diagnose sensors and EGR before replacing filters |
| Mechanical idle demand | HVAC, charging, or cooling faults force long idling | Idle hours, battery and charging system test | Repair the fault that causes the idle |
Turn every fuel flag into a documented answer
Link inspections, PM history, and corrective work orders to each vehicle so your team can see the mechanical story before anyone has a difficult conversation.
Behavior causes and the evidence needed to confirm them
Behavior should be named only after the vehicle has been cleared. Each pattern below needs its own supporting data.
Separate necessary idle from waste
- Cab climate control in extreme weather, power for equipment, and warm-up requirements are not driver misconduct.
- Document these as approved idle categories so coaching targets only avoidable hours.
- If idle share rises with no route change, check batteries, charging, and cooling before coaching.
The triage ladder: rule out the vehicle first
Work down the ladder in order. Each rung removes a cause, so the last rung is reached only when the evidence supports it.
The driver swap test
- If the anomaly stays with the truck after a different driver takes it, the cause is likely mechanical.
- If it moves with the driver into a healthy truck, the cause is likely behavioral.
- If both change, the vehicle has a fault and the driving style adds to it.
An illustrative scenario
The numbers below are hypothetical, chosen to show the reasoning. They are not a customer result.
Truck 14: flagged for fuel per mile
- Fuel per mile has risen steadily for five weeks.
- Two drivers have used it, and both show the same rise.
- Inspection finds low pressure on rear duals and an air filter past its interval.
- After repair, the next fuel readings return toward baseline.
Truck 22: flagged for the same reason
- Fuel use is high, but the trend is flat and starts when one driver took over.
- Inspection finds no faults and PM is current.
- Idle hours are far above peers on the same route.
- Coaching and idle targets are set, with a review date.
What the idle math can look like
- Assume ten trucks each idle one extra hour per day at roughly 0.8 gallons per hour.
- That is about 8 gallons per day across the group, before counting the engine wear.
- Your own figures depend on engine size, load, and weather, so use measured idle data.
From alert to work order to verified result
An anomaly that ends in a dashboard chart only documents the waste. The loop closes when a flag becomes a repair and the repair is checked.
- DetectVariance flagged against the vehicle baseline
- TriageData check, history review, and pattern shape
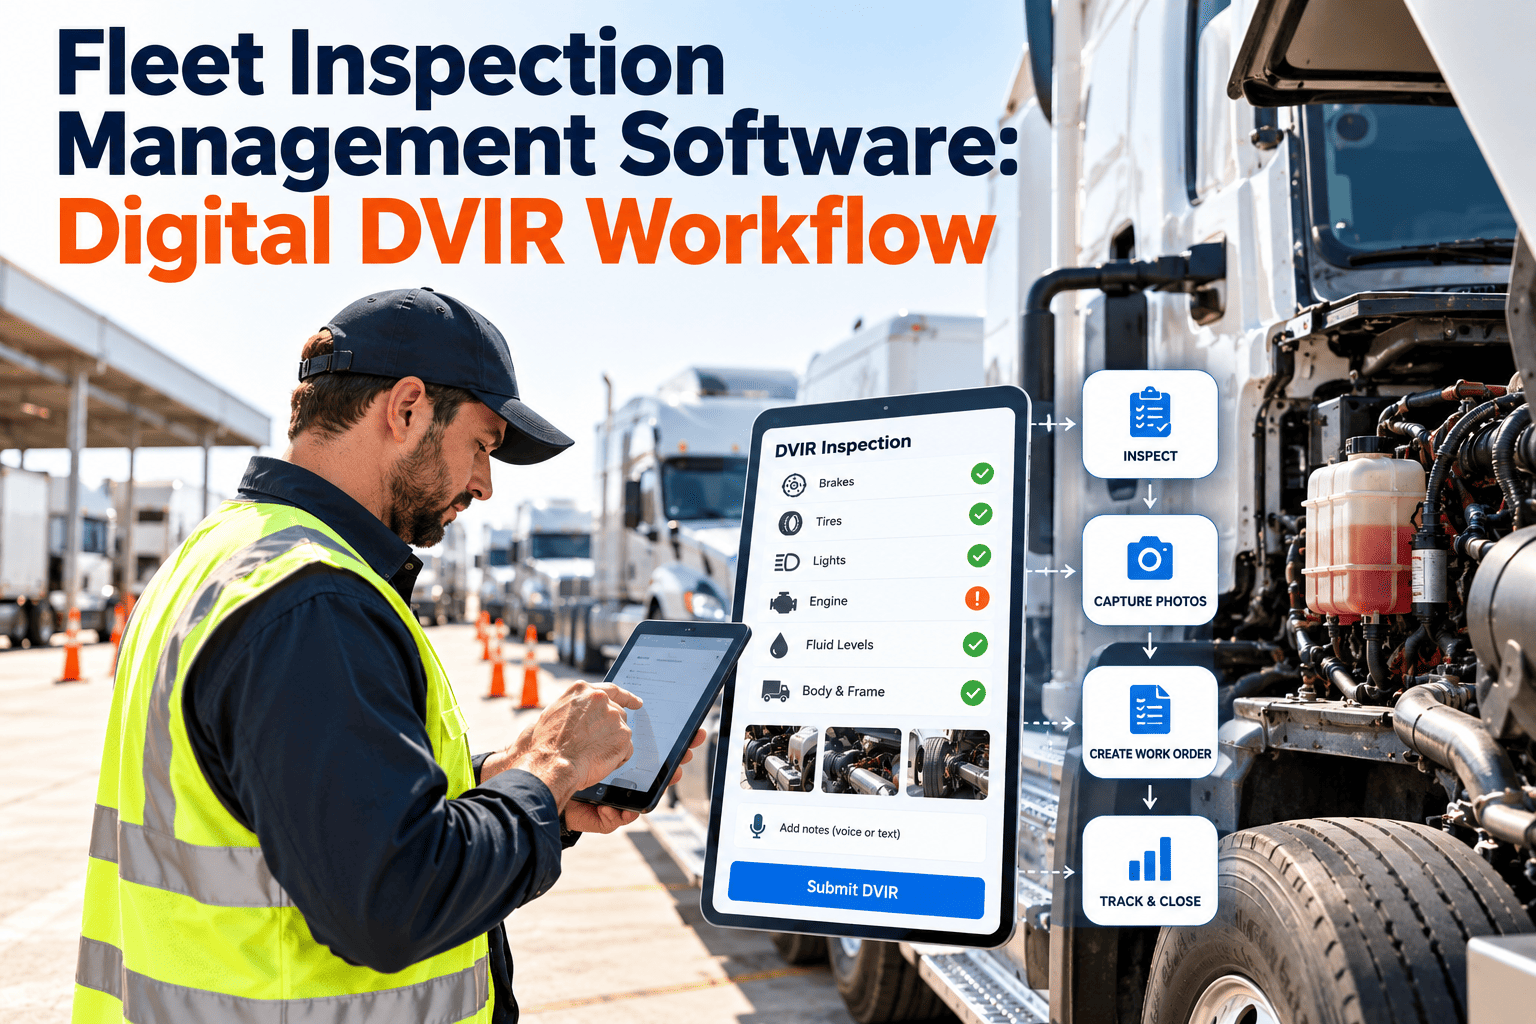
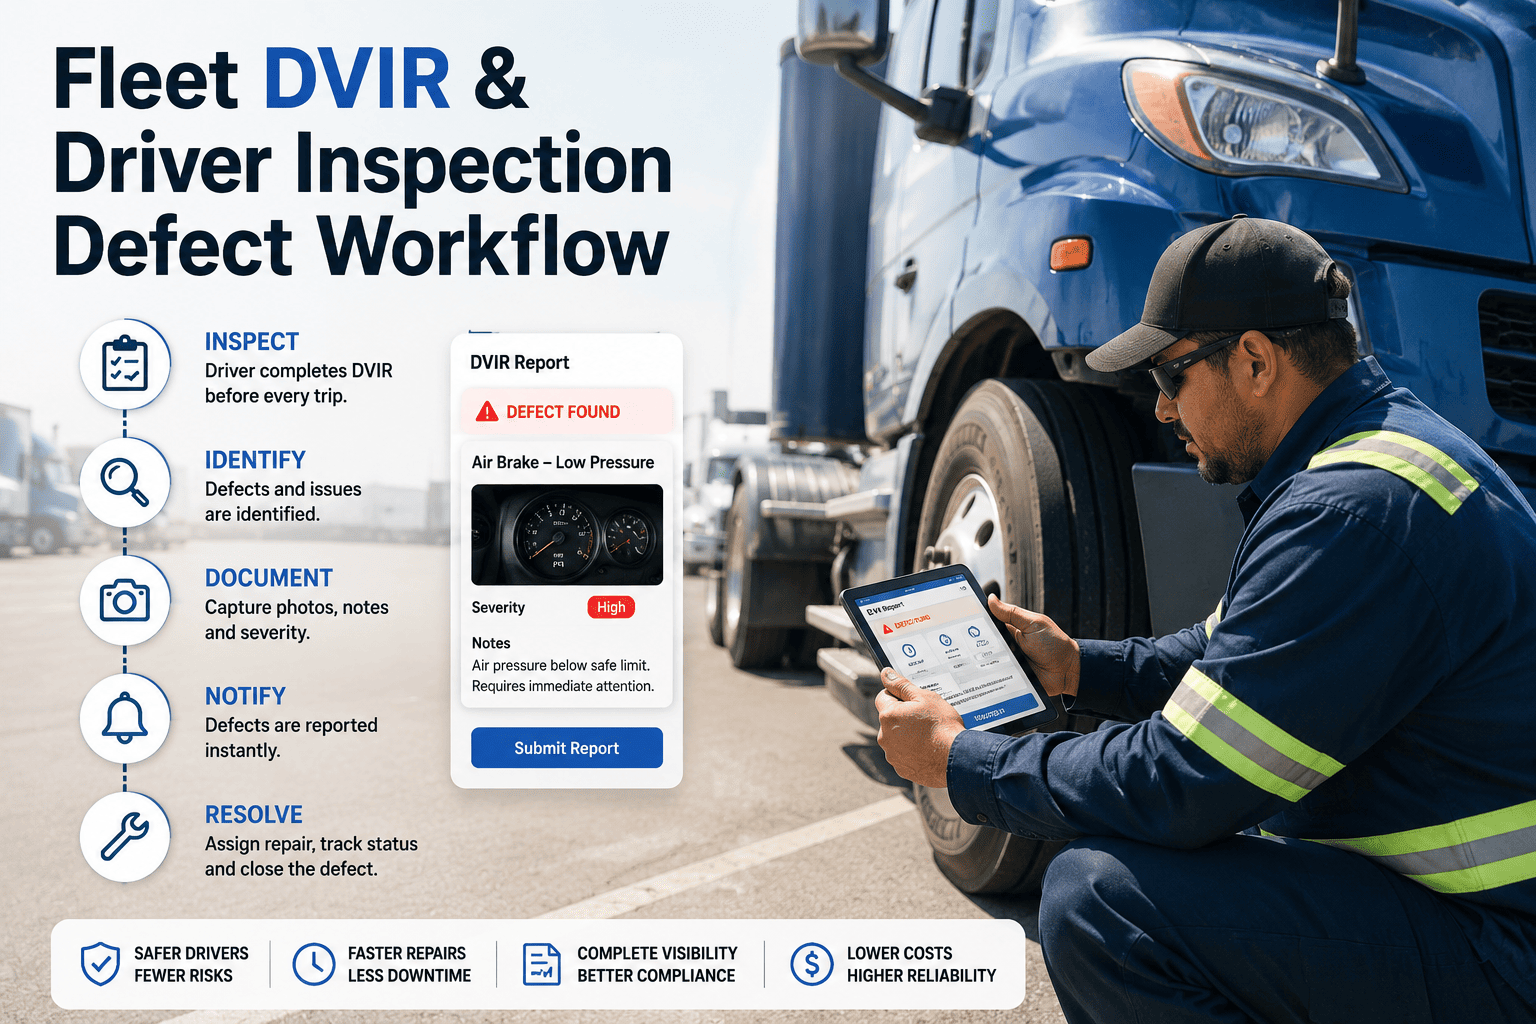
- InspectDigital checklist completed at the vehicle
- AssignWork order to the shop or coaching task to a supervisor
- Repair or coachCause recorded with parts, labor, and notes
- VerifyClose after fuel per mile confirms the fix
Siloed fuel data versus a maintenance-first loop
The difference is rarely the analytics model. It is whether fuel, inspection, and repair records talk to each other.
Siloed approach
- Fuel reports reviewed monthly by finance
- Mechanical and behavior causes mixed in one number
- Drivers blamed without an inspection record
- Repairs never checked against later fuel use
- Repeat causes stay invisible
Maintenance-first loop
- Variance reviewed within days of appearing
- Each flag classified by cause category
- Inspection evidence recorded before coaching starts
- Every repair followed by a fuel-per-mile check
- Recurring causes shape PM intervals and parts stock
Inspection checklists for a fuel flag
Split the work between the driver at the vehicle and the technician in the shop, so each person records what they are best placed to see.
Driver walkaround
- Visible tire condition and any soft tires
- Warning lights and dash messages
- Fuel leaks, drips, or odor
- Unusual noise, drag, or pull while driving
- Idle time needed during the shift, with the reason
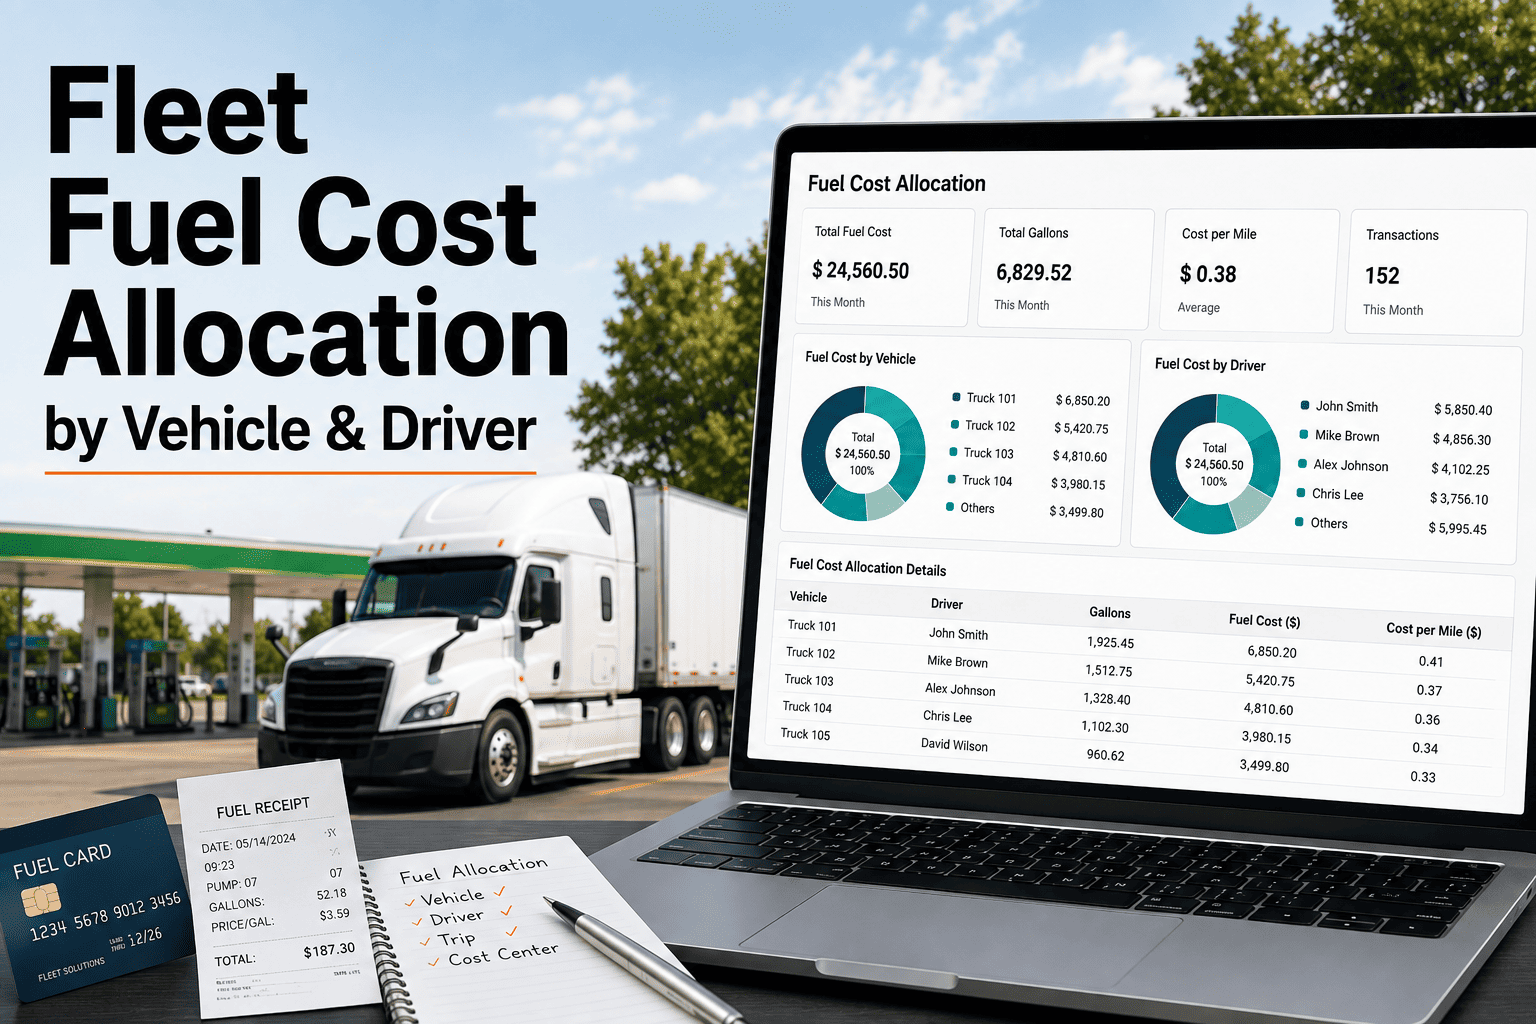
- Fuel purchase details entered correctly
Technician review
- Cold pressure on every position, trailers included
- Fault code and sensor history
- Air, fuel, and oil filter condition and intervals
- Alignment, wheel ends, and brake drag
- Regeneration history beside the fuel trend
- Post-repair road test and fuel follow-up date
Data problems that create false anomalies
Before any person is blamed or any truck pulled, make sure the numbers deserve trust.
KPIs that show whether the loop works
Track both detection speed and what happens after detection. Together they show if waste is falling and why.
How Oxmaint supports the maintenance side
Oxmaint is maintenance management software. It does not replace your telematics or fuel card system, but it holds the maintenance evidence that makes fuel flags explainable.
Fleet fuel anomaly FAQs
Can AI tell me if the cause is the truck or the driver?
It can flag variance and suggest patterns, but a person should confirm the cause. Inspection records and a driver swap test provide that confirmation.
What should I check first when fuel per mile rises?
Verify the data, then review tire pressure, filters, fault codes, and the last work order. Rule out the vehicle before coaching anyone.
Does a CMMS replace telematics or fuel cards?
No. Those systems supply fuel and driving data, while the CMMS holds inspections, PM, and repairs. Book a demo to plan how the records connect.
How do I stop false fuel alerts?
Correct tank sizes, odometer data, and card assignments, then tune thresholds by vehicle class and season. Review closed flags to see which rules create noise.
Where should a fleet start?
Start with tire pressure checks, filter intervals, and a work order path for every fuel flag. Create an Oxmaint account to set up those routines.
Know whether it is the truck or the driver
Give maintenance, operations, and finance one record of every inspection, repair, and fuel follow-up. See how Oxmaint connects the fix to the result.