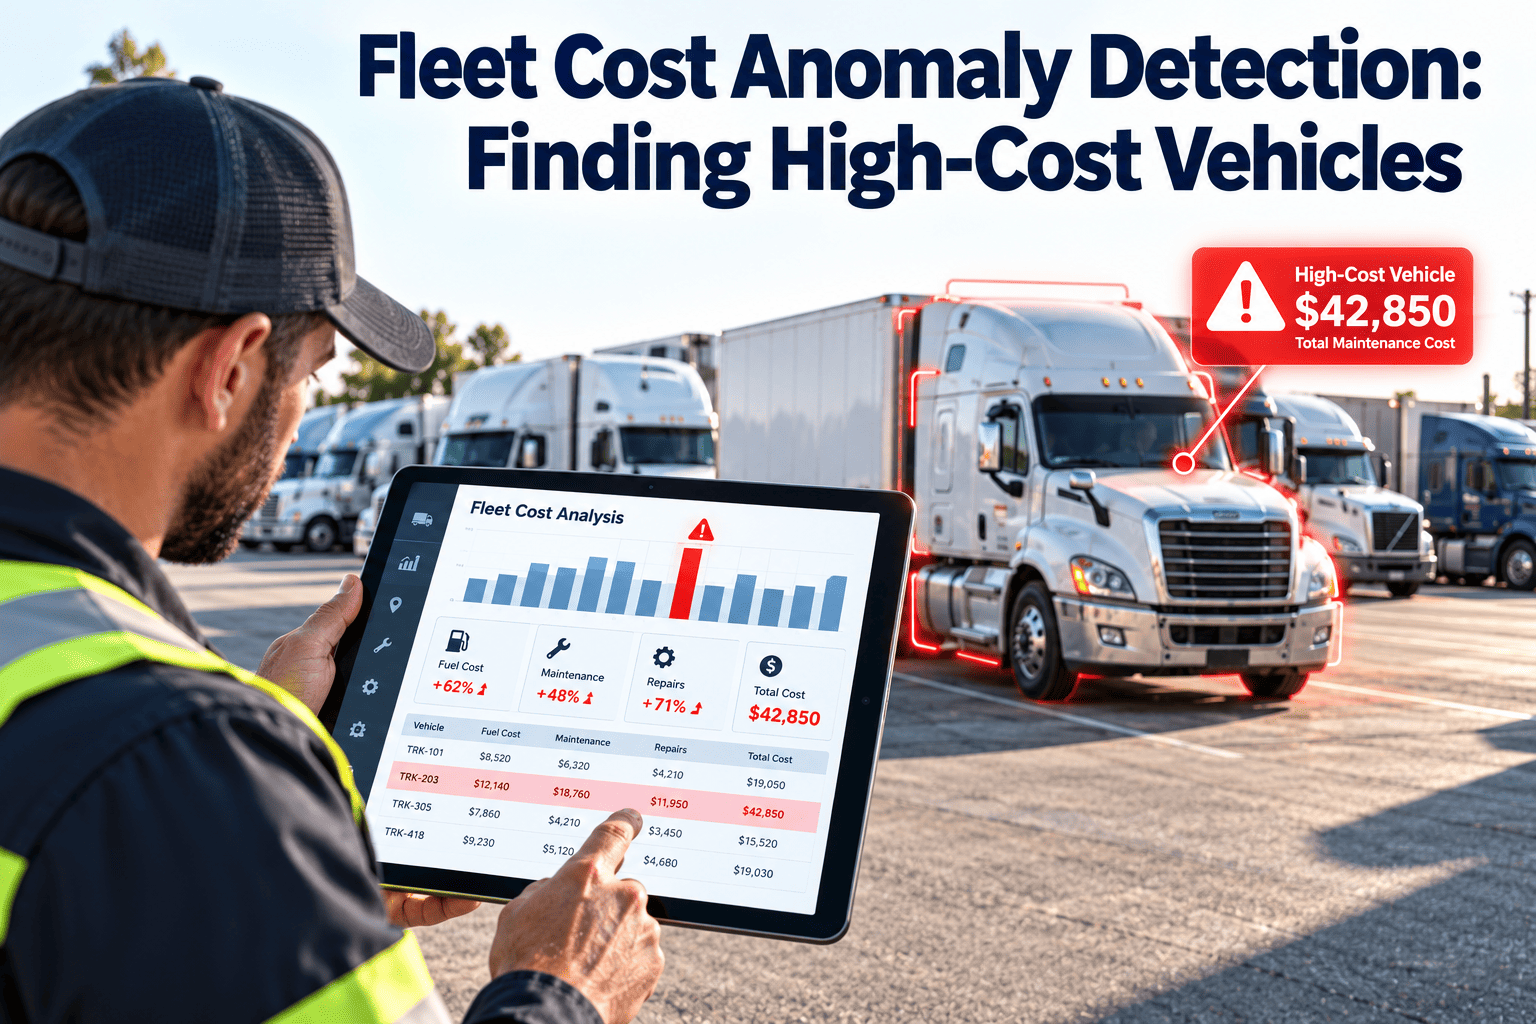
Every fleet has a few vehicles that quietly cost far more than their peers. They are rarely the ones making noise. A truck with a steady stream of small repairs, repeat parts, or drifting labor hours can hide inside a monthly total for a year. Cost anomaly detection means comparing each vehicle against a fair baseline, flagging the outliers early, and tracing each one to a cause. This guide explains how to do that with clean maintenance data, and how a maintenance-first system like Oxmaint keeps the history needed to prove it.
Fleet Cost Anomaly Detection: Finding High-Cost Vehicles
What counts as a cost anomaly
Outlier against peers
Drift against itself
Spike without a story
Normalize before you compare
Raw spend punishes the busiest vehicles. Compare like with like, or the ranking will mislead you.
| Normalizer | Why it matters | Data needed |
|---|---|---|
| Cost per mile or per engine hour | Removes the effect of how much the unit worked | Usage readings tied to the vehicle |
| Vehicle class and body type | Reefers, vans and tractors have different cost profiles | Clean asset classification |
| Age and mileage band | Older units legitimately cost more to keep running | In-service date, current meter |
| Duty cycle and route type | Stop-and-go urban work wears brakes and tires faster | Assignment or route tag |
| Planned versus unplanned share | Shows whether cost comes from neglect or from schedule | Work order type coding |
Six patterns that usually explain a high-cost vehicle
Repeat repairs on the same component
Skipped or late preventive maintenance
Driver-related wear
Warranty not claimed
Vendor or labor rate variance
Bad data
See which vehicles are really costing you money
An investigation workflow for every flagged unit
Match the evidence to the likely cause
| Signal in the records | Likely cause | First action |
|---|---|---|
| Same part number replaced repeatedly | Poor part quality or wrong diagnosis | Root-cause inspection, supplier review |
| Corrective work follows overdue PM | Deferred preventive maintenance | Tighten PM triggers and grace windows |
| Brake and tire cost high on one driver's units | Driving behavior | Coaching with record evidence |
| One vendor charges more for similar jobs | Rate variance | Compare quotes, standardize rates |
| Costs jump with no matching work description | Posting error or billing issue | Audit invoice and unit assignment |
| Covered component fails inside warranty period | Unclaimed warranty | File claim with history attached |
Repair-or-replace signals worth watching
Without cost history
- Old units kept because the sunk cost feels large
- Replacement decided by age alone
- Cumulative repair spend unknown
With cost history
- Lifetime repair cost visible by unit
- Rising corrective share flagged for review
- Replacement planned against real data
Data hygiene checklist before you trust the ranking
- Every vehicle has one unique ID used by maintenance, fuel and accounting.
- Work orders carry a type: preventive, corrective, accident or inspection.
- Parts and labor post to the work order, not to a general account.
- Meter readings are captured at each service, from telematics or manual entry.
- Outside vendor invoices are matched to a work order before payment.
- Warranty status and expiry are recorded on the asset.
Metrics that make anomalies visible
Cost per mile
Cost per hour
Corrective share
Repeat repair rate
Parts spend per unit
Setting thresholds that people trust
A threshold nobody believes gets ignored. Start with a simple rule, explain it to the shop, then refine it as you learn which flags turn out to be real.
| Method | How it works | Best for | Limitation |
|---|---|---|---|
| Peer median band | Flag units above a set percentage over the median of their class | Mid-size fleets with clear vehicle classes | Needs enough similar units to compare |
| Rolling self-trend | Compare each unit's recent cost per mile with its own earlier months | Spotting drift on one vehicle | Seasonal work can look like drift |
| Single-event ceiling | Flag any one work order above a set amount for review | Catching billing errors and big repairs | Does not catch slow, steady overspend |
| Statistical spread | Flag units several standard deviations from the class average | Larger fleets with solid history | Needs clean data and some analysis skill |
Split cost into categories before analysis
One total hides the story. Splitting spend by type shows whether an outlier is a parts problem, a labor problem or a vendor problem.
Parts
In-house labor
Outside vendors
Tires
Accident and damage
Fluids and consumables
Worked example: reading an outlier step by step
Imagine a delivery van that ranks first on cost per mile for three months. The right response is investigation, not an automatic replacement decision.
First look at the surface
- Total spend is well above the van class median
- Several large invoices appear in one month
- The driver reports the van is "always in the shop"
After reviewing the records
- Two invoices belonged to a different van and were posted to the wrong unit
- A starter was replaced twice by different vendors
- A warranty claim was never filed on a covered component
Driver and route effects on cost
Maintenance cost does not belong to the vehicle alone. Assignment and route type change wear patterns in ways a vehicle-only report will miss.
Driver assignment
Route type
Load and terrain
Comparing vendors and parts sources
If the same job costs more at one shop than another, that gap repeats on every similar repair. A simple comparison table exposes it.
| Comparison | What to measure | Question to ask |
|---|---|---|
| Labor rate by vendor | Hourly rate and billed hours for similar jobs | Is the higher rate buying faster or better work? |
| Parts price by source | Unit price of common parts across suppliers | Can we consolidate on an approved supplier? |
| Repeat repair by vendor | Same defect returning after a vendor repair | Is the first repair actually fixing the cause? |
| Turnaround time | Days from drop-off to release | Does slow turnaround cost us route coverage? |
Decision paths once the cause is known
A reporting rhythm for cost reviews
- Weekly: shop lead reviews single-event spikes and open work orders for flagged units.
- Monthly: fleet manager reviews the outlier list, categories and vendor comparison.
- Quarterly: leadership reviews lifetime cost, repair-or-replace candidates and warranty recovery.
- Each review should end with an owner and a due date for every flagged unit.
- Track whether flagged units return to range, since that proves the process works.
How Oxmaint supports cost anomaly work
Detecting anomalies depends on complete records. Oxmaint keeps the building blocks on one asset history.
Work orders and costs
Asset history
Reports and dashboards
Why an anomaly report can be wrong
Before anyone changes a policy or confronts a driver, rule out the explanations that have nothing to do with the vehicle.
Reporting traps
- Comparing a new vehicle with an older one that has been fully depreciated and repaired often
- Including accident repairs in a wear-and-tear ranking
- Ignoring a recent major overhaul that was a one-time expense
- Treating a vehicle that was idle for months as if it ran all year
Safer practice
- Group by class, age band and duty cycle before ranking
- Report accident and damage spend on its own line
- Mark one-time overhauls so they do not distort the trend
- Use cost per active mile or hour, not calendar time alone
A pre-review checklist for flagged vehicles
Run this short list before the monthly meeting. It keeps the discussion on causes instead of arguments about the numbers.
- Confirm the vehicle ID matches the asset record, plate and telematics device.
- Check that the last meter reading is current and plausible.
- List every work order for the period and confirm each has a type.
- Match outside invoices to work orders and look for duplicates.
- Look for repeat repairs on the same component in the last twelve months.
- Check warranty status, recall campaigns and open DVIR defects.
- Note any change in driver assignment, route or load in the same period.
- Write one sentence describing the most likely cause, and who will check it.
What good looks like after six months
Success is not zero outliers. Some units will always cost more. The goal is fewer surprises and faster explanations.
Faster detection
Cleaner data
Fewer repeats
Warranty claims
Better replacement timing
Questions finance and operations will ask
An outlier report only changes behavior when it survives scrutiny. Expect these questions, and have the records ready to answer them.
- Is this vehicle worse than its peers, or just busier than they are?
- Which part of the cost is parts, which is labor, and which is an outside vendor?
- Was any of it covered by warranty, and was a claim filed?
- Would an earlier or better preventive service have avoided the repair?
- What will we do differently next month, and how will we check that it worked?