Fleet managers have run simulation exercises on whiteboards and spreadsheets for decades — sketching out what happens if three vehicles go down simultaneously, or how a route change affects maintenance intervals across 200 units. Digital twin technology replaces that guesswork with a live, data-fed virtual replica of every vehicle in the fleet, running real simulations against real operational data. A fleet digital twin mirrors each vehicle's current condition, maintenance history, sensor readings, and utilization patterns in a virtual environment — then models failure probabilities, tests maintenance scenarios, and optimizes scheduling decisions before anything changes in the physical fleet. Organizations deploying fleet digital twins report 35% reduction in unplanned downtime, 28% improvement in maintenance cost efficiency, and the ability to answer "what if" questions in hours rather than weeks. If your fleet planning still relies on experience and intuition rather than simulated evidence, start a free trial with Oxmaint or book a demo to see fleet digital twin simulation in action.
Fleet Operations · Digital Twin · AI Simulation
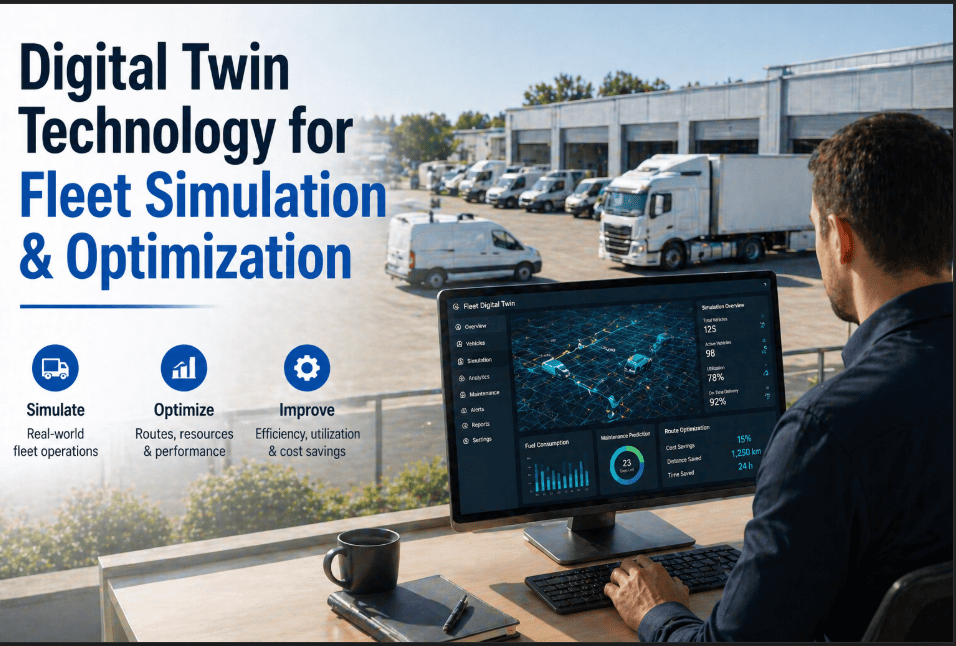
Digital Twin Technology for Fleet Simulation and Optimization — The Complete 2026 Guide
Virtual replicas of every vehicle. Real-time condition mirroring. Scenario simulation before decisions are made. Fleet digital twins are transforming how operations leaders plan maintenance, predict failures, and optimize fleet utilization — replacing gut-feel decisions with simulated evidence.
35%
Reduction in unplanned downtime with fleet digital twin programs
28%
Maintenance cost improvement from simulation-driven scheduling
4hrs
Time to answer a "what-if" scenario vs. weeks with manual analysis
What It Actually Is
Fleet Digital Twins — Precise Definition, No Marketing Noise
A fleet digital twin is a dynamic software model of a physical vehicle that synchronizes continuously with real-world data from telematics, maintenance records, IoT sensors, and operational systems. It is not a dashboard. It is not a 3D model for show. It is a simulation environment that enables decision-making through evidence rather than estimation.
What It Is
A Live Virtual Replica
A continuously updated virtual model of each vehicle — mirroring engine condition, component wear, utilization patterns, maintenance history, and real-time sensor outputs. The virtual vehicle changes as the physical vehicle changes.
What It Does
Simulates Before You Decide
Runs maintenance timing scenarios, failure probability models, and operational change simulations in the virtual environment — before any physical action is taken. Test decisions without consequences.
What It Is Not
Not a Static Dashboard
A dashboard shows historical data. A digital twin runs forward-looking simulations. A dashboard tells you what happened. A digital twin tells you what will happen and what changes when you adjust a variable.
How It Differs from PdM
Simulation vs. Prediction
Predictive maintenance tells you when a component will fail. A digital twin tells you what happens to the rest of the fleet if that component fails now — and simulates three alternative intervention strategies to find the optimal response.
Maturity Model
The Four Levels of Fleet Digital Twin Maturity
Fleet digital twin capability is not binary — it develops across four maturity levels, each building on the foundation of the previous. Most fleets currently operate at Level 1 or 2. The ROI curve accelerates sharply at Level 3 and above.
L1
Descriptive Twin
Static vehicle records — specifications, maintenance history, and asset registry. No live data synchronization. Useful for documentation and warranty tracking. Where most fleet CMMS implementations sit today.
Capability: Record keeping. No simulation.
L2
Informative Twin
Live telematics and sensor data feeds update the virtual vehicle in real time — engine hours, fuel consumption, fault codes, GPS position, and driver behavior scores continuously synchronized. Current state is always visible.
Capability: Real-time condition monitoring. Limited forecasting.
L3
Predictive Twin
ML models trained on the synchronized data forecast component failure probabilities and remaining useful life. When a brake pad is at 34% remaining life, the twin calculates that at current utilization rate, replacement is needed in 18 days — before it appears on a standard inspection.
Capability: Failure forecasting with lead time. 91% accuracy on monitored components.
L4
Prescriptive Twin
The twin simulates multiple maintenance scenarios and recommends the optimal action — weighing failure probability, vehicle utilization requirements, technician availability, parts inventory, and total cost. Autonomous work order generation when simulation confidence exceeds threshold.
Capability: Scenario simulation. Optimal decision recommendation. Autonomous scheduling.
The Planning Gap
Four Fleet Planning Problems That Digital Twins Solve
01
Maintenance Timing Decisions Made Without Data
A fleet manager decides whether to pull a long-haul truck for scheduled maintenance or run it through a critical delivery week based on feel and experience. A digital twin runs the simulation: 73% probability of brake component failure if deferred 7 days, $4,200 cost of in-field failure vs. $380 planned repair. The decision becomes data-driven, not instinct-driven.
Current approach cost: $4,200 average unplanned repair vs. $380 planned
02
Fleet Size and Composition Planning on Assumptions
Decisions about adding vehicles, retiring units, or shifting vehicle types to different routes are made on historical averages and forecasts that cannot model individual vehicle condition. Digital twin simulation tests fleet composition scenarios — what happens to utilization, cost, and reliability if 3 aging units are replaced with 2 newer high-capacity vehicles.
Current approach: Gut-feel decisions on million-dollar capital purchases
03
Cascade Failure Planning Has No Simulation Tool
When three vehicles fail simultaneously during a peak demand period, operations react. Digital twin scenario modeling tests "what if 15% of fleet is unavailable simultaneously" — identifying which routes have redundancy, which contracts are at risk, and what the optimal vehicle reallocation looks like. The crisis response is designed before the crisis occurs.
Current approach: Reactive response with no pre-modeled contingency
04
Technician and Bay Capacity Not Modeled Against Demand
Maintenance schedules are built independently from technician capacity and bay availability. When six PM-due vehicles converge in the same week, the shop backs up and two vehicles get deferred — creating the downstream failure risk that PM was supposed to prevent. Digital twin scheduling models the entire maintenance demand curve against shop capacity to distribute load optimally.
Current approach: Shop capacity conflicts discovered when they happen
Fleet Digital Twin Platform
Simulate Before You Decide. Optimize Before You Act. Plan Before the Crisis.
Oxmaint's fleet digital twin module connects telematics, IoT sensor data, and maintenance records to simulation models — giving fleet managers the ability to test scenarios, forecast failures, and optimize decisions in a virtual environment before committing resources in the physical fleet.
Platform Capabilities
How Oxmaint Delivers Fleet Digital Twin and Simulation
Data Sync
Live Telematics and IoT Integration
OBD-II, CAN bus, and fleet telematics platforms (Samsara, Geotab, Verizon Connect, Motive) feed engine hours, fault codes, fuel consumption, brake wear, and GPS data continuously into each vehicle's digital twin model.
Real-time virtual mirror of every vehicle's current condition
Simulation
Maintenance Scenario Modeling
Test maintenance timing decisions in the virtual fleet before committing technicians and bay time. Model the cost and risk difference between servicing a vehicle now versus deferring 7, 14, or 21 days — with failure probability and total cost of each option calculated automatically.
Evidence-based maintenance timing decisions replace instinct
Failure AI
Component Failure Forecasting
ML models trained on fleet-specific historical data forecast component failure probability per vehicle — brake pads, belts, filters, batteries, and engine components individually scored. 91% accuracy on monitored components after 90-day model training period.
Failure timing known weeks ahead — plan intervention, not emergency
Capacity
Shop Capacity and Demand Modeling
Maintenance demand forecast across all vehicles plotted against technician availability and bay capacity. Scheduling optimizer distributes PM work orders across available windows — preventing the shop capacity conflicts that force PM deferrals and create downstream failure risk.
PM deferrals from shop capacity conflicts eliminated
Contingency
Fleet Availability Scenario Planning
Model "what if X% of fleet is unavailable" scenarios — identifying coverage gaps, contract risk, and optimal vehicle reallocation before the event occurs. Pre-designed contingency responses for common disruption scenarios replace reactive improvisation.
Crisis response designed before the crisis, not during it
CapEx
Fleet Lifecycle and Replacement Modeling
Cumulative repair cost versus replacement cost modeled per vehicle. Digital twin lifecycle simulation shows when a vehicle crosses the economic replacement threshold — providing the data-driven evidence for CapEx requests that financial decision-makers require.
Vehicle replacement decisions backed by simulation data
Before vs After
Traditional Fleet Planning vs. Digital Twin Simulation
| Planning Decision | Without Digital Twin | With Oxmaint Digital Twin |
| Maintenance timing |
Experience and calendar intervals |
Failure probability simulation per vehicle |
| Deferred PM risk |
Unknown until failure occurs |
Quantified — cost and probability modeled |
| Fleet composition change |
Financial model only — no condition data |
Full simulation including vehicle condition impact |
| Shop capacity planning |
Discovered as conflicts arise |
Demand modeled against capacity 90 days ahead |
| Cascade failure response |
Reactive — no pre-modeled contingency |
Pre-designed response plans for modeled scenarios |
| Vehicle replacement decision |
Budget cycle guesswork |
Repair vs. replace simulation with actual cost data |
| Component failure lead time |
Discovered at inspection or breakdown |
Forecast 2–8 weeks ahead with 91% accuracy |
Documented Outcomes
What Fleet Operations Report After Digital Twin Deployment
35%
Unplanned Downtime Reduction
Simulation-driven maintenance timing eliminates the surprise failures that calendar PM misses on high-utilization vehicles
28%
Maintenance Cost Improvement
Condition-based intervention replaces over-maintenance on low-risk vehicles and under-maintenance on high-risk ones simultaneously
91%
Component Failure Prediction Accuracy
After 90-day model training period on fleet-specific data — failure forecast accuracy on monitored brake, engine, and drivetrain components
22%
Fleet Availability Improvement
More vehicles available for dispatch more days per year — result of PM deferrals eliminated and unplanned downtime reduced through simulation-driven scheduling
Common Questions
Fleet Digital Twin — Questions Answered
How long does it take to build a fleet digital twin — and how much historical data do you need?+
Level 1 and 2 digital twins (descriptive and informative) can be established within 2–4 weeks by importing existing asset records and connecting telematics integrations. Level 3 predictive capability requires 60–90 days of synchronized operational data for ML model training — after which failure prediction accuracy reaches 85–91% on monitored component types. Fleets with existing CMMS maintenance records can accelerate Level 3 training by importing historical work order data.
Book a demo to assess your starting data position.
Does fleet digital twin work for mixed fleets with different vehicle types and ages?+
Yes — mixed fleets are where digital twin capability delivers the most differentiated value. Each vehicle has its own twin model trained on its specific make, model, year, utilization pattern, and maintenance history — so a 2019 heavy-duty truck and a 2023 light commercial van are modeled independently rather than averaged together. Failure prediction models adapt to vehicle-specific wear curves. The simulation engine then models the entire mixed fleet as a system — identifying which vehicle types cluster around similar maintenance windows and optimizing scheduling across the diversity.
What telematics and data systems does Oxmaint's digital twin integrate with?+
Oxmaint integrates with the major fleet telematics platforms via API — including Samsara, Geotab, Verizon Connect, Motive, Trimble, and Fleet Complete. For vehicles without telematics hardware, OBD-II plug-in devices provide the data stream needed for Level 2 and 3 twin capability at under $25 per vehicle. Existing CMMS, ERP, and fuel management systems integrate via API to provide the complete data picture the simulation models require. Integration setup typically takes 1–3 weeks depending on the number of source systems.
Is fleet digital twin technology only viable for large fleets?+
No — the ROI case is actually strongest for mid-size fleets of 25–200 vehicles where each vehicle represents a significant operational dependency and manual tracking is already breaking down. Very large enterprise fleets (1,000+ vehicles) have traditionally been the early adopters, but 2026 pricing and cloud-delivered architecture have made fleet digital twin accessible to operations with as few as 15 vehicles. The simulation value — knowing that vehicle 14 has a 78% brake failure probability in the next 12 days — is equally high whether you operate 15 vehicles or 1,500.
Start a free trial to see how Oxmaint scales to your fleet size.
Fleet Simulation Platform
Stop Making Fleet Decisions on Instinct. Start Simulating Them First.
Oxmaint's fleet digital twin module gives every vehicle a live virtual replica — synchronizing telematics, sensor data, and maintenance records into simulation models that forecast failures, test maintenance scenarios, and optimize scheduling decisions before they affect your physical fleet.