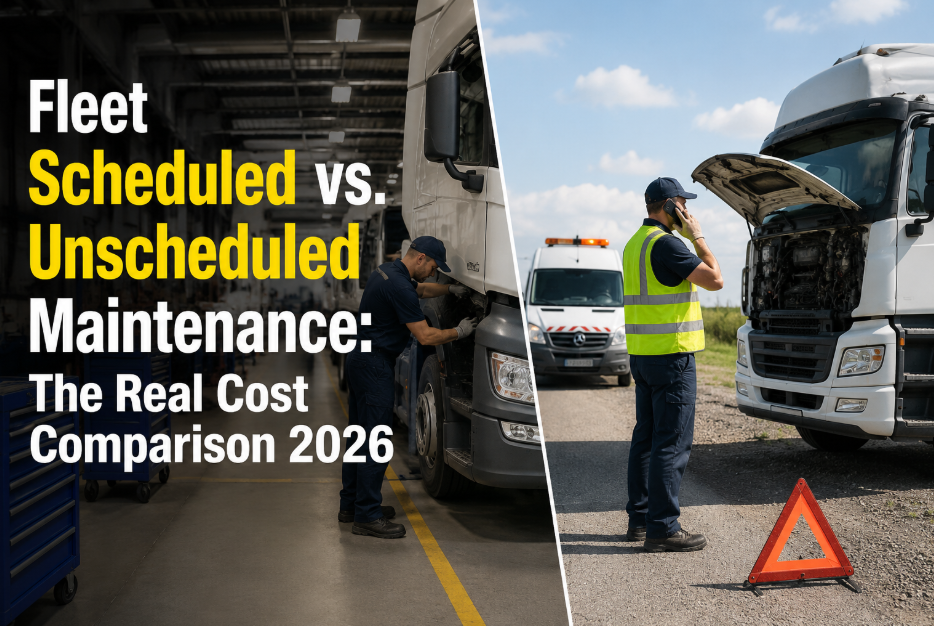
Fleet emergency repair cost typically runs 3 to 5 times higher than the same job performed on a planned schedule — and for some breakdowns the multiplier exceeds 8× once towing, overtime, and downtime are factored in. The gap between emergency vs planned repair fleet maintenance is the single biggest controllable expense in fleet operations today, yet most shops still run 60% reactive. Shifting that ratio toward planned work is where documented savings live, and OxMaint's AI-powered CMMS makes that shift measurable, repeatable, and fast. Ready to see the numbers for your fleet? Start Free Trial and track your planned-to-emergency ratio from day one.
Fleet Repair Cost Analysis
Every emergency fleet repair costs 3–5× the same planned job. What's your multiplier?
The fleet repair cost multiplier between emergency and planned maintenance is the hidden line item draining maintenance budgets. When a $1,200 scheduled brake job becomes a $4,800 roadside emergency, the math speaks for itself. OxMaint turns reactive fleets into planned-work-dominant operations.
Reactive / Emergency
$4,800
Roadside call · 6 hr downtime · overtime labor · premium parts · towing
Planned / Scheduled
$1,200
In-shop · 1.5 hr · standard labor rate · stocked parts · zero towing
3–5×
Emergency vs Planned Multiplier
60%
Avg Fleet Reactive Work Ratio
$1.2M
Annual Overspend — 200-Vehicle Fleet
The True Cost Gap
Emergency vs planned fleet repair cost: where the 3–5× multiplier comes from
Industry studies from fleet maintenance associations and ISO 55000-aligned reliability programs consistently show that emergency repair cost fleet operations incur runs three to five times the price of the identical planned repair. The fleet emergency repair cost multiplier is not a single charge — it is a stack of compounding cost layers that never appear on a planned work order.
1.5–2.5×
Labor & Overtime
Emergency repairs trigger overtime, night shifts, and weekend premiums. A $85/hr standard rate jumps to $127–170/hr. Technicians are pulled from scheduled work, creating a domino effect of deferred PMs.
1.3–2×
Parts Premium & Expediting
Same-day or next-flight parts carry 30–100% markups over stocked inventory. Planned repairs let you order at standard pricing and hold safety stock. Emergency fleet repair cost soars when parts are air-freighted.
$800–2,500
Towing & Road Service
A Class 8 truck tow runs $800–2,500 per incident. Roadside service calls add mobile labor at premium rates. Planned repairs eliminate this cost entirely — it is zero on a scheduled work order.
$1,200–4,000/day
Downtime Revenue Loss
An idle truck generates zero revenue while fixed costs continue. A refrigerated trailer breakdown can spoil a full load ($15K–50K). Planned repairs are scheduled during off-hours or low-demand windows.
Worked Example
A 200-vehicle fleet: planned vs emergency repair cost comparison
Consider a regional delivery operator running 200 trucks. They average 1,400 repair events per year — currently 65% reactive. Here is what happens when the same repair events shift from emergency to planned.
| Repair Type |
Avg Cost per Event |
Annual Events (200 fleet) |
Annual Cost |
Multiplier vs Planned |
| Planned / PM Repair |
$820 |
910 events |
$746,200 |
1.0× |
| Mixed / Unplanned |
$1,950 |
350 events |
$682,500 |
2.4× |
| Emergency / Breakdown |
$3,850 |
140 events |
$539,000 |
4.7× |
| Current State — 65% Reactive |
— |
1,400 |
$1,967,700 |
2.6× blended |
| Target State — 80% Planned |
— |
1,400 |
$1,244,400 |
1.5× blended |
$723,300
Annual savings by shifting from 65% reactive to 80% planned work — a 37% reduction in total fleet maintenance spend, achievable in 12–18 months with disciplined PM scheduling and CMMS-driven work-order automation.
Cost Drivers
What drives fleet reactive repair cost so much higher than planned?
The fleet repair cost multiplier is not arbitrary — it is the sum of six predictable cost accelerators that fire simultaneously during every emergency event. Understanding each one is the first step toward eliminating it.
01
Scheduling chaos and labor reallocation
When a truck breaks down, planned work gets pushed. Three PMs scheduled for that day are deferred — each one becoming a future emergency. The cost of the original breakdown is only the tip; the ripple cost across the deferred work order backlog adds 15–25% more.
02
Diagnostic time under pressure
A planned repair arrives with a known fault code, parts pulled, and a service procedure ready. An emergency repair starts from scratch — technicians spend 45–90 minutes diagnosing before turning a wrench. That diagnostic labor is billed at premium rates.
03
Collateral damage from deferred maintenance
A skipped $45 oil sample becomes a $14,000 engine overhaul. A deferred $180 brake pad replacement becomes a $2,600 rotor, caliper, and drum replacement. Emergency repairs almost always cost more because the underlying component has failed catastrophically, damaging adjacent systems.
04
CSA violations and compliance exposure
Emergency roadside repairs often trigger DOT inspections. A CSA violation for a broken component that was on the PM schedule costs $1,000–5,000 in fines, plus a hit to the carrier's Safety Measurement System score that raises insurance premiums by 8–15%.
05
Spare-parts stockout expediting
When a planned repair is scheduled, parts are pre-staged. When an emergency hits, the part is rarely on the shelf — triggering next-day air freight ($150–400 per shipment), aftermarket substitution at premium pricing, or cannibalizing another asset.
06
Lost revenue and customer SLA penalties
A single breakdown on a time-critical route can trigger $500–5,000 in SLA penalties, lost payload, or reefer load spoilage. Planned repairs happen during scheduled downtime windows, protecting delivery commitments and revenue.
CMMS Transformation
How OxMaint cuts fleet emergency maintenance cost through planned work discipline
OxMaint is an AI-powered CMMS and EAM platform built to move fleets from reactive firefighting to planned-work-dominant cost structures. Every capability maps directly to a specific cost multiplier — here is how the transformation works.
AI-Driven PM Scheduling
OxMaint's predictive engine analyzes usage patterns, telematics data, and failure history to auto-generate PM work orders before breakdowns occur. Fleets report a 30–50% reduction in unplanned downtime within 90 days of deployment.
Outcome: Shift planned-vs-unplanned ratio from 35/65 to 80/20
Cost Multiplier Analytics
Every work order in OxMaint tags as planned or emergency with automatic cost attribution — labor, parts, towing, downtime. Real-time dashboards show your fleet emergency repair cost multiplier by asset, route, and technician, so you can target the worst offenders.
Outcome: Full visibility into every dollar of reactive overspend
Spare-Parts Pre-Staging
OxMaint links each PM template to a bill of materials and auto-reserves parts from inventory when a work order is generated. No more emergency air-freight charges — parts are on the shelf, picked, and staged before the truck enters the bay.
Outcome: Eliminate 90% of parts expediting fees
FMCSA & CSA Compliance Tracking
OxMaint maintains a complete digital audit trail of every inspection, PM, and repair — FMCSA-ready and DOT-inspectable. Automated DVIR workflows catch defects before they become roadside violations, protecting your SMS score and insurance rates.
Outcome: Reduce CSA violations by 40–60% and avoid $1K–5K fines
Implementation Path
From reactive to planned: a 6-month fleet maintenance cost reduction timeline
The shift from emergency-dominated to planned-work-dominant maintenance does not happen overnight — but with OxMaint's CMMS infrastructure, a measurable transformation occurs in 6 months. Here is the documented path.
Month 1
Asset registry & baseline
Import all vehicles, equipment, and maintenance history into OxMaint. Establish your current planned-vs-emergency ratio and cost multiplier baseline. Most fleets discover their true reactive ratio is 10–15% worse than estimated.
Month 2
PM strategy & templates
Build PM templates for every asset class — A, B, C, D service levels tied to mileage, hours, or calendar intervals. OxMaint auto-generates work orders based on telematics triggers, eliminating manual scheduling gaps.
Month 3
Parts inventory alignment
Link BOMs to PM templates. Set min/max stock levels with auto-reorder. OxMaint flags low-stock parts before they trigger an emergency purchase. Parts expediting costs begin dropping immediately.
Month 4
Predictive maintenance activation
OxMaint's AI engine begins predicting failures based on accumulated data — vibration trends, oil analysis, temperature anomalies, and usage patterns. Early-warning work orders intercept failures 7–21 days before breakdown.
Month 5
Ratio optimization
Planned-vs-unplanned ratio typically reaches 65–70% planned. Cost multiplier dashboards show real savings. Fleet managers use OxMaint analytics to identify repeat-offender assets and routes for targeted intervention.
Month 6
Sustained 80/20 ratio
Fleets reach 75–85% planned work. Emergency repair cost drops 35–50% from baseline. Total maintenance spend reduced 20–30%. The CMMS becomes self-reinforcing — planned work generates data that prevents future emergencies.
See exactly how much your fleet overspends on emergency repairs
Book a 30-minute demo and we'll load your asset data, calculate your current cost multiplier, and show you the savings path to 80% planned work.
Frequently Asked Questions
Fleet emergency vs planned repair cost: your questions answered
How much more does an emergency fleet repair cost compared to a planned repair?
The documented fleet emergency repair cost multiplier ranges from 3× to 5× the same planned repair, and can exceed 8× for catastrophic failures involving towing, load loss, and collateral damage. A brake job that costs $1,200 planned typically runs $3,600–6,000 as an emergency roadside event once overtime labor, premium parts, towing, and downtime are included. You can see your exact multiplier in OxMaint —
Start Free Trial to calculate it automatically.
What is a good planned-to-emergency maintenance ratio for a fleet?
World-class fleet maintenance operations target 80% planned work and 20% reactive. The industry average sits at 40% planned and 60% reactive, which is why most fleets overspend on emergency repairs. OxMaint's PM automation and predictive analytics help fleets reach the 80/20 benchmark within 6 months of implementation by auto-generating work orders from telematics triggers and failure-prediction models.
How do I calculate my fleet's emergency repair cost multiplier?
Divide your average emergency repair cost per event by your average planned repair cost per event for the same repair type. For example, if alternator replacements average $1,850 as emergencies and $520 as planned work, your multiplier is 3.6×. OxMaint tags every work order as planned or emergency and calculates this multiplier automatically by asset class, repair type, and time period.
Can a CMMS really reduce emergency fleet repair costs?
Yes — a CMMS like OxMaint reduces emergency repair cost by enforcing PM schedule compliance, pre-staging parts, predicting failures before they occur, and providing cost-multiplier visibility that drives accountability. Documented results show 30–50% reductions in unplanned downtime and 20–30% reductions in total maintenance spend within 6–12 months. The key is moving from calendar-based PMs to usage-based and predictive PMs driven by real asset data.
Book a Demo to see the workflow on your assets.
What are the hidden costs of fleet reactive repair beyond the invoice?
Beyond the direct labor and parts invoice, fleet reactive repair cost includes towing ($800–2,500), downtime revenue loss ($1,200–4,000/day), SLA penalties ($500–5,000), CSA fines ($1,000–5,000), deferred-PM domino effects (15–25% added cost), insurance premium increases (8–15%), and technician reallocation from scheduled work. The full loaded cost of an emergency is typically 2–3× the shop invoice alone.
Stop paying 3–5× for repairs you could have planned
OxMaint's AI-powered CMMS transforms reactive fleets into planned-work-dominant operations — cutting emergency repair cost 35–50% and total maintenance spend 20–30% within 6 months.
Free 14-day trial · No credit card