The maintenance cost gap between scheduled and unscheduled fleet repairs is not a marginal difference — it is a multiplier that compounds across every vehicle, every quarter, and every fiscal year. Industry data from the American Trucking Associations and fleet management benchmarking studies consistently show that unscheduled maintenance events cost between 3x and 9x more than the equivalent planned repair when total cost is calculated: the repair itself, the emergency labor premium, the tow or roadside service call, the replacement vehicle deployment, the missed delivery penalties, the driver idle time, and the administrative overhead of reactive dispatch disruption. A 2025 TMC/FleetNet America analysis found that the average roadside breakdown costs $764 in direct repair charges alone — before adding $1,200-$2,800 in downstream operational costs per event. For a 100-vehicle fleet averaging 2.3 unscheduled breakdowns per vehicle per year, the annual reactive maintenance premium reaches $450,000-$820,000 above what a fully planned maintenance program would cost. Yet most fleets still operate with a 40-60% reactive maintenance ratio, meaning nearly half of all maintenance spend carries the unplanned cost multiplier. The root cause is not that fleet managers prefer reactive work — it is that they lack the scheduling infrastructure, automated PM triggers, and real-time asset condition visibility needed to shift the ratio toward planned work. Oxmaint provides the CMMS infrastructure that systematically converts reactive maintenance into scheduled preventive work — reducing unplanned events by 35-50% in the first year and shifting fleet maintenance economics permanently. If your fleet's unscheduled maintenance ratio exceeds 30%, start a free trial or book a demo to see how CMMS-driven scheduling changes the cost equation for your operation.
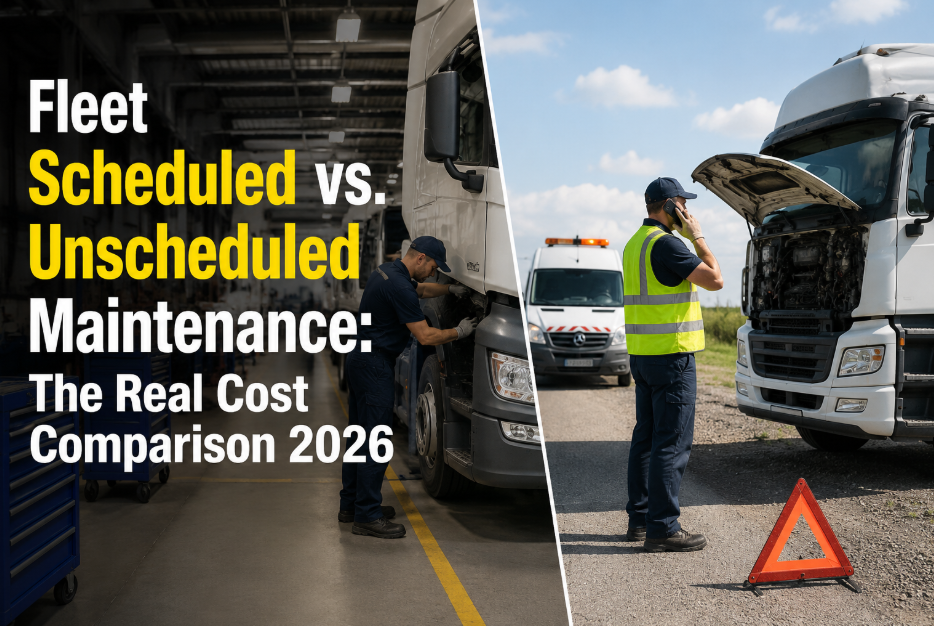
Fleet Scheduled vs. Unscheduled Maintenance: The Real Cost Comparison 2026
Unscheduled fleet maintenance costs 3-9x more than planned work. This analysis breaks down the true cost difference and shows how CMMS shifts the ratio toward planned maintenance — permanently.
The Most Expensive Maintenance Is the Maintenance You Did Not Plan
Every unscheduled repair carries hidden costs that never appear on the repair invoice: the emergency dispatch disruption, the customer delivery missed, the replacement vehicle miles, the overtime labor premium, the parts expediting charge, and the administrative time spent reacting instead of managing. Scheduled maintenance costs are predictable, budgetable, and optimizable. Unscheduled maintenance costs are none of those things. Oxmaint gives fleet managers the PM scheduling, mileage-based triggers, and condition tracking that systematically moves maintenance work from the reactive column to the planned column — where it costs 3-9x less per event. See what your fleet's true cost shift would look like with automated PM scheduling — start a free trial or book a demo to run the numbers for your fleet size.
The True Cost of a Scheduled Repair vs. an Unscheduled Breakdown
The invoice amount for the repair itself represents only 23-35% of the total cost of an unscheduled maintenance event. The remaining 65-77% is operational disruption cost that is real, measurable, and avoidable — but invisible to fleets that only track repair invoices. Here is the full cost anatomy of both scenarios for the same repair: replacing brake pads on a Class 8 tractor.
Six Hidden Cost Categories That Make Unscheduled Maintenance 3-9x More Expensive
The average Class 8 tow charge is $350-$550 depending on distance and time of day. After-hours tows add 30-50% premiums. A fleet averaging 2.3 breakdowns per vehicle annually spends $80,500-$126,500 on tow charges alone for a 100-vehicle fleet — a cost category that does not exist in a scheduled maintenance program.
Roadside and after-hours repair labor rates run 40-65% higher than standard shop rates. A repair that costs $225 in scheduled labor becomes $370-$405 as an emergency call. Across hundreds of annual repairs, the labor premium alone accounts for 15-22% of the total unscheduled maintenance cost gap.
Scheduled maintenance is performed during non-revenue hours — overnight, weekends, or planned shop days. Unscheduled breakdowns happen during active operations, converting revenue-generating hours into idle time. At $150-$200 per hour in revenue capacity per vehicle, an 8-hour unscheduled downtime event costs $1,200-$1,600 in lost productivity that scheduled work avoids entirely.
One unscheduled breakdown does not affect one route — it disrupts the dispatch plan for multiple vehicles. The replacement vehicle redeployment, the route reassignment, the customer notification cascade, and the dispatcher's time managing the disruption affect 3-5 routes per breakdown event. This multiplier effect is invisible in repair cost tracking but real in operational impact.
Scheduled repairs use standard parts ordering with 2-5 day lead times at standard pricing. Unscheduled repairs require immediate parts availability — and when the needed part is not in stock at the roadside facility, overnight freight charges of $75-$200 per shipment are added. Parts expediting premiums account for 8-14% of the cost gap between planned and reactive repairs.
Components that fail catastrophically because preventive replacement was not scheduled cause secondary damage that multiplies the repair scope. Brake pads worn to metal damage rotors ($335 additional). A failed water pump that causes overheating damages head gaskets ($2,800 additional). The repair bill for the primary failure plus secondary damage averages 2.2x the cost of replacing the primary component on schedule.
Annual Cost Impact: Reactive vs. Planned Maintenance by Fleet Size
The per-event cost multiplier compounds dramatically at fleet scale. These projections use industry-average breakdown rates (2.3 unscheduled events per vehicle per year), average cost multipliers (4.8x for unscheduled vs. scheduled), and standard fleet operating costs to show the annual financial impact of reactive maintenance ratios.
| Fleet Size | Annual Unscheduled Events (at 47% reactive ratio) | Annual Reactive Premium | Annual Savings at 20% Reactive Ratio | 5-Year Cumulative Savings |
|---|---|---|---|---|
| 25 vehicles | 27 events | $93,500 | $53,800 | $269,000 |
| 50 vehicles | 54 events | $187,000 | $107,600 | $538,000 |
| 100 vehicles | 108 events | $374,000 | $215,200 | $1,076,000 |
| 250 vehicles | 271 events | $935,000 | $538,000 | $2,690,000 |
| 500 vehicles | 542 events | $1,870,000 | $1,076,000 | $5,380,000 |
How Oxmaint Shifts the Maintenance Ratio from Reactive to Planned
The scheduled-to-unscheduled maintenance ratio is not a fixed characteristic of a fleet — it is a direct output of the maintenance management system in place. Fleets using paper-based or spreadsheet tracking consistently operate at 40-60% reactive because the scheduling infrastructure cannot scale. Oxmaint provides the automated PM scheduling, mileage/hour-based triggers, condition tracking, and work order management that systematically moves work from unscheduled to scheduled — where every event costs 3-9x less. Fleets ready to shift their maintenance economics can start a free trial or book a demo to see how the PM scheduling engine works at their fleet scale.
Configure PM schedules for every vehicle and every maintenance task — oil changes, brake inspections, tire rotations, transmission service, coolant flush — triggered by odometer reading, engine hours, or calendar interval. The system generates the work order automatically when the trigger threshold is reached, eliminating the manual tracking that causes PM tasks to be missed or delayed.
Each vehicle and major component carries a condition score updated by inspection results, repair history, and age-based degradation models. When a component's condition score drops below the intervention threshold, Oxmaint generates a planned repair work order — catching the failure in the scheduled window before it becomes an unscheduled roadside event.
Every maintenance event — scheduled or unscheduled — is captured as a work order with complete cost data: parts, labor hours, labor rate, vendor charges, tow fees, and downtime duration. This creates the dataset that shows fleet managers exactly where their scheduled vs. unscheduled cost ratio stands and which vehicle groups generate the most reactive maintenance spend.
Digital inspection checklists capture driver-reported defects and condition observations at every trip start and end. Defect reports automatically create work orders in the maintenance queue — converting driver observations into planned maintenance actions before the defect progresses to a breakdown. Fleets using digital inspections report 28% fewer unscheduled events in the first 6 months.
Real-time dashboard tracking shows the fleet's scheduled-to-unscheduled maintenance ratio by month, by vehicle group, by maintenance category, and by terminal location. Fleet managers can see the ratio shifting toward planned work over time and identify specific vehicle groups or maintenance categories where reactive work remains disproportionately high — targeting improvement efforts where they generate the most cost reduction.
When maintenance is scheduled, parts requirements are known in advance. Oxmaint's spare parts inventory module links PM schedules to parts demand forecasting — ensuring that the brake pads, filters, belts, and fluids needed for upcoming scheduled work are in stock at standard pricing instead of sourced on emergency expedite at premium cost. Parts readiness is a prerequisite of scheduled maintenance that reactive programs cannot achieve.
Where Does Your Fleet Stand? Scheduled vs. Unscheduled Maintenance Ratio Benchmarks
Maintenance is driven by breakdowns. No systematic PM scheduling. Cost per mile is 40-65% above industry average. Downtime exceeds 15% of available vehicle-days. CSA scores are elevated from inspection failures.
PM programs exist but are inconsistently executed. Some vehicles on schedule, others reactive. Cost per mile is 20-40% above benchmark. Breakdowns still disrupt operations 2-3 times per week for a 100-vehicle fleet.
CMMS-driven PM with mileage/hour triggers. Most maintenance is planned. Cost per mile is at or below industry benchmark. Downtime under 5% of available vehicle-days. Breakdowns are exceptions, not routine.
Predictive and condition-based maintenance integrated with CMMS. Failures are anticipated and prevented. Cost per mile is 20-30% below industry average. Vehicle availability exceeds 95%. Maintenance is a competitive advantage.
Fleet Outcomes After Implementing CMMS-Driven PM Scheduling
Fleets implementing Oxmaint PM scheduling reduce roadside breakdowns and unscheduled shop visits by 35-50% within 12 months of full deployment
Net savings after CMMS subscription cost — driven by reduced tow charges, eliminated emergency labor premiums, and lower parts expediting costs
Shifting the ratio from 47% reactive to under 25% reactive reduces cost-per-mile from $0.22 to $0.17 average across mixed fleet types
Up from 87% average pre-implementation — fewer unscheduled events mean more vehicles available for revenue operations every day
Frequently Asked Questions
How quickly can a fleet shift from 47% reactive to under 25%?+
Does increasing scheduled maintenance create more total maintenance events?+
What maintenance categories generate the highest scheduled-to-unscheduled cost differential?+
How does Oxmaint track the actual cost ratio for reporting to leadership?+
Every Unscheduled Repair Costs Your Fleet 3-9x More Than It Should
The math is clear: fleets that schedule maintenance spend dramatically less per event, lose fewer revenue hours, and operate more vehicles more days per year. The only barrier between your current reactive ratio and a planned maintenance program is the scheduling infrastructure. Oxmaint provides that infrastructure — automated PM triggers, mileage-based scheduling, condition tracking, digital inspections, and cost analytics — with no heavy implementation and first PM work orders generating in week one.