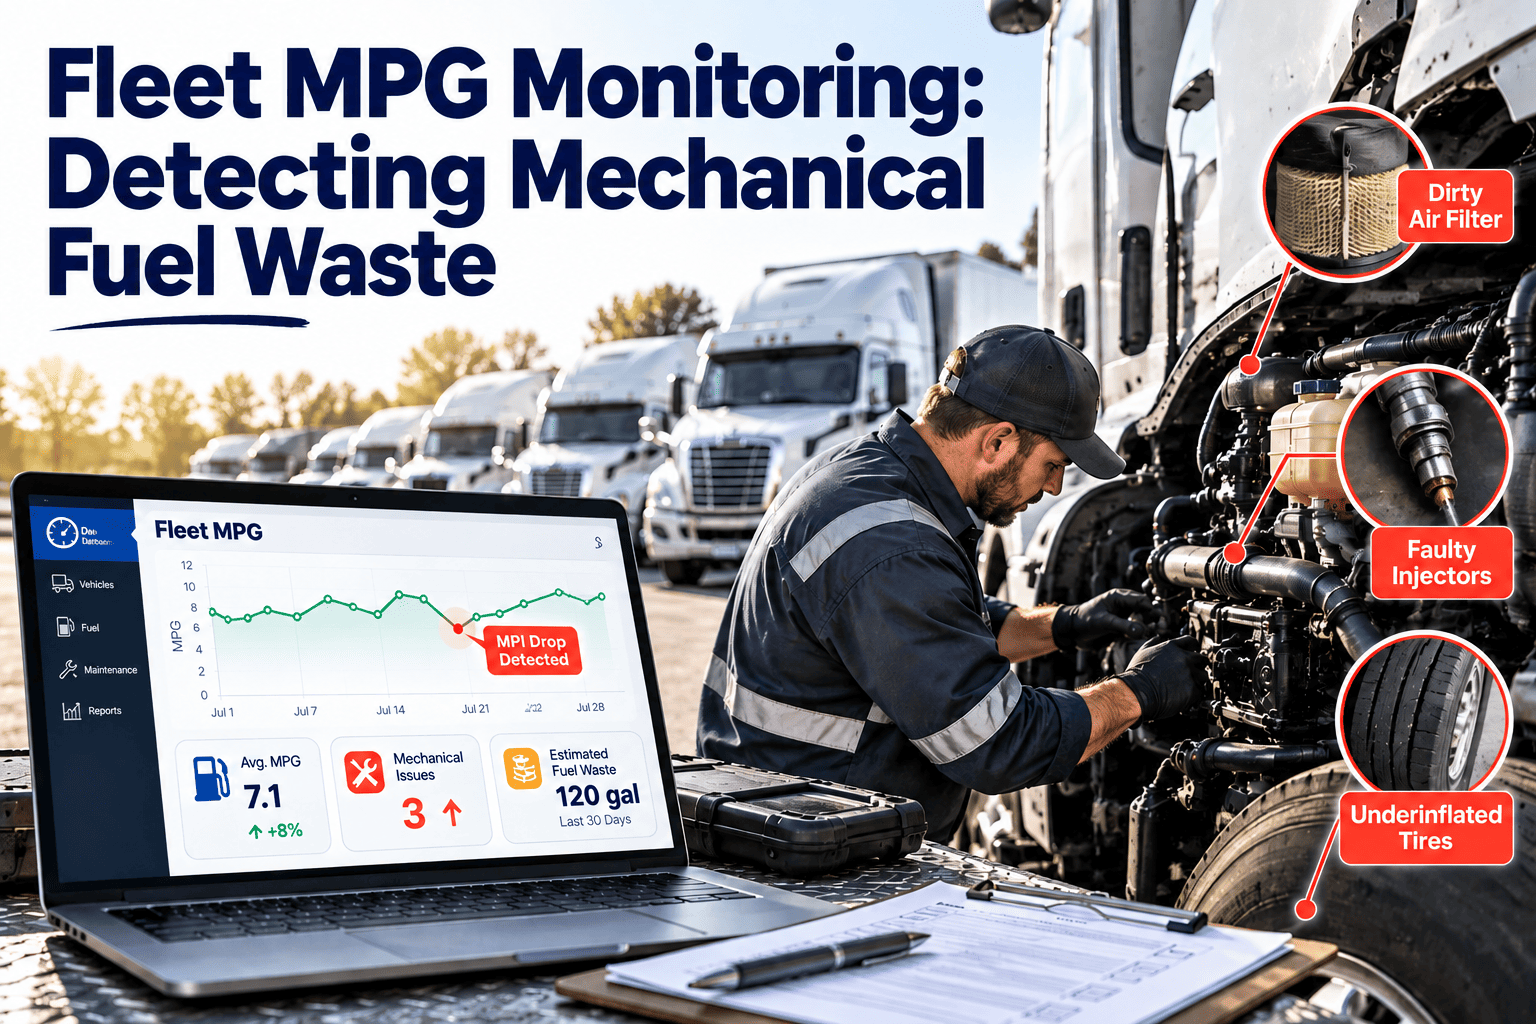
Fuel is usually the largest or second largest operating cost in a fleet, and a drop in miles per gallon is easy to blame on drivers. In practice, many MPG losses start in the shop: soft tires, a restricted air filter, a failing injector, a stuck cooling fan, or an aftertreatment system that regenerates too often. Fuel data tells you that something changed; maintenance data tells you what. This guide shows how to turn MPG monitoring into a mechanical diagnosis workflow, supported by Oxmaint work order and asset management tools that keep each finding tied to a vehicle.
Fleet MPG Monitoring: Detecting Mechanical Fuel Waste
Use fuel economy trends as an early warning for mechanical faults, then close the loop with inspections, work orders, and verified results.
Behavior explains some fuel loss, but equipment explains the rest
Driver coaching on idling, speed, and hard braking is valuable, yet it cannot fix a dragging brake or a clogged filter. If a unit's MPG falls while the driver, route, and load stay the same, look at the machine first.
Build an MPG baseline you can trust
Bad data creates false alarms and hides real problems. Decide which sources you trust and compare each unit against its own history, not only against a fleet average.
| Data source | Strength | Weakness | Best use |
|---|---|---|---|
| Fuel card transactions | Complete purchase record per unit | Partial fills, shared cards, and odometer entry errors | Cost tracking and fill-to-fill MPG |
| Engine control module data | Direct fuel burn, idle, and PTO hours | Needs a consistent data pull and varies by engine | Mechanical diagnosis and idle analysis |
| Telematics | Frequent location, speed, and trip data | Dependent on device health and configuration | Route, speed, and behavior context |
| Work order history | Records what was changed and when | Only as good as the notes technicians enter | Linking MPG shifts to repairs |
Normalize before you compare
- Group vehicles by class, engine, duty cycle, and typical load.
- Separate highway, urban, and idle-heavy work.
- Adjust expectations for season, since cold weather and winter fuel can lower fuel economy.
- Exclude fills with known data errors rather than letting them skew the trend.
What the shape of the MPG trend suggests
The pattern of the decline narrows the list of suspects before anyone opens a hood.
Mechanical causes of fuel waste and how to check them
Use this table to turn an MPG flag into a targeted inspection. Specific specifications and limits come from your manufacturer service information.
| Cause | Why fuel burn rises | Inspection check | Corrective action |
|---|---|---|---|
| Low tire pressure | Higher rolling resistance forces the engine to work harder | Cold pressure check on all positions, including duals | Inflate, repair leaks, and review tire pressure monitoring |
| Misalignment or dragging brakes | Added resistance at the wheels and uneven tire wear | Alignment check, wheel-end heat, brake adjustment | Align, adjust, or service the brake components |
| Restricted air intake | Poor airflow upsets combustion efficiency | Air filter condition and restriction indicator | Replace the filter and inspect the intake path |
| Fuel system faults | Worn or leaking injectors and weak fuel delivery waste fuel | Fault codes, fuel pressure, and injector balance data | Diagnose and repair the fuel system component |
| Frequent aftertreatment regeneration | Regeneration events consume extra fuel | Regen frequency, soot load, and sensor readings | Resolve the root cause such as sensor or EGR faults |
| Cooling fan stuck on | A fan running constantly draws engine power | Fan clutch operation and coolant temperature behavior | Repair the fan control or clutch |
| Thermostat or temperature faults | An engine that runs cold operates less efficiently | Coolant temperature data over a normal drive | Replace the thermostat or related sensor |
| Aerodynamic damage | Loose or missing fairings and gap issues increase drag | Visual walk-around of roof, side, and trailer devices | Repair or replace the damaged fairings |
| Incorrect lubricant specification | Heavier oils and gear lubricants can add friction | Confirm viscosity grades on recent work orders | Use the manufacturer-specified products |
Connect the fuel report to the work order that fixes it
See how an MPG flag can become an inspection, a repair, and a measured result inside one asset record.
A six-step routine for any flagged unit
Consistency matters more than sophistication. Give technicians a short routine they can run on every flagged vehicle.
Set alerts that technicians will not ignore
Too many alerts get muted. Tune thresholds to your own fleet, and begin with a small number of high-confidence rules like the illustrative ones below.
What changes when fuel data drives maintenance
Preventive maintenance that protects fuel economy
Many fuel losses can be prevented by tasks already in the PM plan. Make sure they are done on time and recorded.
- Check tire pressure and tread condition at every inspection, including duals and trailers.
- Replace air, fuel, and oil filters at the specified intervals.
- Inspect alignment, wheel ends, and brake adjustment regularly.
- Walk around the unit for loose fairings, damaged panels, and trailer gap issues.
- Review fault codes and sensor health during scheduled services.
- Use the specified lubricants and record them on the work order.
Electric and mixed fleets
- Track energy use per mile alongside miles per gallon for combustion units.
- Watch tire condition, cabin heating and cooling use, and charging behavior.
- Log battery and charging inspections as scheduled tasks on the same asset record.
KPIs for mechanical fuel waste
Regeneration frequency is an MPG clue hiding in plain sight
Modern diesel engines clean their particulate filters through regeneration, and that process uses extra fuel. A healthy system regenerates at a steady, modest rate.
Tires deserve their own fuel economy routine
Tires touch every mile the vehicle drives, so small problems repeat constantly. A simple routine pays back in both fuel and tire life.
- Check cold pressure on a fixed schedule and after any tire repair or replacement.
- Compare dual tires for matched size and wear, since mismatches increase drag and heat.
- Record tread depth and rotation or replacement dates on the asset record.
- Investigate irregular wear as a sign of alignment, suspension, or inflation issues.
- Consider tire pressure monitoring or inflation systems where the duty cycle justifies them.
Separating idle time from driving efficiency
Fuel burned while stationary lowers reported MPG without any change in how the vehicle drives. Separate the two before judging a unit.
A seasonal checklist for fuel economy
| Season | Common effect | Maintenance focus |
|---|---|---|
| Cold months | Longer warm-up, denser air, and winter fuel blends can lower MPG | Thermostats, block heaters, fuel filters, and tire pressure after temperature drops |
| Hot months | Higher cooling and air conditioning load | Cooling system health, fan operation, and condenser cleanliness |
| Wet or muddy periods | Added rolling resistance and wheel-end wear | Brake adjustment, wheel-end inspection, and underbody cleaning |
| Dusty periods | Faster air filter loading | Intake restriction checks and filter replacement timing |
Closing the loop so fixes are proven, not assumed
A repair is only complete for fuel purposes when the numbers confirm it. Build the check into the work order itself.
- Record the pre-repair MPG baseline on the work order at the time it is opened.
- Set a follow-up date or mileage point for the post-repair comparison.
- Note whether the result matched expectations, and why not if it did not.
- If MPG stays low, reopen the investigation rather than closing the file.
- Summarize results by cause so the shop learns which fixes deliver the most.
Using drivers as the first line of mechanical detection
Drivers notice changes before any report does: a vehicle that feels sluggish, a fan that runs too long, a dash light that comes and goes. Make it easy for them to say so.
- Include a short performance question in the pre-trip or post-trip inspection form.
- Convert reported symptoms into work orders so they are tracked rather than forgotten.
- Share the outcome with the driver, which encourages future reports.
Supporting MPG diagnosis with maintenance software
Oxmaint is not a fuel card or telematics product. It organizes the maintenance side so findings become actions.
- Asset records that keep meter readings, service history, and repair notes together for trend review.
- Inspection checklists for tires, filters, aerodynamics, and fault code review.
- Work orders that record the cause, repair, parts, and labor for each fuel-related issue.
- Preventive maintenance schedules that keep efficiency-related tasks on time.
- Reports and dashboards that group repeat causes by vehicle class, location, or technician.
Frequently asked questions
Find the mechanical fault behind the fuel number
Turn MPG variance into inspections, work orders, and verified fixes, and keep every finding on the right asset record.



