Vehicle Health Monitoring via CMMS: Step-by-Step Playbook for Rental Fleets
By Oxmaint on December 16, 2025
A Phoenix car rental operator watched $127,000 in potential revenue vanish in a single quarter—not from lack of customers, but from vehicles sitting in service bays instead of on rent. With a 150-vehicle fleet averaging 8.5 days of unplanned downtime per incident, every breakdown meant another customer walking to the competitor across the street. The industry math is brutal: rental fleets lose $448-$760 per vehicle per day in downtime costs, and with the standard 75-80% utilization benchmark, even small improvements translate directly to bottom-line results. After implementing systematic vehicle health monitoring through CMMS, the same operation reduced unplanned downtime by 67% and pushed utilization from 68% to 79%—recovering over $200,000 in annual revenue.
Rental Fleet Reality Check
Every 1% Utilization Gain = 1.5-2% Revenue Increase
Below 70%Overcapacity
70-74%At Risk
75-80%Optimal
85%+Expand
$448-$760
Daily downtime cost per vehicle
8-12%
Revenue increase from 75% to 85% utilization
67%
Breakdown reduction with predictive monitoring
The rental fleet challenge is fundamentally different from commercial trucking or corporate fleets. Multiple drivers with varying skill levels cycle through each vehicle. Fueling practices are inconsistent. Customer expectations demand immediate availability. And every hour a vehicle sits in your service bay is an hour your competitor is earning revenue from that customer. Vehicle health monitoring transforms this chaos into predictable, manageable operations—but only when implemented as a systematic playbook rather than a collection of disconnected tools.
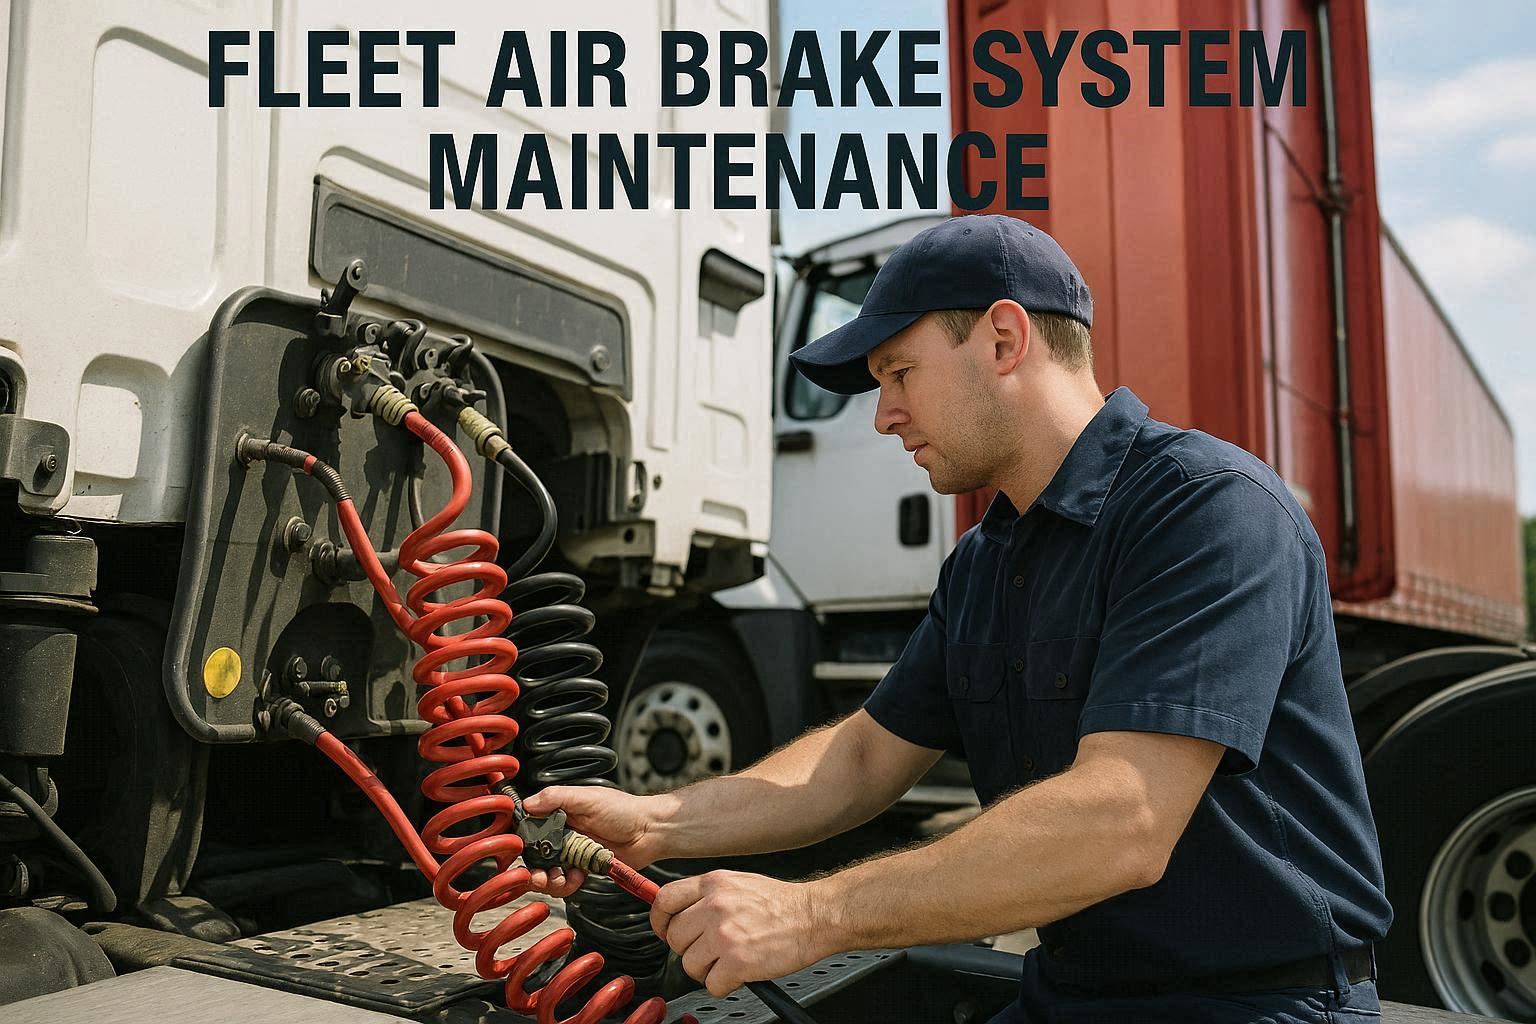
Harden fleet management safety via digital work orders
The predictive maintenance market has reached $10.93 billion in 2024 and is projected to hit $70.73 billion by 2032—a 35%+ annual growth rate driven by proven results that rental operations can no longer ignore. Meanwhile, maintenance costs continue climbing: Q1 2025 data shows average service costs up 4.9% over 2024, following an 11.3% increase the previous year. For rental fleets, where maintenance costs range from $60-$200 per vehicle monthly depending on age and usage, the compound effect of rising costs and lost revenue from downtime creates an urgent need for systematic monitoring.
The 5-Step Vehicle Health Monitoring Playbook
From sensors to revenue—your complete implementation roadmap
1
Asset Registration & Baseline
Days 1-3
Register every vehicle with VIN, acquisition date, mileage, and warranty status. Establish baseline health metrics from OEM specifications. Assign QR codes for instant identification during inspections.
Complete digital fleet registerOEM maintenance schedules loadedWarranty tracking activated
2
Sensor Integration & Alert Configuration
Days 4-10
Connect telematics devices feeding engine diagnostics, battery health, tire pressure, and fluid levels to your CMMS. Configure alert thresholds based on OEM specs and rental-specific stress factors.
Build mobile inspection checklists for return processing, pre-rental checks, and periodic evaluations. Configure automatic work order generation when defects are identified. Enable photo documentation for damage tracking.
Mobile inspection app deployedDefect-to-work-order automationPhoto documentation enabled
4
PM Scheduling & Parts Planning
Days 18-24
Configure preventive maintenance schedules by mileage and time intervals. Integrate spare parts inventory with automatic reorder triggers. Link PM tasks to rental availability calendars to minimize customer impact.
Launch real-time dashboards tracking utilization, downtime, maintenance costs, and fleet health scores. Establish weekly review cadence to identify trends and optimize alert thresholds based on actual performance data.
Live KPI dashboards operationalWeekly optimization reviews scheduledROI tracking enabled
Rental operators ready to implement this playbook can start with a free CMMS platform to build their vehicle monitoring foundation immediately. The 30-day implementation timeline assumes a 50-150 vehicle fleet with existing telematics infrastructure—smaller operations can compress this significantly, while larger fleets may need additional phases for multi-location rollout.
Turning alerts into actions — a fleet management framework with KPIs
Raw alerts without action frameworks create noise, not value. The difference between rental operations that achieve 67% breakdown reduction and those drowning in ignored notifications is a systematic approach to alert prioritization, response protocols, and accountability tracking. Top-performing rental fleets use a tiered response system that matches urgency to business impact.
Alert-to-Action Response Framework
Prioritized responses based on rental availability impact
Critical
Immediate Response
Engine overheatingBrake system failureAirbag warningTransmission fault
Action Protocol
Pull from rental immediately. Create priority work order. Notify customer if on-rent. Target: Back to rental-ready within 24-48 hours.
Urgent
Same-Day Attention
Low battery healthTire pressure deviationOil life below 15%Coolant level low
Action Protocol
Schedule service before next rental. Create work order with parts pre-staged. Complete during return processing if possible.
Scheduled
Planned Maintenance
PM due within 500 milesBrake pad wear 70%+Wiper blade replacementCabin filter change
Action Protocol
Schedule during next low-demand window. Batch similar services for efficiency. Complete within 7-day window.
The framework succeeds when every alert has a clear owner and every action has a measurable outcome. Fleet managers implementing this system should schedule a demo to see how alert automation integrates with work order workflows in practice. The goal isn't zero alerts—it's zero unaddressed alerts that impact rental availability.
Stop Losing Revenue to Preventable Breakdowns
Every vehicle in your service bay is a customer renting from your competitor. Build your vehicle health monitoring system today and start recovering lost utilization revenue.
The KPIs That Actually Matter for Rental Fleet Health
Not all metrics deserve dashboard real estate. After analyzing performance data from rental fleet operations, seven KPIs emerge as the most predictive indicators of vehicle health and overall profitability. These metrics work together as a system: leading indicators predict problems before they impact critical metrics, while financial KPIs validate overall strategy effectiveness.
Rental Fleet Health KPI Dashboard
The 7 metrics that predict profitability
Fleet Utilization Rate
Target: 75-80%
Paid rental days / Total available fleet days
Primary revenue driver—every 1% gain = 1.5-2% revenue increase
DVIR Completion Rate
Target: 95%+
Completed inspections / Required inspections
Catches issues before they become breakdowns
Mean Time Between Failures
Target: 90+ days
Total operating time / Number of failures
Measures predictive maintenance effectiveness
Mean Time to Repair
Target: Under 8 hours
Total repair time / Number of repairs
Directly impacts rental availability window
Maintenance Cost per Vehicle
Target: Under 15% of revenue
Total maintenance spend / Fleet size
Signals fleet age issues and replacement timing
Unplanned Downtime Rate
Target: Under 5%
Unplanned repair days / Total fleet days
The metric predictive maintenance directly reduces
Revenue per Available Vehicle Day
Track trend over time
Total revenue / (Fleet size × Available days)
Ultimate measure of fleet health and strategy success
The industry standard for rental fleets specifies that 72% of vehicles should be on rent at any time, 20% rental-ready in the yard, and no more than 8% non-rental-ready (in maintenance, transit, or repair). Operations that implement digital KPI tracking through CMMS platforms gain real-time visibility into these ratios, enabling immediate action when metrics drift from targets.
Fleet Status Distribution Benchmark
72%On Rent
20%Ready
8%Service
No vehicle should be non-rental-ready for more than 2 weeks. Vehicles exceeding this threshold signal replacement consideration.
Expert Review: What Top Rental Operations Do Differently
Industry Analysis
The Practices That Separate Leaders from Laggards
Rental fleet profitability lives and dies on utilization. Every vehicle sitting in the shop is a customer you're sending to your competitor. What separates profitable rental operations from struggling ones isn't the quality of their vehicles—it's their ability to keep those vehicles on the road. The operators achieving 80%+ utilization aren't lucky; they're systematic about predicting problems before customers experience them.
22.7%
Faster Issue Resolution
Fleet data shows average time to resolve maintenance issues dropped from 11.08 to 8.56 days with systematic CMMS implementation—a direct utilization improvement.
40-60%
Emergency Repair Reduction
Predictive maintenance implementations typically deliver 2-4x ROI within 12-24 months, primarily through emergency repair elimination and improved vehicle availability.
35%
Cost Per Mile Increase Over 10 Years
Fleet benchmark data shows vehicles over 10 years old cost 35% more per mile. CMMS tracking reveals optimal replacement timing before costs escalate.
The technology investment case is straightforward: predictive maintenance implementations deliver 8-12% savings over preventive maintenance alone, and up to 40% savings compared to reactive approaches. For a 100-vehicle rental fleet averaging $150 monthly maintenance cost per vehicle, that's potentially $72,000 annual savings—before accounting for the utilization revenue recovered from reduced downtime. Operations considering this investment should book a consultation to calculate ROI for their specific fleet profile.
Ready to Hit 80% Utilization?
Join rental fleets already using systematic vehicle health monitoring to reduce breakdowns, recover revenue, and keep customers coming back instead of walking to competitors.
Conclusion: From Reactive Chaos to Predictable Profitability
The rental fleet industry has reached an inflection point where vehicle health monitoring capability determines competitive position. Operations that wait for check engine lights before acting will continue losing $448-$760 per vehicle per day in downtime while competitors capture those customers. Operations that implement systematic monitoring—sensor integration, alert frameworks, automated work orders, and KPI dashboards—transform maintenance from a cost center into a revenue protection system.
The 30-day playbook outlined in this guide provides a proven path from reactive chaos to predictable profitability. Starting with a free CMMS platform lets you validate the approach with your specific fleet before expanding investment. The math is compelling: even modest improvements in utilization (68% to 75%) can recover six figures in annual revenue for mid-size rental operations. The question isn't whether to implement vehicle health monitoring—it's how quickly you can get your system operational before the next breakdown sends another customer to your competitor.
Frequently Asked Questions
What utilization rate should rental fleets target for optimal profitability?
Industry benchmarks indicate healthy rental fleet utilization falls between 75-80%, with the standard distribution being 72% on rent, 20% rental-ready in yard, and no more than 8% non-rental-ready (maintenance, transit, or repair). Utilization below 70% typically signals overcapacity—too many vehicles for current demand. Rates consistently above 85% suggest high demand that your fleet can't fully capture, signaling potential expansion opportunity. The critical insight: every 1% improvement in utilization translates to approximately 1.5-2% revenue increase. For a 100-vehicle fleet averaging $100/day rental revenue, moving from 70% to 80% utilization represents over $350,000 in additional annual revenue.
How much does vehicle downtime actually cost rental operations?
Vehicle downtime costs rental fleets $448-$760 per vehicle per day, encompassing both direct costs (lost rental revenue, repair expenses) and indirect costs (customer acquisition to replace lost business, reputation damage from unavailability). Beyond daily losses, extended downtime triggers replacement rental costs averaging $3,000 per month when vehicles can't be serviced quickly. The compounding effect is severe: a 150-vehicle fleet averaging 8.5 days unplanned downtime per incident can lose over $100,000 quarterly in preventable revenue. CMMS implementation with predictive maintenance capabilities typically reduces unplanned downtime by 40-67%, with payback periods of 8-18 months depending on fleet size and current maintenance practices.
What vehicle health metrics should CMMS monitor for rental fleets?
Effective rental fleet CMMS should monitor both real-time sensor data and operational metrics. Critical sensor data includes: engine diagnostics and DTC codes, battery health and charging system status, tire pressure and wear indicators, fluid levels (oil, coolant, brake, transmission), and brake pad/rotor wear. Operational metrics include: mileage-based PM triggers (typically every 5,000-7,500 miles for rental intensity), time-based service intervals, rental cycle counts (stress indicator for high-turnover vehicles), and fuel consumption patterns (efficiency degradation signals problems). The system should auto-generate work orders when any metric crosses configured thresholds, with critical alerts (engine overheating, brake failure) triggering immediate notifications versus scheduled maintenance for routine PM due dates.
How long does CMMS implementation take for rental fleet vehicle monitoring?
A complete vehicle health monitoring system can be operational within 30 days for rental fleets with 50-150 vehicles and existing telematics infrastructure. The implementation phases include: Days 1-3 for asset registration and baseline establishment, Days 4-10 for sensor integration and alert configuration, Days 11-17 for inspection workflow and DVIR automation setup, Days 18-24 for PM scheduling and parts integration, and Days 25-30 for KPI dashboard launch and optimization. Smaller fleets (under 50 vehicles) can compress this timeline significantly, while larger multi-location operations may require additional phases for rollout coordination. Cloud-based CMMS platforms eliminate infrastructure requirements, allowing immediate access without IT projects or hardware installation beyond existing telematics devices.
What ROI can rental fleets expect from predictive maintenance CMMS?
Rental fleet CMMS implementations typically achieve ROI within 8-18 months through multiple value streams. Direct savings include: 40-60% reduction in emergency repairs, 15-25% decrease in total maintenance costs, and 8-12% savings over preventive-only maintenance approaches. Revenue recovery from improved utilization often exceeds cost savings: reducing unplanned downtime by 67% and improving utilization from 68% to 79% recovered over $200,000 annually for one 150-vehicle operation. Additional benefits include: 20-30% improvement in equipment availability, extended vehicle lifecycles (delaying replacement costs), and warranty claim capture through documented service histories. For a 100-vehicle fleet with $150 average monthly maintenance cost per vehicle, conservative 20% cost reduction plus 5% utilization improvement typically generates $100,000+ annual value against software costs of $15,000-$30,000.