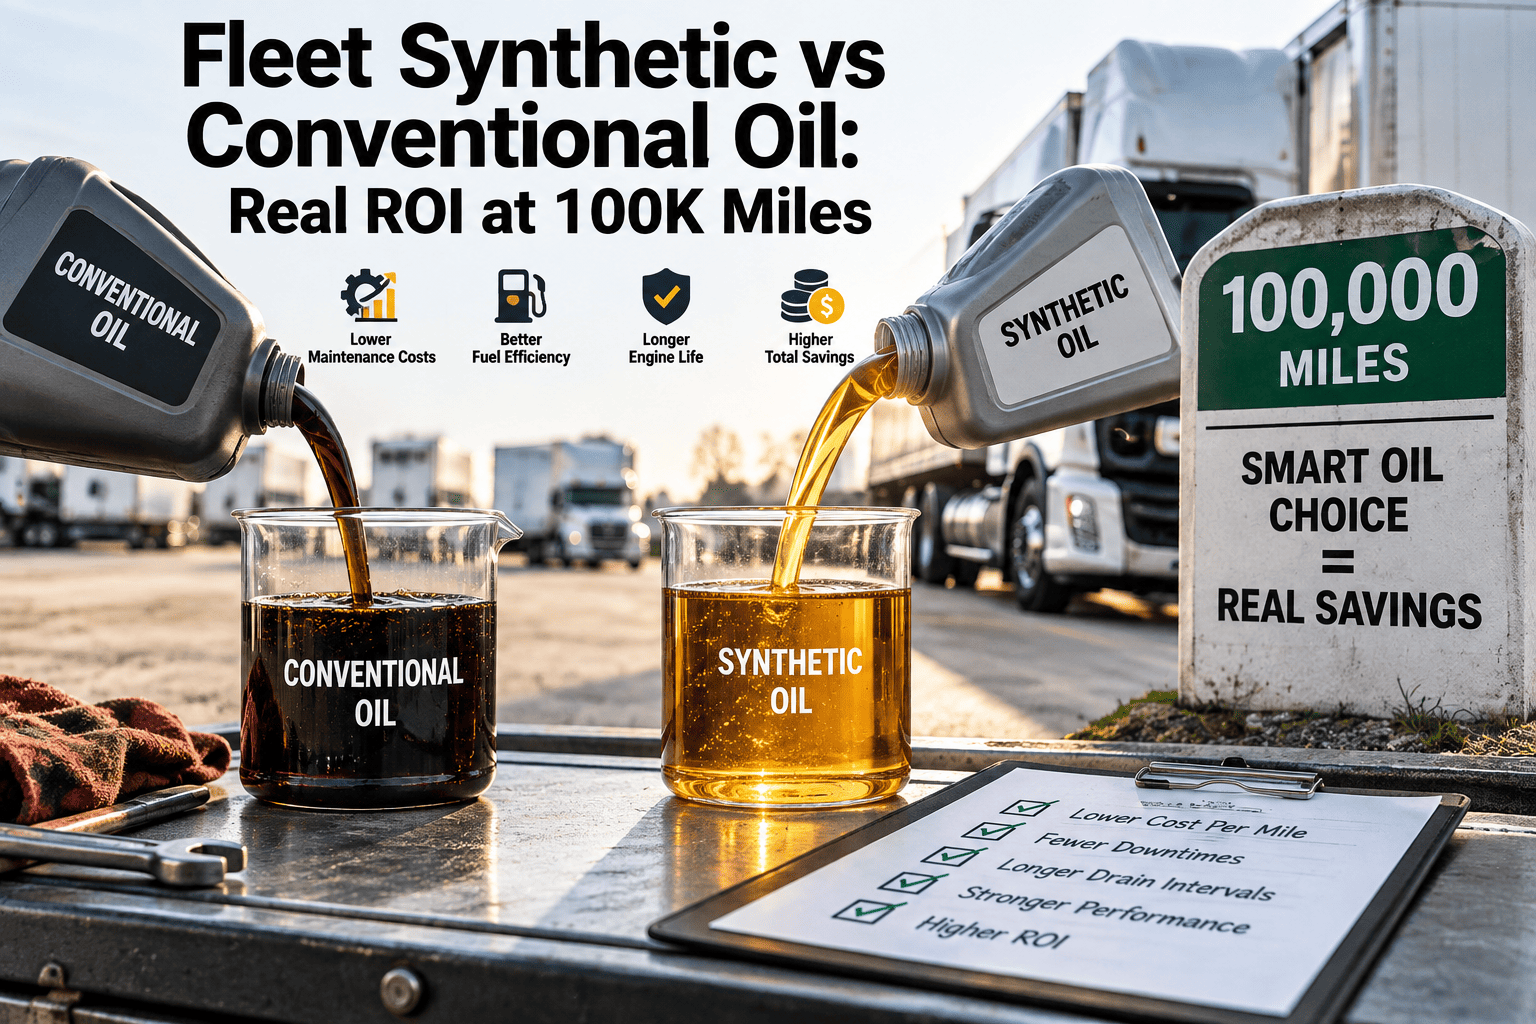
Every fleet manager has run the same math on a napkin: synthetic oil costs three to four times more per change than conventional, so why would anyone switch. The answer only shows up once you stop pricing a single oil change and start pricing a truck's lifetime. Fleets that model synthetic against conventional across a full duty cycle almost always find the premium pays for itself well before the vehicle's 100,000-mile mark, and the gap widens from there. This page walks through the real numbers — not marketing claims — using the metrics a maintenance team can actually verify: drain interval, labor hours, downtime, and wear-related repair rate, with a look at how a CMMS like Oxmaint makes that comparison defensible instead of anecdotal.
FLEET LUBRICANTS · TOTAL COST OF OWNERSHIP · 100K / 250K / 500K MILE ROI
Fleet Synthetic vs Conventional Oil: Real ROI at 100K Miles
Synthetic oil costs more at the pump and more per change. Modeled across a real duty cycle, it is frequently the cheaper choice per mile — and this page shows exactly where the breakeven point falls for your fleet size.
Conventional
5,000–7,500 mi/change
Synthetic Blend
7,500–15,000 mi/change
Full Synthetic
15,000–25,000 mi/change
Why "Synthetic Costs More" Is The Wrong Question For A Fleet
Retail price per quart is the number that scares fleet buyers away from synthetic, and it is also the least useful number in the decision. A fleet does not buy oil by the quart — it buys uptime, drain events, labor hours, and engine life. Comparing sticker price without comparing drain interval is comparing the wrong unit entirely.
The right comparison is cost per mile of lubrication delivered, inclusive of the oil itself, the filter, the labor to perform the change, and the shop bay time that vehicle is off the road instead of earning revenue. Once drain interval is factored in, full synthetic's per-mile lubricant cost frequently lands below conventional, even though the per-change invoice is two to three times higher.
A truck changing conventional oil every 6,000 miles needs roughly four changes to cover the same distance a full synthetic program covers in one 24,000-mile interval — four sets of labor, four filters, four shop visits versus one.
The Cost Components Most Fleets Leave Out Of The Comparison
Fleet managers who compare only the oil price consistently underrate synthetic's advantage, because three of the four real cost components never show up on the oil supplier invoice.
01
Bulk Fluid Cost
Full synthetic bulk pricing typically runs $7–$10 per litre versus $2.50–$4.00 for conventional mineral oil, a real and unavoidable premium at purchase.
02
Technician Labor
Each PM event consumes roughly 1–1.5 hours of bay time regardless of oil type. Fewer changes per year means fewer labor hours billed against the same fleet.
03
Downtime Per Event
A vehicle in the bay is a vehicle not on route. Valuing a PM event at $150–$250 in lost productivity changes the math fast when events are cut in half or more.
04
Wear-Related Repairs
Superior film strength and thermal stability under load reduce bearing, turbo, and ring wear over the engine's life — the cost that never appears on a PM invoice but shows up in overhaul bills.
Modeling Real ROI: 100K, 250K, and 500K Miles
The breakeven point between synthetic and conventional is not a fixed number — it depends on duty cycle, annual mileage, and how aggressively a fleet was already extending conventional drain intervals. What is consistent across the fleets that track this properly is the direction: the gap in favor of synthetic widens, it does not narrow, as miles accumulate.
100K
Breakeven Zone
Roughly 4–7 conventional changes versus 4–7 synthetic changes at extended intervals have occurred by this mark. Labor and downtime savings from fewer events typically offset most of the fluid price premium; wear-rate savings have not yet fully materialized.
250K
Synthetic Pulls Ahead
Cumulative labor hours and PM downtime avoided compound. Engines running full synthetic from an early mileage point typically show measurably lower wear-related repair frequency by this stage, particularly on turbocharged and direct-injection platforms.
500K
Engine Longevity Dividend
This is where the real return shows up: fleets running disciplined synthetic programs report extending productive engine life meaningfully longer than conventional-oil counterparts, delaying the single largest cost a fleet can face — an unplanned engine overhaul or early replacement.
The Environmental Argument, Stated Honestly
Synthetic oil's longer drain interval means fewer used-oil disposal events per vehicle over its life, which most fleets treat as a secondary benefit rather than the primary case for switching. It is a real reduction in waste oil volume and disposal handling, but it should not be the argument that carries a budget decision on its own — the operational and cost-per-mile case is strong enough without needing to lean on sustainability framing to justify itself.
Stop Estimating This Number — Track It
Oxmaint logs every oil change against the asset record, so drain interval, cost per event, and downtime hours are calculated automatically instead of reconstructed from memory at renewal time.
When Conventional Oil Is Still The Right Call
Synthetic is not universally correct, and a fleet that switches every asset without checking application is trading one bad default for another. The decision should be made per vehicle class, not fleet-wide by default.
| Vehicle Profile | Recommended Oil Path | Why |
|---|---|---|
| Older engines, low annual mileage | Conventional or synthetic blend | Low duty cycle rarely accumulates enough miles to recover the fluid premium |
| Turbocharged / direct-injection | Full synthetic | OEM specification frequently requires it; thermal load exceeds conventional's stable range |
| Severe duty, extreme cold or heat | Full synthetic | Cold-start flow and high-temp film strength directly protect against the failure modes of the application |
| High annual mileage, long-haul | Full synthetic | Extended drain interval compounds fastest where mileage accumulates fastest |
| Vehicles near planned disposal | Conventional | Remaining service life is too short to recover the switching cost |
The Hidden Variable: Oil Analysis, Not Oil Type
Fleets that get the most out of either oil type are not choosing brand names — they are running scheduled oil analysis and setting drain intervals from the lab data rather than a generic mileage rule. A synthetic program run on the wrong interval assumption underdelivers just as badly as a conventional program run too long.
01Pull oil analysis samples at every PM event for at least the first 90 days on any new oil program
02Track viscosity breakdown, TBN depletion, and wear metal counts against OEM thresholds, not a flat mileage number
03Segment intervals by duty cycle — severe-duty vocational trucks should never share an interval with long-haul highway units
04Log every result against the asset record so interval extension decisions are defensible during warranty review
05Recalculate the cost-per-mile comparison annually — fuel prices, labor rates, and bulk oil pricing all shift the breakeven point
OEM Specification And Warranty Exposure
The oil decision is not purely financial — it is also a compliance question. An increasing number of OEMs specify full synthetic as a warranty condition for turbocharged and direct-injection platforms, and using conventional oil outside that specification can void coverage on the exact components most likely to fail from insufficient film strength.
Fleets running mixed makes across multiple yards often discover this the hard way, when a warranty claim is denied because the wrong oil grade shows up in service records that were never centralized. Tracking the specification requirement against each asset, not just each make and model, closes that exposure before a claim is filed rather than after.
The same discipline pays off during resale and lease-return inspections. Fleets that can produce a complete, timestamped oil service history — grade, brand, interval, and analysis results — routinely negotiate better residual value than fleets relying on a technician's memory or a paper log that was misplaced two yards ago.
Fuel Economy: The Overlooked Line In The ROI Model
Most synthetic-versus-conventional comparisons stop at drain interval and wear rate, but reduced internal friction from synthetic's more stable molecular structure also shows up in fuel burn. Fleets running full synthetic commonly report a modest but real fuel economy improvement over conventional oil in the same engine and duty cycle.
On a single vehicle that improvement looks small enough to ignore. Multiplied across a fifty-truck fleet running 100,000 miles a year each, even a marginal percentage swings the total cost comparison meaningfully in synthetic's favor, and it is a number that should be pulled into the same cost-per-mile model as labor and downtime rather than treated as a separate line item nobody tracks.
A Practical Rollout Plan For Switching A Fleet
Switching an entire fleet to synthetic overnight is rarely the right move, both because the cash outlay lands all at once and because a phased rollout produces the comparison data a fleet needs to validate its own numbers rather than borrowing someone else's benchmark.
01Start with the highest-mileage, highest-duty-cycle vehicles, since they reach the breakeven point fastest and generate usable data soonest
02Hold a control group on the existing oil program for at least one full service cycle to produce a genuine side-by-side comparison
03Pull oil analysis on both groups at every interval, not just the synthetic group, so the comparison is symmetric
04Review cost-per-mile data at 90 days, not at the next annual budget cycle — early course correction is cheap, late correction is not
05Expand to the full fleet only once the vehicle-class-specific breakeven point is confirmed with real numbers
Building The Comparison Into Your Maintenance Workflow
The math in this article only holds if the underlying data is captured consistently, and that is where most fleets lose the thread. Oil type, drain interval, labor hours, and downtime live in different systems — a fuel card report, a shop invoice folder, a spreadsheet someone updates quarterly — and by the time anyone tries to reconstruct the true cost per mile, half the data is missing or estimated.
A CMMS-driven preventive maintenance schedule closes that gap. Oxmaint ties every oil change work order to the specific asset, the mileage at service, the labor hours logged, and the parts and fluid cost recorded at close-out. Oil analysis results attach directly to the same asset record, so a fleet manager reviewing interval extension has lab data and cost history in one place instead of three. Inventory tracking flags when bulk synthetic stock is running low before a route gets stranded waiting on fluid, and reporting rolls the whole fleet's cost-per-mile up automatically instead of requiring a manual quarterly reconciliation.
For a fleet running fifty, one hundred, or five hundred vehicles across mixed duty cycles, that structured record is the only way the synthetic-versus-conventional decision stops being a guess and becomes a number the finance team will actually sign off on.
What This Looks Like For Fleets Of Different Sizes
The math behind synthetic ROI does not change with fleet size, but the practical rollout does. A ten-vehicle fleet can switch its whole roster at once and absorb the cash flow impact in a single budget cycle. A three-hundred-vehicle fleet across a dozen yards needs a phased plan, consistent specification enforcement across every location, and a way to catch the yard that quietly reverts to whatever oil the nearest supplier has on the shelf.
Larger fleets also have more to gain from getting this right, simply because the labor and downtime savings compound across more assets. A 22% reduction in wear-related repair frequency on a ten-truck fleet is a nice result. The same percentage across three hundred trucks is a budget line significant enough to fund the CMMS platform that tracks it several times over.
Fleet Synthetic Oil ROI: Common Questions
At what mileage does synthetic oil typically break even against conventional for a fleet?+
Most fleets see labor and downtime savings offset the fluid premium somewhere around the 75,000 to 100,000-mile mark per vehicle, with the wear-reduction dividend compounding well beyond that point.
Do all engines need full synthetic, or is a blend enough?
Turbocharged and direct-injection engines increasingly require full synthetic by OEM specification. Older naturally aspirated engines on lower annual mileage can often run a blend without losing meaningful ROI.
How do we know if we can safely extend our drain interval?
Oil analysis, not a calendar rule, should set the interval. Track viscosity, TBN, and wear metals against OEM limits before extending, and log results against the asset so the decision is defensible. Start a free trial to see how Oxmaint attaches analysis data to each asset automatically.
Is the ROI different for regional versus long-haul fleets?
Yes — long-haul fleets accumulate miles faster, so they reach the breakeven point sooner in calendar time even though the per-mile math is similar. Regional and vocational duty cycles take longer to recover the premium purely because annual mileage is lower.
What is the single biggest mistake fleets make when switching to synthetic?
Switching the fluid but keeping the old conventional-era drain interval. That captures none of the labor and downtime savings that make the switch worthwhile in the first place.
Run Your Own Fleet's Oil ROI Number — Not An Industry Average
Every fleet's breakeven point is different once duty cycle, labor rate, and downtime cost are plugged in. Oxmaint tracks the data that makes that number real, asset by asset, from the first oil change forward.